Original Full Length Article
Diffusion tensor imaging and magnetic resonance spectroscopy
assessment of cancellous bone quality in femoral neck of healthy,
osteopenic and osteoporotic subjects at 3T: Preliminary experience
Guglielmo Manenti
a, Silvia Capuani
a,b,⁎
, Ezio Fanucci
a, Elie Parfait Assako
a, Salvatore Masala
a,
Roberto Sorge
c, Riccardo Iundusi
d, Umberto Tarantino
d, Giovanni Simonetti
aa
Department of Diagnostic and Interventional Radiology, Molecular Imaging and Radiotherapy, PTV Foundation,“Tor Vergata” University of Rome, Viale Oxford 81, 00133 Rome, Italy b
CNR-IPCF UOS Roma Sapienza, Physics Department Sapienza University of Rome, piazzale Aldo Moro 5, 00185 Rome, Italy c
Institute of Medical Informatics and Biometry, University“Tor Vergata”, Rome, Viale Oxford 81, 00133 Rome, Italy
dDepartment of Orthopaedics and Traumatology, PTV Foundation,“Tor Vergata” University of Rome, Viale Oxford 81, 00133 Rome, Italy
a b s t r a c t
a r t i c l e i n f o
Article history: Received 18 June 2012 Revised 18 January 2013 Accepted 11 March 2013 Available online 16 March 2013 Edited by: Harry Genant Keywords:Diffusion tensor imaging (DTI) Magnetic resonance spectroscopy (1
H-MRS) Bone marrow fat fraction (FF)
Femur Osteoporosis
Fractional anisotropy (FA)
We assessed the potential of diffusion tensor imaging (DTI) in combination with proton magnetic resonance spectroscopy (1H-MRS), in cancellous bone quality evaluation of the femoral neck in postmenopausal women.
Introduction: DTI allows for non-invasive microarchitectural characterization of heterogeneous tissue. In this work we hypothesized that DTI parameters mean diffusivity (MD) and fractional anisotropy (FA) of bone marrow water, can provide information about microstructural changes that occur with the development of osteoporosis disease. Because osteoporosis is associated with increased bone marrow fat content, which in principal can alter DTI parameters, the goal of this study was to examine the potential of MD and FA, in com-bination with bone marrow fat fraction (FF), to discriminate between healthy, osteopenic and osteoporotic subjects, classified according to DXA criteria.
Materials and methods: Forty postmenopausal women (mean age, 68.7 years; range 52–81 years), underwent a Dual-energy X-ray absorptiometry (DXA) examination in femoral neck, to be classified as healthy (n = 12), osteopenic (n = 14) and osteoporotic (n = 14) subjects.1H-MRS and DTI (with b value = 2500 s/mm2) of
femoral neck were obtained in each subject at 3T. The study protocol was approved by local Ethics Committee. MD, FA, FF and MD/FF, FA/FF were obtained and compared among the three bone-density groups.
One-way ANOVA with multiple comparisons Bonferroni test and Pearson correlation analysis were applied. Receiver operating characteristic (ROC) curve analysis was also performed.
Results: Reproducibility of DTI measures was satisfactory. CV was approximately 2%–3% for MD and 4%–5% for FA measurements. Moreover, no significant difference was found in both MD and FA measurements between two separate sessions (median 34 days apart) comprised of six healthy volunteers.
FF was able to discriminate between healthy and osteoporotic subjects only. Conversely MD and FA were able to discriminate healthy from osteopenic and healthy from osteoporotic subjects, but they were not able to discriminate between osteopenic and osteoporotic patients. A significant correlation between MD and FF was observed in healthy group only. A moderate correlation was found between MD and T-score when all groups together are considered. No significant correlation was found between MD and T-score within groups. A significant positive correlation between FA and FF was found in both osteopenic and osteoporotic groups. Vice-versa no correlation between FA and FF was observed in healthy group. A high significant positive cor-relation was found between FA and T-score in all groups together, in healthy and in osteoporotic groups. MD/FF and FA/FF are characterized by a higher sensitivity and specificity compared to MD and FA in the discrimination between healthy, and osteoporotic subjects.
MD/FF vs FA/FF graph extracted from femoral neck, identify all healthy individuals according to DXA results. Conclusion: DTI-1H-MRS protocol performed in femoral neck seems to be highly sensitive and speci
fic in identifying healthy subjects.
A MR exam is more expensive when compared to a DXA investigation. However, even though DXA BMD eval-uation has been the accepted standard for osteoporosis diagnosis, DXA result has a low predictive value on patients' risk for future fractures. Thus, new approaches for examining patients at risk for developing osteo-porosis would be desirable.
⁎ Corresponding author at: Physics Department Sapienza University of Rome, Piazzale Aldo Moro 2, 00185 Rome, Italy. Fax: +39 0649913928. E-mail address:[email protected](S. Capuani).
8756-3282/$– see front matter © 2013 Elsevier Inc. All rights reserved. http://dx.doi.org/10.1016/j.bone.2013.03.004
Contents lists available atSciVerse ScienceDirect
Bone
Preliminary results showed here suggest that future studies on a larger population based on DTI assessment in the femoral neck, in combination with1H-MRS investigations, might allow screening of high-risk
popula-tions and the establishment of cut-off values of normality, with potential application of the method to single subjects.
© 2013 Elsevier Inc. All rights reserved.
Introduction
Osteoporosis is a systemic disorder of bone metabolism characterized by a progressive reduction of mineral bone mass and microarchitectural deterioration of bone tissue, which increase the risk of bone fractures
[1,2]. The clinical diagnosis of osteoporosis is currently based on the quantification of bone mineral density (BMD) performed by Dual-energy X-ray absorptiometry (DXA) of those skeletal sites with high trabecular content, such as spine and proximal femur[3]. However, this diagnostic tool is characterized by a low predictive value on patients' risk of reporting bone fracture[4,5]. This lack of sensitivity is likely to be due to the partial information that BMD provides on cancellous bone characteristics, assessing exclusively its mineral component[4,6]. Other factors, such as topological properties of trabecular microstructure, bone turnover, and composition of bone marrow may contribute in determining bone strength and its resistance to fracture[7]. In this re-gard, unlike DXA, magnetic resonance (MR) techniques allow investiga-tion of both trabecular networks and bone marrow[2,8–12]providing some additional information on the physiological and functional changes associated with osteoporosis[7]. MR spectroscopy (1H-MRS) can be used to quantify bone marrow fats and for assessing the fat fraction (FF) in bone marrow. As evidence that other components besides the mineral component may be important in the evaluation of bone strength, it has been recently underlined that osteoporotic decreases in the BMD corre-late with increases in the yellow marrow in the lumbar vertebrae
[13–20]. Similarfindings have been observed in the proximal femur
[9,21].
Diffusion weighted imaging (DWI) has also been used to investi-gate vertebral bone although so far it has failed to show a clear rela-tionship between apparent diffusion coefficient (ADC) and BMD
[17,22–24]. A more accurate investigation of trabecular bone archi-tecture than that provided by DWI could potentially be found with diffusion tensor imaging (DTI) methods[25]as recently suggested in in vitro investigations[26]. From DTI measurements, it is possible to derive the mean diffusivity (MD) of water in tissues and various measures of its diffusion anisotropy, such as the fractional anisotropy (FA). DTI has been extensively used to study the structure of ordered biological tissue[27–29]. In this work, we hypothesized that MD may be sensitive to the mean pore size increase in cancellous bone and that FA may be sensitive to variations of trabecular network aniso-tropy which occur with the onset of the osteoporotic disease.
We have also taken into account that, in cancellous bone, bone marrow water is primarily restricted between bone trabeculae and bone marrow fat[30]. As a consequence, both FA and MD of bone marrow water in cancellous bone are in principal affected by the tra-becular network and by the FF amount[30]. Thus, we performed this preliminary study to assess the potential of MD and FA in combina-tion with FF quantification in discriminating between healthy and osteoporotic women. To achieve this goal, we examined the femoral neck of healthy, osteopenic and osteoporotic subjects at 3T MRI, as classified by the DXA examination in femoral neck.
Materials and methods Subjects
Forty Caucasian postmenopausal women (mean age, 68.7 ± 8.9 years; age range, 52–81 years) were recruited between May
2010 and March 2011. The eligibility for enrollment was assessed on the base of their BMD measurements and with questionnaires focusing on personal data. Candidates were not enrolled if they had clinical evidence or history of metabolic bone disease; focal lesions of the femur; neoplastic disease; contraindications to the use of MRI; previous hip surgery or irradiation; hip trauma; current use of steroids or hormone replacement therapy. Subjects assuming osteo-porotic medication based on bisphosphonates were also excluded.
Three healthy subjects from the overall study cohort were scanned to optimize DTI protocol.
In order to evaluate the reproducibility of the diffusion parameters, six healthy subjects from the overall study cohort were re-scanned in August 2012 on two separate sessions using identical scanning proto-cols (median 34 days apart).
The study protocol was approved by the local Ethics Committee, and written informed consent was obtained from all participants prior to MR examination.
DXA examination
The forty study subjects underwent femoral densitometry (Lunar, iDXA, General Electric Healthcare, USA) 1–15 days before entering the MR protocol. BMDs were measured at the level of the left femur and T-scores in femoral neck were calculated for each subject. No BMD adjustment was made for the marrow fat fraction[31,32]. The study pop-ulation was divided into three groups (3): healthy bone density (study subjects with T-score≥ −1.0), osteopenia (−2.5 b T-score b −1.0), and osteoporosis (T-score≤ −2.5).
MR protocols
MR investigations were performed using a 3T MR imaging system (Achieva, Philips Healthcare, Best, The Netherlands) with a maximum gradient strength of 80 mT/m and a maximal slew rate 400 mT/m/ms. A 6-channel torso phased-array coil was used. All the MR pulse sequences used by the radiologists for excluding the presence of poten-tially confounding bone anomalies and for guiding the placement of the spectroscopic volume of interest (VOI) in the femoral neck, are listed in
Table 1, together with pulse sequences and scan parameters used for applying DTI and1H-MRS protocol. The staticfield homogeneity was
optimized in the volume of interest using an automated, second-order shimming routine provided by the vendor.
Due to the presence of internal gradients generated by the mag-netic susceptibility differences between bone marrow components and solid bone[30,33–35], with a subsequent reduction of the T2*, a careful adjustment of the sequence parameters is required.
In thefirst phase of the work, in order to minimize image distortions, different scans were performed in one healthy subject, to select the best echo planar imaging (EPI) factor for the segmented (interleaved) EPI sequence to obtain a reasonable compromise between the total acquisi-tion time and the minimizaacquisi-tion of off resonance effects[35].
Furthermore, to optimize fat suppression, pilot studies were performed to select the best spectrally selective adiabatic inversion recovery (SPAIR) pulse, and its spectral width (SW), to provide a maximum contrast-to-noise ratio between the water and residual chemical shift artifact (Table 1). Finally, in order to select the opti-mum b-value to perform DTI in femoral neck, the diffusion-weighted decay signal as a function of b values equal to 0, 1000, 2000, 3000, and 5000 s/mm2were collected in three healthy subjects
from the overall study cohort (Fig. 1), together with the signal to noise ratio (SNR) of the b = 0 and b = 2500 s/mm2images.
We select b = 2500 s/mm2to obtain the best compromise
be-tween a sufficient SNR of MD and FA maps and a sufficient diffusion weighted to detect slow diffusion regime of bone marrow water restricted between fat and bone[30]. Moreover, even if we use high b-values and the system is highly heterogeneous, choosing b = 2500 s/mm2, we are sure to be in a regime of Gaussian diffusion approximation[36](Fig. 1). Finally, because SNR of b = 0 images is approximately equal to 7 and the trace of diffusion tensor approximately equal to 400μm2/s in the three healthy subjects, b = 2500 s/mm2is
equal to or less than the maximum b value that can be used to avoid significant background noise effects on FA measurements[37].
Therefore, all diffusion-weighted images to perform DTI protocol, were acquired afterward with b = 0, 2500 s/mm2.
However, because the SNR of b = 2500 s/mm2images is
approx-imately equal to 2 and the reliability of tensor contrast depends on
the noise level [38] we cannot exclude an underestimation of the MD and an overestimation of the anisotropy of cancellous bone
[38,39]. Data analysis MR spectroscopic data
All spectra were analyzed using the SpectroView software. FF, was calculated for each subject according to the following equation: FF = [Ifat/ (Ifat+ Iwat)], where Iwatis the water peak area (at about
4.65 ppm) and Ifatis the sum of partially overlapping lipid peaks
area (at about 0.9, 1.3, 1.6, 2.0, 2.3, and 2.8 ppm) plus lipid peak area at about 5.3 ppm. Since the TR chosen (4 s) was much greater (more than 3 times) than the longest T1[40], no correction for T1 relaxation losses was applied. Moreover, no correction for T2 relaxa-tion was applied because second order shimming procedure provides good quality of all spectra and they were acquired with TE = 28 ms which is much lower than T2 of each line in bone marrow spectra
[40]. DTI data
Processing of the DWI images involved eddy current distortion correction and calculation of the diffusion tensor elements and its derived measures. The Philips Research Imaging Development Envi-ronment (PRIDE) Diffusion Registration tool (version 6.0) was used to correct spatial distortions in the DW images by registering them to their corresponding b = 0 image. Then, for each voxel in the DTI data sets, MD and FA were calculated.
To measure MD and FA in the femoral neck, a rectangular (12 × 15 mm) region of interest (ROI) was placed in the femur neck location in b = 0 image. This ROI was then automatically trans-posed onto two maps (MD and FA) generated by the analysis soft-ware (Fig. 2). MD and FA values of the femoral neck were obtained by averaging the values obtained from the 3 slices selected.
Because both MD and FA are in principle affected by FF as well as BMD, the normalized DTI parameters, with respect to the FF variable– MD/FF and FA/FF– were also taken into account.
Statistical analysis
Mean ± 1 standard deviation (SD) values were calculated for each variable. Differences between groups were assessed with one-way ANOVA. Multiple comparisons were made with the Bonferroni correc-tion. Relationship between pairs of variables was assessed with linear correlation analysis (Pearson's R coefficient). P values b0.05 were considered statistically significant.
Receiver operating characteristic (ROC) curve analysis was per-formed to test the sensitivity/specificity of DTI and DTI/FF parameters in discriminating between the three bone density groups. The areas
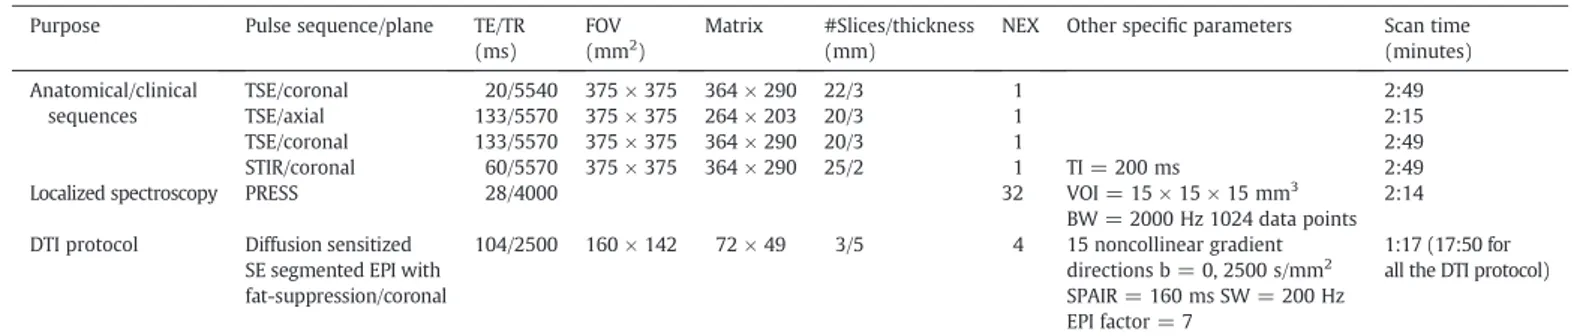
Table 1
Sequences and scan parameters used for: i) anatomical/clinical purpose, ii) generating MD and FA maps, and iii) quantifying FF. Purpose Pulse sequence/plane TE/TR
(ms)
FOV (mm2)
Matrix #Slices/thickness (mm)
NEX Other specific parameters Scan time (minutes) Anatomical/clinical sequences TSE/coronal 20/5540 375 × 375 364 × 290 22/3 1 2:49 TSE/axial 133/5570 375 × 375 264 × 203 20/3 1 2:15 TSE/coronal 133/5570 375 × 375 364 × 290 20/3 1 2:49 STIR/coronal 60/5570 375 × 375 364 × 290 25/2 1 TI = 200 ms 2:49
Localized spectroscopy PRESS 28/4000 32 VOI = 15 × 15 × 15 mm3
BW = 2000 Hz 1024 data points 2:14 DTI protocol Diffusion sensitized
SE segmented EPI with fat-suppression/coronal 104/2500 160 × 142 72 × 49 3/5 4 15 noncollinear gradient directions b = 0, 2500 s/mm2 SPAIR = 160 ms SW = 200 Hz EPI factor = 7 1:17 (17:50 for all the DTI protocol)
Note.— Echo time (TE), repetition time (TR), field of view (FOV), image matrix size (matrix), number of excitations (NEX), Turbo spin echo (TSE), short T1 inversion recovery (STIR), inversion time (TI), point resolved spectroscopy (PRESS), volume of interest (VOI), bandwidth (BW), spin echo (SE), echo planar imaging (EPI), b-value (b), spectrally selective adiabatic inversion recovery (SPAIR), spectral width (SW), number of k-space profiles collected per excitation (EPI factor).
Fig. 1. Diffusion-sensitized EPI signal behavior of water in femoral neck. The ratio of signal with diffusion gradient S(b) to signal without diffusion gradient S(0) decay as a function of b-values is displayed. Squares indicate mean values obtained from three healthy subjects and the bars their SD. At larger b values, the SD of the signal intensity increased due to decreasing SNR. SNR of b = 0 and b = 2500 s/mm2
images was approx-imately equal to 7 and 2, respectively. Data was obtained using diffusion gradient along phase direction, and wasfitted to the function: S(b)/S(0) = exp(−bD), where D is the apparent diffusion coefficient along phase direction and b is the attenuation factor which depends on the strength and timing of the diffusion gradient. In the inserted panel on top right, the logarithmic function of S(b)/S(0) as a function of b is also displayed to immediately show the departure of water data decay from monoexponential curve (displayed as a black line), from the data point at b = 3000 s/mm2
. Conversely data points are correctlyfitted by a mono-exponential decay function when the b value is less than 3000 s/mm2.
under the ROC curves, their statistical comparison (P value) cut-off values, sensitivity and specificity were calculated. Moreover, the contin-gency table[41]and the concordance between MR methods and DXA method were obtained.
Statistical analyses were carried out with SPSS software, version 15.0 (SPSS Inc., Chicago, IL).
Reproducibility of DTI measures
In order to document the reproducibility of diffusion parameters MD and FA in femoral neck, and their short and long-term reliability, six healthy subjects from the overall study cohort (age range 55–69 years), were re-scanned on two separate sessions using identi-cal scanning protocols (median 34 days apart). For each session the same DTI protocol (listed inTable 1) was acquired three times over a period of 1 h without repositioning the subject in the MR scanner. The acquisition time for one DTI run was approximately 18 min. To determine the short term reproducibility of FA and MD measures in the femoral neck, we calculated coefficients of variation CVS(CV is
defined as the ratio of the SD to the mean) using the mean and the SD of three consecutive acquisitions obtained for each volunteer. The long term reproducibility was determined by computing CVLobtained
after calculating the variance of the mean of the two separate scanning sessions for each individual. Moreover a paired t-test, performed on
results obtained in the two separate sessions, was also used to assess the long-term reproducibility of the technique.
Results Subjects
Three subjects were excluded from the analysis due to motion artifacts on DWI images (two subjects) or due to incomplete acquisition of the MR protocol (one subject). Thefinal number of women evaluated for this study was thirty seven (mean age, 70.6 ± 6.8 years; age range, 55–80 years) (Table 2).
No correlation was found between subjects' T-scores and age, and no age, weight, height and BMI differences were statistically significant among groups (Table 2). No correlation between the body mass index (BMI) and the DXA[42]or the MR parameters was observed.
FF
Mean FF values (Table 2) were significantly different (P = 0.029) between healthy and osteoporotic subjects only (Fig. 2). Significant correlations between FF and T-score (R =−0.58) and between FF and age (R = 0.52) were observed when all groups together are
Fig. 2. Representative MD (a) and FA (b) coronal maps of the left femur of a subject (78-year-old healthy woman with femoral neck T-score,−0.7) obtained at 3T. In the figure, the skeletal location investigated (the femoral neck) with its manually drawn ROIs are also displayed. Two different MR spectra obtained from femoral neck region of a 67 y healthy (d) and a 60 y osteoporotic (e) subject are also reported as an example, together with axial and coronal images (c) used to place the VOI in the femoral neck. Letter w, indicates water resonance at approximately 4.7 ppm partially overlapped to the lipid resonance at 5.3 ppm. The partially overlapping lipid resonances (at approximately 0.9, 1.3, 2.0, 2.3 and 2.8 ppm) used to calculate the BM fat content are also visible. Note the enhanced water peak in the d) spectrum collected from the healthy subject.
considered. After adjusting for age, a significant correlation was only found between reduced BMD cohort grouped together and T-score (R =−0.3).
DTI parameters
Reproducibility of DTI measures was satisfactory. CVSwas
approxi-mately 2%–3% for MD and 4%–5% for FA measurements (Table 3). How-ever, because subjects were not repositioned between scans to assess the short range reliability of the study, the CVSvalues listed inTable 3
could be worse. The CVLobtained after calculating the variance of the
mean of the two scanning days for each individual was approximately 2%–3% for MD and 2%–5% for FA measurements (Table 3). Moreover, no significant difference was found in both MD and FA measurements between the two separate sessions comprised of six healthy volunteers (Table 3). These results suggest that the DTI technique to investigate cancellous bone in femoral neck is reliable and repeatable when the subject is scanned after a longer time period.
MD values were different (Pb 0.001) between healthy and osteo-porotic and between (Pb 0.001) healthy and osteopenic subjects. On the other hand, osteopenic and osteoporotic patients cannot be dis-criminated on the basis of their MD values. A significant correlation between MD and FF was observed (R = 0.75) in the healthy group (Fig. 3a). A moderate correlation was found between MD and T-score (R = 0.41, P = 0.01), when all groups together are considered. No sig-nificant correlation was found between MD and T-score within groups (Fig. 3b). FA values were different (Pb 0.001) between healthy and osteoporotic and between (P = 0.025) healthy and osteopenic sub-jects. Conversely, osteopenic and osteoporotic subjects cannot be dis-criminated on the basis of their FA values.
A significant positive correlation between FA and FF was found in both osteopenic (R = 0.63) and osteoporotic (R = 0.70) groups (Fig. 3c). Vice-versa no correlation between FA and FF was observed in the healthy group or when all subjects are considered. Results displayed inFig. 3c, may be not related to physiopathologic changes due to osteoporosis. Indeed, when FF increases the water amount decreases with a consequent reduction of the signal to noise ratio of diffusion images. Therefore FA values increase, due to the increase of the noise[38,39].
A high significant positive correlation was found between FA and T-score in all groups together (R = 0.66, Pb 0.0001) in the healthy (R = 0.7) and in the osteoporotic (R = 0.61) groups (Fig. 3d).
FA/FF versus T-score in the femoral neck showed a positive signi fi-cant correlation in healthy and osteopenic groups (R = 0.79, and R = 0.62, respectively) (Fig. 3f). Unlike the behavior of FA vs T-score, FA/FF vs T-score values were significantly different (P = 0.012) between osteopenic and osteoporotic patients and between healthy and osteoporotic subjects (Pb 0.0001), while they didn't discriminate between healthy and osteopenic subjects. A correlation was found between FA/FF and T-score (R = 0.76, Pb 0.0001), higher than that between FA and T-score, when all groups together were considered. MD/FF showed a behavior similar to MD, but a higher correlation between MD/FF and T-score (R = 0.50, Pb 0.001) was found when compared to that between MD and T-score (Fig. 3e).
Diagnostic performance of DTI and DTI plus FF protocol
The sensitivity and the specificity for the detection of healthy subjects were 90.9% and 84.6% using MD alone, while they were 72.7% and 76.9% using FA alone. Furthermore, the sensitivity and the
Table 2
Demographic, DXA and MR data in normal (H), osteopenic (OPE) and osteoporotic (OPO) groups. Bone density group Age
(y) Weight (kg) Height (cm) BMI (kg/m2) BMD FN T-score FN FF MD (μm2/s) FA H N 11 11 11 11 11 11 11 11 11 Mean 70.2 65.5 157.0 26.60 0.894 −0.736 0.73927 403.27 0.816 SD 8.9 7.1 4.5 2.80 0.031 0.2767 0.087216 75.365 0.041 OPE N 13 13 13 13 13 13 13 13 13 Mean 69.2 63.5 159.8 24.87 0.771 −1738 0.75750 219.38 0.757 SD 6.9 10.4 2.7 4.31 0.0460 0.3572 0.112278 115.368 0.061 OPO N 13 13 13 13 13 13 13 13 13 Mean 72.2 64.5 159.8 25.52 0.629 −3.146 0.83708 228.15 0.719 SD 4.46 8.7 9.5 2.91 0.0678 0.4313 0.051981 71.024 0.043 OPE + OPO N 26 26 26 26 26 26 26 26 26 Mean 71.2 63.4 159.7 25.09 0.678 −2.5 0.793 229.55 0.733 SD 5.9 9.7 7.0 3.65 0.113 0.84 0.9 96.92 0.058 Total N 37 37 37 37 37 37 37 37 37 Mean 70.6 64.4 159.0 25.61 0.765 −1.935 0.78203 289.14 0.761 SD 6.85 8.70 6.3 3.41 0.119 1.0528 0.094916 120.947 0.062
Note.— N indicates the number of subjects; BMI, body mass index; BMD, bone mineral density; FN, femoral neck; FF, fat fraction; MD, mean diffusivity; FA, fractional anisotropy.
Table 3
The short and long-time reliability study for six healthy subjects.
MD FA
Session 1 Session 2 Session 1 Session 2
Volunteer Mean SD CVS Mean
(μm2/s) SD (μm2/s) CVS CVL Mean SD CV Mean SD CVS CVL 1 384.83 8.94 0.023 399.67 7.98 0.020 0.019 0.863 0.034 0.039 0.845 0.025 0.039 0.021 2 397.00 8.18 0.020 402.60 9.37 0.023 0.014 0.825 0.034 0.041 0.808 0.023 0.047 0.021 3 416.67 10.10 0.024 429.27 8.48 0.020 0.030 0.816 0.040 0.049 0.788 0.025 0.045 0.034 4 437.63 10.14 0.023 449.83 9.28 0.020 0.029 0.798 0.039 0.049 0.769 0.026 0.045 0.038 5 343.50 11.62 0.029 346.50 8.53 0.024 0.010 0.882 0.034 0.039 0.842 0.025 0.041 0.046 6 390.73 7.47 0.019 379.40 7.48 0.020 0.029 0.804 0.031 0.039 0.793 0.022 0.049 0.015 Total 394.95 31.63 401.21 36.40 0.831 0.033 0.807 0.030
specificity for the detection of osteoporotic patients were 75.0% and 82.0% using FA alone, with 84.6% and 61.9% using FF alone. As a conse-quence, if MD of a single subject is greater than 320μm2/s, the subject
is identified as a healthy one, and if FA is less than or higher than 0.74 the subject is identified as an osteopenic or an osteoporotic patient, respectively (Fig. 4). The concordance between MD, FA and DXA methods was equal to 67.6%. Moreover, the sensitivity and the specificity for the detection of healthy subjects were 100% and 91.3% using MD/FF alone, with a cut-off value of 422μm2/s, while they were 92.3% and
85.7% using FA/FF alone, with a cut-off value of 0.915 for selecting osteo-porotic patients (Fig. 4). The concordance between MD/FF, FA/FF and DXA methods was equal to 81.1%.
Discussion
Diffusion MR images can measure water proton displacements at the cellular level by probing motion on the micrometer length scale which is orders of magnitude smaller than the macroscopic MR resolution (usually 1–3 mm). In Gaussian diffusion approxima-tion, mean square displacement (MSD) of diffusing water molecules is linearly proportional to the ADC and the time t during which the diffusion process is observed (MSD∝ADC*t)[43,44]. By using the MSD relation it is possible to evaluate the length scale, l, probed by diffusing water: l = MSD1/2. In this work we used t≈ 100 ms and
we measured ADC approximately equal to 300μm2
/s. Therefore,
Fig. 3. Scatter plots show the correlation between MD, FA values and FF values, a), c), between MD, FA and T-score, b), d) and between MD/FF, FA/FF and T-score, e), f), respectively. Data for each bone density group defined on the basis of their BMD (healthy: blue diamond, H; osteopenia: green triangle, OPE; osteoporosis: red square, OPO) was analyzed by linear regression. Pearson's coefficient R and their P value are displayed when the correlation is significant. Moreover, the black line indicates the linear regression function for all subjects, when the correlation is significant. A moderate correlation was found between MD and T-score (R = 0.41, P = 0.01), and between MD/FF and T-score (R = 0.5, P = 0.0015) when all groups together are considered (graphs b) and e), respectively). A correlation was found between FA/FF and T-score (R = 0.76, Pb 0.0001), higher than that between FA and T-score (R = 0.66, Pb 0.0001), when all groups together were considered (graphs d) and f), respectively).
we investigated cancellous bone by probing a length scale approxi-mately equal to 10μm.
DTI parameters MD and FA provide an exquisite and useful tool for non-invasive and intravoxel investigation of human tissue micro-structures[27–29]. However, the application of DTI to the cancellous bone is not completely straightforward, as diffusion MRI in this area is hampered by the need for fat suppression, high b values and by the scarce amount of water with a subsequent low signal[45]. Moreover, diffusion in cancellous bone is affected by strong internal gradients due to magnetic susceptibly differences[40]localized at the interface between bone and water component of bone marrow, which provide image distortions.
In this study, a diffusion weighted segmented EPI approach with fat suppression and b = 2500 s/mm2 was used to perform DTI in
the femoral neck.
The sensitivity of diffusion-weighted imaging to water motion can be varied by changing the b value. The higher the value b, the stronger the diffusion weighting. A b value equal to 1000 s/mm2is the optimal one to
measure diffusion of free water which is of the order of 10−3s/mm2.
However water diffusion is not free within tissues, but hindered and modulated by many mechanisms (restriction in closed spaces, tortuosity around obstacles, etc.). Specifically, in this work, we hypothesized that in cancellous bone, bone marrow water is primarily restricted between bone trabeculae and bone marrow fat [30]. Therefore, water shows a slower dynamic compared to that of free water. In particular, since the amount of bone-marrow water compared to bone-marrow fat is higher in vertebrae than in the femoral neck,
water dynamic in the femoral neck is more restricted than in verte-brae. As a consequence, to optimize the measurements of water with a slower dynamic, higher b-values compared to those employed to perform DWI in vertebrae[17,22–24,45,46]were used. In this work, by selecting b = 2500 s/mm2, we measured an averaged MD
approxi-mately equal to 3∗ 10−4s/mm2in the femoral neck.
This study shows significant differences in FA and MD indices in the femoral neck of postmenopausal women characterized by differ-ent BMD.
Because the results discussed here highlight a strong correlation between FA and T-score, they underline the greatest potential of a DTI rather than a DWI approach[17,22–24,46], to assess osteoporosis in cancellous bone.
A good agreement between our FA versus T-score results and Ueda et al. results obtained in vertebrae[24]was observed in the healthy group. Unlike the contradictory results obtained in vertebral cancellous bone [17,22–24], a clear relationship between MD and T-score was found in the femoral neck. These differences between our MD results and those obtained in vertebrae, are due to a slower water dynamic investigated in this study compared to that in verte-bral bone[17,22–24].
Another important consequence of the use of high b values in cancellous bone investigations is to strongly reduce the perfusion effects[22]. In biological tissues, microscopic motions of water in-clude molecular diffusion and microcirculation of blood in veins and the capillary network. It is well known that, in DWI experiments, the relative contribution of diffusion and perfusion to the observed signal attenuation is dependent on the b value used. Perfusion affects the ADC value at low b values, while increasing the b value signal attenuation is more and more due to the diffusion process[47]. The perfusion process is thus responsible of an overestimation of MD
[22,47]. In this regard, our MD values are lower than those previously reported[17,22–24].
Data reported here shows that MD depends on both FF and T-score and that FF results, are well comparable to data reported in literature[9,21]. Healthy data points displayed inFigs. 3a and b un-derline changes in MD mainly due to FF variations. By contrast, MD data points of pathological individuals as a function of FF and T-score are not characterized by a clear trend. Indeed, in these cases, both FF and T-score vary. Similarly, healthy data points under-line changes in FA mainly due to T-score variations, while FA versus FF of healthy subjects is not characterized by a well defined trend (Figs. 3c and d). In particular our data underlined that FA is character-ized by a decreasing trend when moving from the healthy to the osteoporotic group. As highlighted above, FA results shown in this work are related to anisotropic variations that occur at a length scale of approximately10μm. Our results indicate that, from a micro-scopic point of view, with the development of osteoporosis, the local anisotropy inside the cancellous bone pores decreases. Because bone marrow water, is more prevalent in the boundary zone while fat occupies primarily the central zone of the pore[30], FA variations could be due to changes in the inner surface of pores (as an example associated with the roughness of the trabeculae surface or to the end-osteum microstructure). We may hypothesize that with the develop-ment of the osteoporosis the environdevelop-ment probed by water restricted between fat and bone becomes more isotropic due to the structural rearrangement of the endosteum cell lines or of the trabeculae sur-face. On the other hand, using a different length scale of the order of millimeters, trabecular bone anisotropy increases with osteopo-rosis, as well documented in literature[48,49]. Ourfindings suggest that, with the development of osteoporosis, both of these mecha-nisms occur, at different length scales.
Although the decreased FA values due to the increased loss of anisotropy in cancellous bone is the major effect when moving from healthy to osteoporotic status, in this work we investigated FA/FF and MD/FF parameters to simultaneously exploit both the structural
Fig. 4. Scatter plots show FA values as a function of MD values (top graph) and FA/FF values as a function of MD/FF values (bottom graph) for each bone density group defined on the basis of their BMD (healthy: blue diamond, H; osteopenia: green trian-gle, OPE; osteoporosis: red square, OPO). In both plots cut-off values obtained from ROC curve analysis are reported in gray. Moreover, the black line in FA vs MD graph, indicates two zone in which approximately only healthy are present in one side and only pathological subjects are present in the other side. Graphs displayed here, suggest that when obtained in large populations, might allow for the definition of cut-off values of normality to be applied on a single subject basis as a screening technique for clinical purposes.
(MD and FA) and the metabolic (FF) variables for discriminating between healthy and pathological subjects. Although in this prelimi-nary report a ROC analysis with a few subjects was carried out, FA/FF yielded both the highest combined sensitivity and specificity in the identification of osteoporotic patients, while MD/FF yielded both the highest combined sensitivity and specificity in the identifica-tion of healthy individuals. Therefore, FA/FF vs MD/FF graph may be a useful MR multiparametric tool to evaluate cancellous bone status. Indeed, all data of healthy subjects displayed inFig. 4are located in a well defined region of the graph, for which MD/FF >422 μm2/s and
FA/FF >0.915. These results suggest that an FA/FF vs MD/FF graph obtained in a larger population might allow the definition of cut off values of normality to perform diagnosis on a single subject basis.
In this study, the concordance between MD/FF, FA/FF and DXA method is equal to 81.1%.
Because DXA BMD evaluation is currently the gold standard for osteoporosis diagnosis, the potential of the DTI-1H-MRS protocol for
the evaluation of the osteoporosis in the femoral neck has been eval-uated in relation to DXA results obtained in the same skeletal site. However, as underlined in the introduction of this paper, DXA is char-acterized by a low predictive value on patients' risk of reporting bone fracture for different reasons[4,6,31,32]. Our data suggest that MD/FF together with FA/FF parameters may have potential as surrogate markers for the microarchitectural deterioration of cancellous bone. However, to assess the actual potential of the DTI-1H-MRS protocol in discriminating healthy subjects from those with osteoporosis, it will be necessary to evaluate the relative effectiveness of FA/FF vs MD/FF and T-score to discriminate between subjects with and those without vertebral fractures.
In conclusion, diffusion analyses with MD and FA parameters together with FF quantification, make possible to obtain intravoxel information and novel details on the microstructure of cancellous tissue and the bone metabolism. We have reported here thefirst DTI investigation of femoral cancellous bone performed in three different BMD groups of postmenopausal women. Although our results are still preliminary, and based on a small number (N = 37) of subjects, they suggest the ability of MD/FF and FA/FF to discriminate between healthy and osteoporotic subjects. In particular they indicate that DTI assess-ment in the femoral neck, in combination with1H-MRS investigations
may be useful in the study of physiological changes associated with osteoporosis. However, further studies, with a larger population, are required to validate our preliminaryfindings.
References
[1] Baur-Melnyk A, Boehm H. Osteoporosis. In: Reiser MF, van Kaick G, Fink C, Schoenberg SO, editors. Screening and preventive diagnosis with radiological imaging. Germany: Springer Berlin Heidelberg; 2008. p. 249–60.
[2] Genant HK, Jiang Y. Advanced imaging assessment of bone quality. Ann N Y Acad Sci 2006;1068:410–28.
[3] Assessment of fracture risk and its application to screening for postmenopausal osteoporosis: report of a WHO study group. World Health Organ Tech Rep Ser 1994;843:1–129.
[4] Kanis JA. Diagnosis of osteoporosis and assessment of fracture risk. Lancet 2002;359:1929–36.
[5] Cortet B, Marchandise X. Bone microarchitecture and mechanical resistance. Joint Bone Spine 2001;68:297–305.
[6] Wehrli FW, Hilaire L, Fernández-Seara M, Gomberg BR, Song HK, Zemel B, et al. Quantitative magnetic resonance imaging in the calcaneus and femur of women with varying degrees of osteopenia and vertebral deformity status. J Bone Miner Res 2002;17:2265–73.
[7] Griffith JF, Genant HK. Bone mass and architecture determination: state of the art. Best Pract Res Clin Endocrinol Metab 2008;22:737–64.
[8] Wehrli FW, Ford JC, Attie M, Kressel HY, Kaplan FS. Trabecular structure: prelim-inary application of MR interferometry. Radiology 1991;179:615–21.
[9] Wehrli FW, Hopkins JA, Hwang SN, Song HK, Snyder PJ, Haddad JG. Cross-sectional study of osteopenia with quantitative MR imaging and bone densitometry. Radiology 2000;217:527–38.
[10] Link TM, Majumdar S, Augat P, Lin JC, Newitt D, Lane NE, et al. Proximal femur: assess-ment for osteoporosis with T2* decay characteristics at MR imaging. Radiology 1998;209:531–6.
[11] Saha PK, Gomberg BR, Wehrli FW. Three-dimensional digital topological charac-terization of cancellous bone architecture. Int J Imaging Syst Technol 2000;11: 81–90.
[12] Krug R, Banerjee S, Han ET, Newitt DC, Link TM, Majumdar S. Feasibility of in vivo structural analysis of high-resolution magnetic resonance images of the proximal femur. Osteoporos Int 2005;16:1307–14.
[13] Schellinger D, Lin CS, Hatipoglu HG, Fertikh D. Potential value of vertebral proton MR spectroscopy in determining bone weakness. Am J Neuroradiol 2001;22: 1620–7.
[14] Schellinger D, Lin CS, Lim J, Hatipoglu HG, Pezzullo AJ. Singer bone marrow fat and bone mineral density on proton MR spectroscopy and dual-energy X-ray absorptiometry: their ratio as a new indicator of bone weakening. Am J Roentgenol 2004;183:1761–5.
[15] Yeung DK, Griffith JF, Antonio GE, Lee FK, Woo J, Leung PC. Osteoporosis is associ-ated with increased marrow fat content and decreased marrow fat unsaturation: a proton MR spectroscopic study. J Magn Reson Imaging 2005;22:279–85. [16] Griffith JF, Yeung DK, Antonio GE, Lee FK, Hong AW, Wong SY, et al. Vertebral
bone mineral density, marrow perfusion, and fat content in healthy men and men with osteoporosis: dynamic contrast-enhanced MR imaging and MR spec-troscopy. Radiology 2005;236:945–51.
[17] Griffith JF, Yeung DK, Antonio GE, Wong SYS, Lau EM, Leung PC. Vertebral marrow fat content and diffusion and perfusion indexes in women with varying bone density: MR evaluation. Radiology 2006;241:831–8.
[18] Rosen CJ, Bouxsein ML. Mechanism of disease: is osteoporosis the obesity of bone? Nat Clin Pract Rheumatol 2006;2:35–43.
[19] Liney GP, Bernard CP, Manton DJ, Turnbull LW, Langton CM. Age, gender and skel-etal variation in bone marrow composition: a preliminary study at 3.0 Tesla. J Magn Reson Imaging 2008;26:787–93.
[20] Wren TAL, Chung SA, Dorey FJ, Bluml S, Adams GB, Gilsanz V. Bone marrow fat is inversely related to cortical bone in young and old subjects. J Clin Endocrinol Metab 2011;96:782–6.
[21] Griffith JF, Yeung DK, Tsang PH, Choi KC, Kwok TC, Ahuja AT, et al. Compromised bone marrow perfusion in osteoporosis. J Bone Miner Res 2008;23:1068–75. [22] Yeung DK, Wong SY, Griffith JF, Lau EM. Bone marrow diffusion in osteoporosis:
evaluation with quantitative MR diffusion imaging. J Magn Reson Imaging 2004;19: 222–8.
[23] Hatipoglu HG, Selvi A, Ciliz D, Yuksel E. Quantitative and diffusion MR imaging as a new method to assess osteoporosis. Am J Neuroradiol 2007;28:1934–7. [24] Ueda Y, Miyati T, Ohno N, Motono Y, Hara M, Shibamoto Y, et al. Apparent
diffu-sion coefficient and fractional anisotropy in the vertebral bone marrow. J Magn Reson Imaging 2010;31:632–5.
[25] Basser PJ, Pierpaoli C. Microstructural and physiological features of tissues eluci-dated by quantitative diffusion tensor MRI. J Magn Reson B 1996;111:209–19. [26] Capuani S, Rossi C, Alesiani M, Maraviglia B. Diffusion tensor imaging to study
anisotropy in a particular porous system: the trabecular bone network. Solid State Nucl Magn Reson 2005;28:266–72.
[27] Pierpaoli C, Jezzard P, Basser PJ, Barnett A. Diffusion tensor MR imaging of the human brain. Radiology 1996;201:637–48.
[28] Chen JJ, Liu W, Zhang HY, Lacy L, Yang XX, Song SK, et al. Regional ventricular wall thickening reflects changes in cardiac fiber and sheet structure during contraction: quantification with diffusion tensor MRI. Am J Physiol Heart Circ Physiol 2005;289: 1898–907.
[29] Raya JG, Horng A, Dietrich O, Krasnokutsky S, Beltran LS, MD, et al. Articular cartilage: in vivo diffusion-tensor imaging. Radiology 2012;262:550–9. [30] De Santis S, Rebuzzi M, Di Pietro G, Fasano F, Maraviglia B, Capuani S. In vitro and
in vivo MR evaluation of internal gradient to assess trabecular bone density. Phys Med Biol 2010;55:5767–85.
[31] Kuiper JW, van Kuijk C, Grashuis JL, Ederveen AG, Schutte HE. Accuracy and the influence of marrow fat on quantitative CT and dual-energy X-ray absorptiometry measurements of the femoral neck in vitro. Osteoporos Int 1996;6:25–30. [32] Blake GM, Griffith JF, Yeung DKW, Leung PC, Fogelman I. Effect of increasing
vertebral marrow fat content on BMD measurement, T-score status and fracture risk prediction by DXA. Bone 2009;44:495–501.
[33] Sigmund EE, Cho H, Song YQ. High-resolution MRI of internalfield diffusion-weighted in trabecular bone. NMR Biomed 2009;22:436–48.
[34] Capuani S, Hagberg G, Fasano F, Indovina I, Castriota-Scanderbeg A, Maraviglia B. In vivo multiple spin echoes imaging of trabecular bone on a clinical 1.5 T MR scanner. Magn Reson Imaging 2002;20:623–9.
[35] Robson MD, Anderson AW, Gore JC. Diffusion-weighted multiple-shot echo planar imaging of humans without navigation. Magn Reson Med 1997;38:82–8. [36] De Santis S, Gabrielli A, Palombo M, Maraviglia B, Capuani S. Non-Gaussian
diffu-sion imaging: a brief practical review. Magn Reson Imaging 2011;29:1410–6. [37] Jones DK, Basser PJ.“Squashing Peanuts and Smashing Pumpkins”: how noise
distorts diffusion-weighted MR data. Magn Reson Med 2004;52:979–93. [38] Bastim ME, Armitage PA, Marshall I. A theoretical study of the effect of experimental
noise on the measurement of anisotropy in diffusion imaging. Magn Reson Imaging 1998;16:773–85.
[39] Landman BA, Farrell JA, Huang H, Prince JL, Mori S. Diffusion Tensor Imaging at low SNR: non monotonic behaviors of tensor contrasts. Magn Reson Imaging 2008;26:790–800.
[40] Ren J, Dimitrov I, Sherry AD, Malloy CR. Composition of adipose tissue and mar-row fat in humans by 1H NMR at 7 Tesla. J Lipid Res 2008;49:2055–62. [41] Fawcett T. An introduction to ROC analysis. Pattern Recogn Lett 2006;27:861–74. [42] Andreoli A, Bazzocchi A, Celi M, Lauro D, Sorge R, Tarantino U, et al. Relationship bet
ween body composition, body mass index and bone mineral density in a large popu-lation of normal, osteopenic and osteoporotic women. Radiol Med 2011;116:1115–23.
[43] Basser PJ. Inferring microstructural features and the physiological state of tissues from diffusion-weighted images. NMR Biomed 1995;8:333–44.
[44] Price WS. NMR studies of translational motion: principles and applications. Cambridge University Press; 2009.
[45] Thoeny HC, De Keyzer F. Extracranial applications of diffusion-weighted magnetic resonance imaging. Eur Radiol 2007;17:1385–93.
[46] Kwee TC, Takahara T, Ochiai R, Nievelstein RAJ, Luijten PR. Whole-body diffusion-weighted magnetic resonance imaging. Eur J Radiol 2009;70:409–17.
[47] Le-Bihan D, Breton E, Lallemand D, Aubin ML, Vignaud J, Laval-Jeantet M. Separation of diffusion and perfusion in intravoxel incoherent motion MR imaging. Radiology 1988;168:497–505.
[48] Brunet-Imbault B, Lemineur G, Chappard C, Harba R, Benhamou CL. A new anisotropy index on trabecular bone radiographic images using the fast Fourier transform. BMC Med Imaging 2005;5:4.
[49] Sugita H, Oka M, Toguchida J, Nakamura T, Ueo T, Hayami T. Anisotropy of osteo-porotic cancellous bone. Bone 1999;24:513–6.