doi: 10.3389/fmars.2019.00772
Edited by: Stephanie C. J. Palmer, Université de Nantes, France Reviewed by: Lennon Thomas, University of California, Santa Barbara, United States Seth Theuerkauf, The Nature Conservancy, United States *Correspondence: Erika M. D. Porporato [email protected]; [email protected] Specialty section: This article was submitted to Ocean Observation, a section of the journal Frontiers in Marine Science Received: 26 July 2019 Accepted: 28 November 2019 Published: 09 January 2020 Citation: Porporato EMD, Pastres R and Brigolin D (2020) Site Suitability for Finfish Marine Aquaculture in the Central Mediterranean Sea. Front. Mar. Sci. 6:772. doi: 10.3389/fmars.2019.00772
Site Suitability for Finfish Marine
Aquaculture in the Central
Mediterranean Sea
Erika M. D. Porporato1* , Roberto Pastres1,2and Daniele Brigolin1,2,3
1Dipartimento di Scienze Ambientali, Informatica e Statistica, Università Ca’ Foscari Venezia, Mestre, Italy,2Bluefarm S.r.l., Marghera, Italy,3Università Iuav di Venezia, Venice, Italy
Farm site selection plays a critical role in determining the productivity, environmental impact, and interactions of aquaculture activities with ecosystem services. Satellite Remote Sensing (SRS) provide spatially extensive datasets at high temporal and spatial resolution, which can be useful for aquaculture site selection. In this paper we mapped a finfish aquaculture Suitability Index (SI) applying the Spatial Multi-criteria Evaluation (SMCE) methodology. The robustness of the outcome of the SMCE was investigated using Uncertainty Analysis (UA), and in parallel we evaluate a set of alternative scenarios, aimed at minimizing the subjectivity associated with the decision process. The index is based on the outputs of eco-physiological models, which were forced using time series of sea surface temperature data, and on data concerning Significant Wave Height (SWH), distance to harbor, current sea uses, and cumulative impacts. The methodology was applied to map the suitability for farming of European seabass (Dicentrarchus labrax) and gilthead seabream (Sparus aurata) within the Italian Economic Exclusive Zone (EEZ), under three scenarios: Blue Growth, Economic and Environment. Tyrrhenian and Ionian coastal areas were found to be more suitable, compared to the Northern Adriatic and southern Sicilian ones. In the latter, and in the western Sardinia, the index is also affected by higher uncertainty. The application presented suggests that SRS data could play a significant role in designing the Allocated Zones for Aquaculture, assisting policy makers and regulators in including aquaculture within maritime spatial planning.
Keywords: aquaculture zoning, offshore aquaculture, spatial multi-criteria evaluation, maritime spatial planning, deterministic models, sea surface temperature, significant wave height, remote sensing
INTRODUCTION
Human population growth and changes in eating habits are leading to a global increase in fish protein demand (Delgado et al., 2003;World Bank, 2013;FAO, 2018), generating an increased interest in sustainable aquaculture and fisheries to guarantee food security (e.g.,Béné et al., 2015; Longo et al., 2019). The potential for the development of marine fish culture is high (Gentry et al., 2017) and could play an important role in reducing the fishing pressure on wild fish stocks (see for exampleLittle et al., 2016), the majority of which are fully exploited or overexploited (Branch et al., 2011;Costello et al., 2016;FAO, 2018). The presence of an aquaculture farm can alter health and productivity of the surrounding marine ecosystem in diverse and complex ways (Black, 2001; McKindsey et al., 2006). The effects of farms on the environments include eutrophication, chemicals
and medicines release, modification of the benthic community (Ahmed and Thompson, 2019). Moreover, preserving water quality assures provisions of high-quality aquaculture products (Gentry et al., 2017; Clavelle et al., 2019). Therefore, the site selection process should take into account a set of criteria in order to avoid negative effects on the local environment. The identification of Allocated Zones for Aquaculture (AZAs –FAO, 2012), following the principles of the ecosystem approach (Soto et al., 2008), can boost the integration of this industry with other existing marine uses, allowing a better and profitable coordination among decision makers involved in licensing and monitoring processes (FAO and World Bank, 2015).
Aquaculture is strongly supported by the policies and initiatives of the European Union, i.e., the EU Blue Growth strategy (European Commission [EC], 2012) and the strategic guidelines for the sustainable development of EU aquaculture (European Commission [EC], 2013). Offshore aquaculture (i.e., aquaculture located in open water;Gentry et al., 2017), instead of coastal aquaculture, may help mitigating and avoiding some of the well-known local environmental impact of cage culture, due to the higher carrying and assimilative capacity of open water sites (Tacon and Metian, 2016;Gentry et al., 2017;Troell et al., 2017). However, to date, little is known about the spatial extent and potential expansion of this activity (Froehlich et al., 2017; Gentry et al., 2017). Scientists and policymakers have recommended Maritime Spatial Planning (MSP –EC Directive, 2014/89/EU) as an approach to harmonize multiple uses of the marine environment. In this context, current marine uses should be integrated together with the human impacts (da Luz Fernandes et al., 2017), to develop sustainable spatial management plans (Stelzenmüller et al., 2008; Halpern et al., 2009, 2015; Micheli et al., 2013; Kelly et al., 2014). The implementation of the MSP Directive can assume a critical role in the effective management of marine resources (Margules and Pressey, 2000; Pressey et al., 2007; Ban et al., 2010; da Luz Fernandes et al., 2017). In the MSP context, the marine space rationalization requires a multisectoral approach and the AZAs evaluation represent only one component.
At the operational level, the implementation of the site selection procedure can make use of valuable methodologies, such as the Spatial Multi-Criteria Evaluation (SMCE), being able to support the stakeholders in complex decisions procedure, through the combination of different criteria (Radiarta et al., 2008). In this framework, the increasing availability of Earth Observation data created opportunities for aquaculture suitability evaluation, farming management, and ecosystem studies (Saitoh et al., 2011;Gernez et al., 2014, 2017). Beginning in the 1980s, Satellite Remote Sensing (SRS) technologies represented a very effective means for providing data for aquaculture site selection at high temporal and spatial resolution (Kapetsky and Aguilar-Manjarrez, 2007). More recently, starting from 2017, the Copernicus Marine Environment Monitoring Service (CMEMS) EU initiative made available data from 5 new satellites (Sentinel-3, Jason-3, Saral Altika, Cryosat-2, and Jason-2N). The above-mentioned SRS data can be used as an input for dynamic models, simulating growth and physiology of farmed organisms, in order to
determine the suitability for aquaculture activities through growth performance indicators, such as the organisms weight at harvest (Thomas et al., 2011), or the condition index (e.g., Filgueira et al., 2013). Together with consolidated environmental variables (i.e., sea surface temperature and Chlorophyll-a concentration data), Significant Wave Height (SWH) data are now accessible. These latter data can be useful for evaluating which areas have higher probability of being affected by storms.
The present study focuses on the estimation of a Suitability Index (SI) for new marine finfish aquaculture offshore activities, using SRS data and the SMCE methodology. The analysis was performed under three different scenarios of growth for the aquaculture industry. The robustness of the outcome of the SMCE was assessed based on an Uncertainty Analysis (UA), which was carried out by treating the weights in the SMCE as stochastic variables.
Spatial multi-criteria evaluation was applied for mapping suitability indices for seabass and seabream over the whole Italian Economic Exclusive Zone (EEZ). The methodology, previously applied to shellfish farming (Brigolin et al., 2017), was tested for identifying AZA for seabass/seabream farming. In particular, specific objectives were: (i) evaluating the suitability for finfish aquaculture in areas subjected to multiple human impacts; (ii) estimate the uncertainty in the suitability indices. The following methodological section will present: (1) the study area in which the application was performed and the SRS data used; (2) details for SMCE application, including scenarios construction and UA; (3) the definition of criteria and constraints used in the analysis.
MATERIALS AND METHODS
Study Area and Data Description
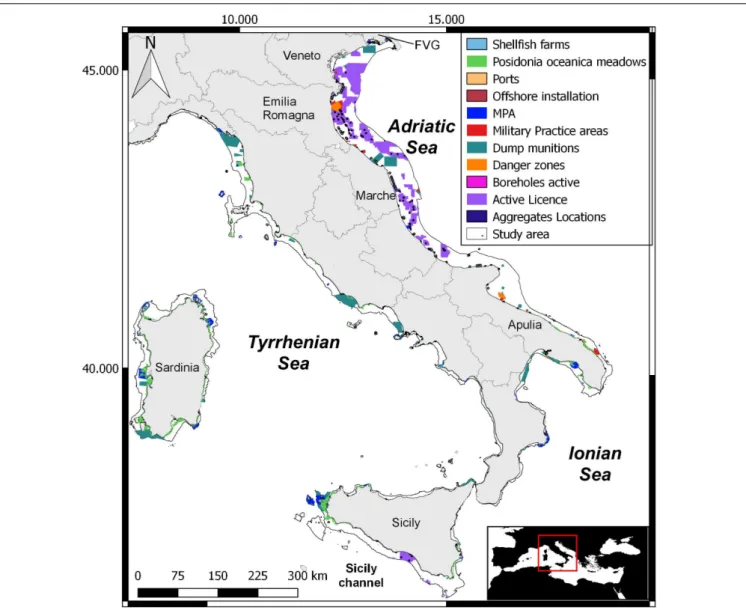
The SMCE methodology was applied to the Italian EEZ, which covers different sub-basins of the Mediterranean Sea, namely Adriatic, Ionian and Tyrrhenian Seas (see Figure 1). In accordance with the definition of offshore aquaculture given byGentry et al. (2017), areas deeper than 100 m and farther than 25 nm from the coast were excluded “a priori” from the analysis (Figure 1).
The two farmed species considered were European seabass (herein seabass) and gilthead seabream (herein seabream). These are among the most important species for the EU marine aquaculture, along with salmon, mussels and oysters, and in 2015 they together accounted, respectively, for 21% and 12% of the total production, in terms of value and volume (European Commission, 2018). Italy is the third European producer of these species, after Greece and Spain (8% and 7%, respectively; EUMOFA database1; last access 07/01/2019). In 2015–2016 Italy produced 6800 metric tonnes of seabass and 7400 tonnes of seabream: these productions are far from satisfying the internal demand, as the import amounted to 26500 tonnes of seabass and 26000 of seabream (EUMOFA, 2017, 2019).
FIGURE 1 | Study area within the Italian EEZ and maps of anthropogenic and natural constraints: commercial harbor, shellfish farm, Posidonia oceanica meadows, Marine Protected Area (MPA), dredging, military practice area, danger zones, hydrocarbon extraction (active licenses), and dump munitions.
SRS data were obtained from the CMEMS data portal2, selecting the Level 4 data (i.e., model output resulting from the statistical analysis of multiple measurements), cloud free and gridded continuously over time and space, from January 2016 until December 2017. Time series of SST daily data at 1 km2 spatial resolution were selected. These data are based
on the night-time images recorded by the infrared sensors of different satellites and, subsequently interpolated by means of the algorithm described by Buongiorno Nardelli et al. (2013). Sea surface SWH data are produced by the Hellenic Center for Marine Research (HCMR), also available through the CMEMS data portal. This dataset provides hourly data at a spatial resolution of ca. 4 km2, and is based on satellite altimetry data, including wave products derived from Jason-3 and Sentinel-3A altimeters, assimilated within the CMEMS numerical 2http://marine.copernicus.eu/
real-time Mediterranean Waves Model (Med-waves), a coupled hydrodynamic-wave model implemented in the Mediterranean Sea, and based on the WAM Cycle 4.5.4 wave model.
SMCE, Scenarios Considered and
Uncertainty Analysis
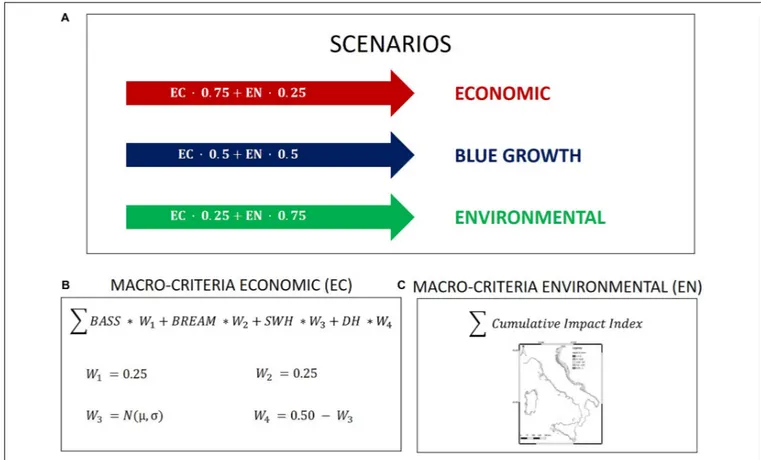
The finfish aquaculture suitability was assessed by applying the SMCE methodology (Malczewski, 2006), which is based on the analytic hierarchical process (Saaty, 1980). The present study considered 2 macro-criteria: Economic (EC) and Environmental (EN). As presented in Figure 2, aquaculture was assumed to develop under 3 scenarios, reflecting different social perceptions of this activity. These were defined by initially assigning the same weight to EC and EN (Blue Growth, EC 0.5/EN 0.5), and therefore decreasing by 50% each macro-criterion (Economic, EC 0.75/EN 0.25; Environmental, EC 0.25/EN 0.75). EC macro-criterion
FIGURE 2 | Framework adopted for the scenario analyses. (A) Scenarios, weights assigned to the economic (W1) and environmental (W2) macro-criteria combined
to obtain the Economic, Blue Growth and Environmental scenarios. (B) Macro-criterion economic, bass, bream, Significant Wave Height (SWH), Distance to Harbors (DH), W1, W2, W3, and W4the weights assigned to each ILC. (C) Macro-criterion environmental, map of cumulative impact index.
included the following Intermediate Level Criteria [ILC –sensu Radiarta et al. (2008)]: (i) number of days required to reach the market size for seabass (BASS), (ii) number of days required to reach the market size for seabream (BREAM), (iii) distance of the farm facilities from harbors (DH), and (iv) SWH. EN was based on a single criterion, the multiple impact index estimated by Micheli et al. (2013). The raster used for site suitability, the data used for the analysis, the spatial resolution and data sources were reported in Supplementary Material.
In order to perform the SMCE analysis, criteria were normalized, weighted and combined linearly, thus obtaining a SI ranging from 0 to 1, where values close to 1 indicate the highest suitability. Each criterion was normalized by linearly re-scaling each value in the range 0–1, by subtracting the minimum value and dividing by the range of the raw data (Eastman, 1999). Finally, in order to rank the areas, SI was aggregated in 5 suitability classes: 0.0 – 0.2, not suitable; 0.2 – 0.4, low suitability; 0.4 – 0.6, medium suitability; 0.6 – 0.8, high suitability; 0.8 – 1.0, very high suitability. This partitioning was performed by choosing the same number of classes, namely 5, considered by current European directives (see e.g., WFD, European Community, 2000), and equally spacing SI among these.
The robustness of the outcome of the SMCE was therefore evaluated by means of an UA, which allows one to quantify the output variability with respect to a set of input factors,
e.g., driving function, model parameters. The results of UA are very relevant in decision making, as they provide information about the confidence in model output (Gómez-Delgado and Tarantola, 2006): in this paper, we used UA for investigating how the weighting of criteria could affect the SI. This point could be very relevant in the implementation of the MSP Directive, which requires a participatory process, involving different stakeholders: weights could, therefore, be selected on the basis of the indications provided by expert panels. To this regard, it would be very relevant to understand in advance how the ranking provided by the index could change, as a consequence of different weighting. In order to demonstrate the use of this methodology, we focused on the EC macro-criterion. Two of the ILC weights, i.e., seabass and seabream days to harvest, were fixed in this analysis, respectively, w1 = 0.25 and w2 = 0.25, assuming that there
is no “a priori” reason for preferring the farming of one species. In order to perform the UA, the weights w3 and
w4 were treated as stochastic variables, normally distributed
with mean µ = 0.25 and standard deviation σ = 0.05. Their joint probability density function (pdf) was randomly sampled by extracting 100 values of w3 and calculating w4 from the
following Equation,
This procedure generated 100 independent results for the SI, from which the median and the interquartile range (i.e., distance between the 25thand 75thpercentile) were calculated. Within the Blue Growth scenario we also identified those areas in which SI resulted to be stable within 0.8 and 1.0 in all the 100 results. These areas were called “high-suitability stable areas.”
Definition of Criteria and Constraints
The spatial resolution of the SI map, 1 km2, was determined by the resolution of SST data, which represent a key input for the eco-physiological models of the two farmed species. The latter were used for estimating the number of days required to reach the market size of 400 g both for seabream and seabass3using the R package RAC4(Baldan et al., 2018). Fish growth was simulated for each grid point, assuming that fish are fedad libitum. Feed composition, in terms of proteins, lipids, and carbohydrates, was set on the basis of values which were considered to be representative of currently used commercial formulations for the two species5,6(last access 15/04/2019). The simulations were run for a period of 18 months, with a juvenile stocking size of 6 g, and a rearing cycle starting in July 2016, and ending in December 2017. Model formulations and parameters, both for seabass and seabream, are reported in previously published papers (Brigolin et al., 2010, 2014;Baldan et al., 2018), and in the demo dataset provided within the RAC package. Only one parameter was modified with respect to these works, namely the seabream fasting catabolism at 0◦
C, for which the value of k0 = 0.0012 day−1 was used, as suggested by Libralato and
Solidoro (2008). The distance to harbor criterion was estimated by measuring the distance, in km, from each center of the grid to the nearest harbor, through the nearest neighbor analysis in QGIS (version Las Palmas, 2.18.24). The SWH criterion, providing a measure of the roughness of the sea at each specific site, selected to evaluate which areas have higher probability of being affected by storms, was estimated on the basis of the 90th
percentile of the sea surface SWH, estimated for each center grid, by interpolating the data downloaded from the CMEMS website though a nearest neighbor interpolation algorithm. It is important to notice that downscaling satellite data implies several issues, depending on the algorithms applied, which influence the accuracy, outputs resolution and robustness (see for exampleRamírez Villegas and Jarvis, 2010). We decided to use the nearest neighbor interpolation algorithm based on the consideration that this simple technique, taking the value of the nearest observed point does not change the input raster values (Hengl and Reuter, 2008). The SWH data were downscaled to the same spatial resolution of SST data allowing us to run the SMCE analysis at 1 km2.
The estimation of EN macro-criterion was based on the results presented in Micheli et al. (2013), who produced a 3http://www.fao.org/fishery/culturedspecies/search/en 4https://cran.r-project.org/package=RAC 5 http://www.fao.org/fishery/affris/species-profiles/gilthead-seabream/gilthead-seabream-home/en/ 6 http://www.fao.org/fishery/affris/species-profiles/european-seabass/european-seabass-home/en/
cumulative human impacts index for the Mediterranean coasts, following the approach described by Halpern et al. (2008). The impacts were calculated considering multiple drivers (e.g., temperature, acidification, nutrient input, and risk of hypoxia) and ecosystems, which values were combined and weighted. The sum of these weighted combinations represented the relative cumulative impacts of human activities on ecosystems (Halpern et al., 2008;Micheli et al., 2013). Data were extracted from the NCEAS website7(last access 15/04/2019).
Spatial constraints imposed by existing anthropogenic activities considered to be in conflict with the presence of aquaculture were also considered. Data on uses such as hydrocarbon extraction, dump munition areas, danger zones, and military practice area, were downloaded from EMODnet8 and Adriplan portals9. Moreover, we considered the Posidonia oceanica meadows distribution, extracted for the study area from the Mediterranean Sensitive Habitats (MediSeH) project (Giannoulaki et al., 2013; Telesca et al., 2015), and the Marine Protected Areas, which were downloaded from the World Database on Protected Areas10. Under a precautionary approach, around marine protected areas and seagrass meadows a security distance buffer of 500 meters was considered (seeHolmer et al., 2008).
As a final step, all the constraints were merged, in order to identify unavailable space for aquaculture, and superimposed to the suitability map for finfish aquaculture, by using a Boolean classification scheme (suitable areas 1, unsuitable areas 0) (Falconer et al., 2013). Analyses were performed using free open software R 3.5.1, R packages RAC – R package for AquaCulture, raster, ncdf4 and maptools (R Core Team, 2018), and QGIS 2.18.24 Las Palmas (Quantum GIS Development Team, 2018).
RESULTS
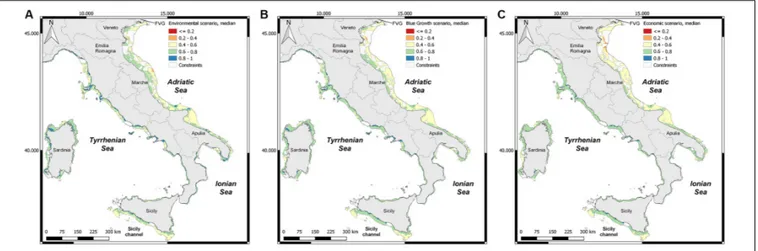
All the considered constraints, together with Marine Protected Areas and seagrass meadows are mapped in Figure 1. The Central and North Adriatic Sea is the area with most anthropogenic activities, while in the southern part of the Tyrrhenian Sea, along the Sicilian and Calabrian coasts these activities are almost absent. Figures 3A–C shows the median values of the SI with the constraints superimposed for the three considered scenarios: Environmental (EC 0.25/EN 0.75), Blue Growth (EC 0.5/EN 0.5), and Economic (EC 0.75/EN 0.25). The “constraints-free” maps are reported in Supplementary Figures S2A–C. Figures 4A–C shows the uncertainty in terms of interquartile range for the Environmental, Blue Growth and Economic scenarios. Low SI values with similar uncertainties for the three considered scenarios are estimated in the following two areas: (1) offshore area of the Northern Adriatic Sea, along the coasts of Friuli Venezia Giulia, Veneto, Emilia-Romagna and Apulia regions; (2) offshore area of the Southern part of Sicily. Globally, the Italian 7https://www.nceas.ucsb.edu/globalmarine
8http://www.emodnet-humanactivities.eu/about.php#humanactivities 9http://data.adriplan.eu/
FIGURE 3 | Spatial multi-criteria evaluation median results for the 3 scenarios considering the current sea uses and protected areas. (A) Environmental. (B) Blue Growth. (C) Economic. Scenarios were defined by initially assigning the same weight to EC and EN (Blue growth, EC 0.5/EN 0.5), and therefore decreasing by 50% each macro-criterion (Economic, EC 0.75/EN 0.25; Environmental, EC 0.25/EN 0.75).
FIGURE 4 | Spatial multi-criteria evaluation uncertainty (interquartile range/median) for the 3 scenarios considering the current sea uses and protected areas: (A) Environmental. (B) Blue Growth. (C) Economic.
EEZ, both inshore and offshore, results to be suitable for seabass and seabream farming, with the notable exception of the Adriatic Sea offshore areas. Indeed, the lowest SI values (0.2 – 0.4) are estimated for this area, in front of the Po river outlet. Most of the investigated marine space presents SI values comprised between 0.6 and 0.8, while the highest SI values (0.8 – 1.0) are recorded in the Tyrrhenian and Ionian area. In particular, the suitable space (SI> 0.6) results around 60% of the total space for the Environmental and Blue Growth scenarios, while is ca. 54% for the Economic scenario (Supplementary Figure S3A). In details, in the Environmental scenario 59.87% of the total space (53,412 km2) presents high and very high suitability values,
followed by the Blue Growth scenario with the 58.63% of the total space (52,301 km2), and the Economic scenario with 53.73% (47,928 km2) of the total space.
The highest uncertainties were found in the Economic and Blue Growth scenarios, with very similar values, followed by the Environmental scenario (Figure 4). The UA highlighted low
values with a common uncertainty for all considered scenarios in three areas: (1) offshore area of the Northern Adriatic Sea, along the coasts of Veneto, Emilia-Romagna and Marche regions; (2) inshore and offshore Western and Northern coasts of Sardinia region; (3) inshore areas of the Southern part of Sicily. Considering the Blue Growth scenario, the uncertainty values and the current marine sea uses are represented in Figure 5, along with the high-suitability stable areas (areas in which the SI scored between 0.8 and 1.0, see section “SMCE analysis and scenarios construction”). The high-suitability stable areas are located in the Tyrrhenian and Ionian Seas, and almost in the whole area the lowest uncertainty is recorded with the exception of the Sardinian and western Sicilian coasts. In particular, in Figure 5A is possible to highlight in the Southern part, two stable areas, one with low uncertainty values and the other with high uncertainty values. Moreover, in the Sicilian area (Figure 5B), the highest uncertainty is recorded in two stable areas, where is located the Egadi Island Marine Protected Area.
FIGURE 5 | Blue Growth uncertainty considering the area with a persistent high SI and the current sea uses: (A) Sardinia. (B) East Sicily.
DISCUSSION
The first step in a process for aquaculture site selection is related with the identification of priority areas at the national level, afterward detailed plans are developed at regional level (FAO and World Bank, 2015). The Strategic Guidelines for Aquaculture delivered by the (European Commission [EC], 2013) considered spatial planning for aquaculture as a key issue and all EU Member States developed the Multi-annual aquaculture plans with the aim to increase their productions. In this context, the first objective of the Italian national strategic plan for aquaculture (PSA, 2014-2020) is to develop
the aquaculture activity in the Italian seas in order to create economy, employment and social benefits. Considering also the Blue Growth strategy perspective, the Italian national growth objective for the 2013 – 2025 is to increase of 58% in volume the current marine fish farming production (PSA, 2014-2020). The response to the EU strategic guidelines to achieve this objective includes the coordinated spatial planning (macro-objective 2 of thePSA, 2014-2020), through the implementation of the MSP Directive and coherently with the FAO-GFCM resolution of 2012 (Recommendation GFCM/36/2012/1;GFCM, 2012), with the aim to identify the priority areas for aquaculture activities. In particular, there is a need of national guidelines
for the identification of AZAs able to support regions in the adoption of MSP plans.
As highlighted by our results, the Italian EEZ is a complex system in which different users coexist, with a wide range of purposes and conflicts of interest (tourism, industry, fisheries and transport). Understanding and quantifying the spatial distribution of constraints and multiple stressors should help to improve and rationalize the spatial management of human activities, considering both the Water Framework Directive (WFD; Directive 2000/60/EC) and the Marine Strategy Framework Directive (MSFD; Directive 2008/56/EC). The identification of suitable areas for the expansion of aquaculture presents both purely technical-scientific aspects, linked to the current scientific knowledge, and problems connected to the decision-making aspects and the planning process. In recent years, there was a rise in the usage of “virtual technologies” (sensu Ferreira et al., 2012) for the sustainable development and management of aquaculture activities, also related mainly with the increasing availability of SRS data (see e.g., Radiarta et al., 2008; Brigolin et al., 2015, 2017; Gernez et al., 2017). The application presented in this study confirms the potential of SRS for MSP and, based on the generality and transferability of the applied methodology, could be both tested in other areas and extended to different species. With respect to this latter point, it is worth remarking that the present work used SST satellite data as inputs for mechanistic models simulating eco-physiology and growth of seabass and seabream, while recent studies considered directly the water temperature values in relation to the thermal tolerance of the selected species (e.g., Longdill et al., 2008; Radiarta et al., 2008;Gentry et al., 2017; Weiss et al., 2018). The advantage of using a mechanistic model is related to the possibility of obtaining the integrated assessment of the temperature effects on fish physiology and growth over time. Consistently with the results from a mechanistic model based on the dynamic energy budget theory (Sarà et al., 2018), our analysis showed that, fixing the husbandry practices, fish growth appeared strongly related to the spatio-temporal variability in SST. Indeed, a latitudinal gradient was highlighted for both species, with a better growth performance highlighted in the southern part of the Italian EEZ.
SI and Estimated Criteria
Consistently with the approach promoted by the EU Directive on Maritime Spatial Planning, the definition of weights should be the results of a participatory process involving different stakeholders. Indeed, as remarked by Radiarta et al. (2008), weighting is one of the primary challenges when a multicriteria evaluation is applied. To the knowledge of the authors, a univocal and objective procedure to determine the importance of each criterion does not exist.
According to the results obtained in this work, the areas less suitable were the Adriatic Sea and the southern part of Sicily, were a high uncertainty was also recorded. On the opposite side, the western and northern Sardinian coasts were classified as highly suitable but, in these areas, high uncertainty values were also estimated. Considering current constraints, the areas not available for seabass, and seabream farming
are located in the Northern Adriatic Sea, in the same areas where the estimated SI presents lower values. High suitability was the most represented class for all the scenarios analyzed, (Supplementary Figures S3A,B) (ca. 50% of the EEZ), followed by the medium suitability (around 40%). SI maps before and after considering constraints, highlight that available areas with very high suitability were, respectively, reduced by 2500, 1300, and 750 km2under the Environmental, Blue Growth and Economic scenarios (Supplementary Figure S3B). Few areas resulted highly suitable for seabass/seabream cage culture, in particular 2%, 5%, and 9% of the study area for the Economic, Blue Growth and Environmental scenario, respectively. Noteworthy, for this suitability class, very similar values were recorded both taking and not taking into account the current sea uses and constraints. Low suitability area, SI values comprised between 0.2 and 0.4, resulted marginally represented with values comprised between 2.5% and 0.5% of the total area, while SI values below 0.2 were never recorded.
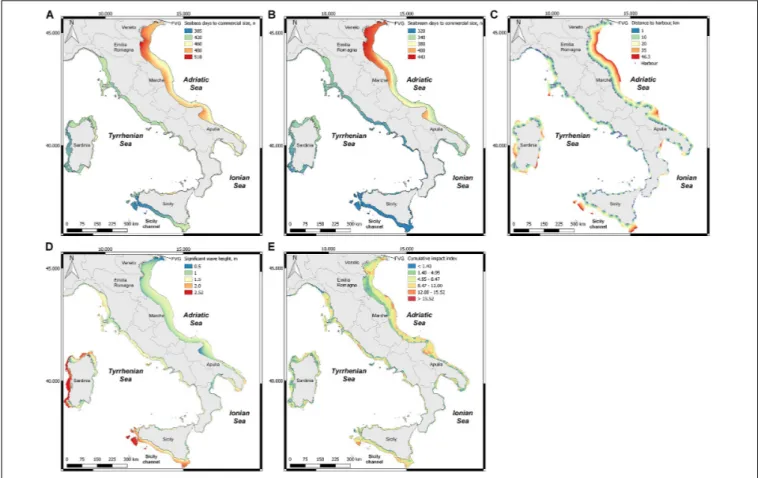
In general, the most constraining Intermediate Level Criteria (ILC), was Bream, followed by DH, Bass, SWH, and Impact (see Supplementary Figure S4). Maps of EC and EN criteria used to calculate the SI are reported in Figure 6 (raw values) and in Supplemetary Figure S1 (normalized values), and briefly presented in the following. Days required to reach the commercial size (400 g) were estimated and mapped for the entire study area (Figures 6A,B and Supplementary Figures S1A,B). The values are comprised between 320 and 443 for seabream, and 385 and 518 days for seabass. For seabream, the lowest growth values were found in the Northern Adriatic Sea, with a decreasing tendency moving offshore. The highest growth values are located in the southern part of the Sicily channel, followed by the western part of Sardinia island, and the Tyrrhenian Sea, showing fewer variable values, of ca. 330 days. The growth performance estimated for seabass are comparable to those described for seabream but, in general, a higher number of days is required to reach the commercial size. Distance to harbor (Figure 6C and Supplementary Figure S1C normalized values) results homogenously distributed in the whole study area, with the highest values in the Adriatic Sea and Sicily channel. The most exposed areas, through the SWH analysis (Figure 3D and
Supplementary Figure S1D), are located in the western and
northern Sardinia, and in the southern part of Sicily. Regarding the cumulative impact index (Figure 6E and Supplementary
Figure S1E), the highest values are present offshore, both in the Adriatic and Sicily channel areas, and in the Central and North Tyrrhenian areas.
SMCE Use for Aquaculture Planning
In the aquaculture suitability analysis presented in this work, the UA performed allows to understand the SI variability depending on the respective weights assigned to distance of the farm facilities from harbors and SWH criteria (Figure 6). Overall, the introduction of the UA marks an element of novelty of this work with respect to previous similar applications (e.g.,Radiarta et al., 2008; Brigolin et al., 2015, 2017). With respect to this, results obtained in the present application highlight that the average map could provide an incomplete view, if not integrated
FIGURE 6 | Maps of criteria considered in the analyses. (A) Days required by seabass to reach the commercial size. (B) Days required by seabream to reach the commercial size. (C) Distance to harbor. (D) SWH. (E) Cumulative impact within the study area.
with the uncertainty associated, which can provide a measure of the stability of results under criteria weights modifications. This is easily detectable in the Western and Northern Sardinian coasts under the Blue Growth scenario, where we estimated high suitability but also the highest uncertainty. To this regard, it is worth noting that high values of uncertainty are detected in the areas were the two criteria SWH and DH, for which the respective weights were treated as stochastic variables in the analysis, show the more pronounced spatial gradients. This suggests, as a general rule, to carefully identify the factors considered in the UA.
In this work we used the cumulative human impact map (Halpern et al., 2008; Micheli et al., 2013), which allowed us to take advantage of an indicator of ecosystem status to identify which areas are already heavily impacted, and in which a new anthropogenic activity could push the system beyond the resilience limits. Indeed, these impacted areas have high priority for management and conservation actions (Coll et al., 2012;Micheli et al., 2013) and it could be difficult to integrate new aquaculture activities with the impacts already present. We are aware that this approach has two main limitations related with (i) the linear combination of the impacts, that does not consider the different combinations of drivers which can also determine a non-linear response to cumulative impacts, and (ii) the variable quality of the available data (see for
example comments byHalpern et al., 2008;Micheli et al., 2013; Stock and Micheli, 2016). At the same time, the wide spatial scale and the completeness of the drivers considered, represented a great opportunity for the implementation in this study of the environmental components within the design of AZAs. In agreement with the procedure suggested by FAO (FAO and World Bank, 2015), we remark that the a priori evaluation of cumulative impacts presented here should be accompanied by a quantification of the local interaction of the planned facilities, once the location of aquaculture management areas is established. This step, which goes in the direction of characterizing the Allowable Zone of Effect (AZE), should be based on a more comprehensive set of environmental data, including time series of local currents, dissolved oxygen concentrations, and water transparency (e.g., through light extinction coefficient, Kd).
Offshore aquaculture activities are increasing in other European Seas (e.g., Buck and Langan, 2017): our findings could provide a basis for feasibility studies, aimed at evaluating the possibility of developing them also in Mediterranean areas. The co-use and development of offshore aquaculture in combination with other activities (e.g., wind farms, oil, and gas decommissioned platforms, etc.) could boost this industry helping in different aspects, including attachment points for cages, less cost in maintenance operation, and sharing of
infrastructural costs (Buck and Langan, 2017). In the meantime, future development of control-engineering farming practices (i.e., Precision Fish Farming – Føre et al., 2018) can help overcoming some of the logistic problems, potentially related to the distance from the harbors (Naylor and Burke, 2005). Finally, it is worth remarking that economic and social-acceptability aspects (see e.g.,Gentry et al., 2017;Kluger et al., 2019), may limit aquaculture production. Therefore, we advocate for the inclusion of social carrying capacity considerations (McKindsey et al., 2006; Gentry et al., 2017;Kluger et al., 2019) in the future applications of the methodology presented in this work, in order to obtain more realistic expansion scenarios.
Management Recommendations
Our results estimated a potential suitability for marine aquaculture within most of the Italian EEZ, above all in the Tyrrhenian and Ionian Seas, suggesting the potential development of this activity. Less suitable marine space was recorded in the northern Adriatic Sea, in western Sardinia, and southern Sicily, were the highest uncertainty was also recorded. The application highlights the possibility of providing an estimation of the suitability of different areas, along with an uncertainty associated, through the Spatial Multi-Criteria analysis and making use of SRS data, mechanistic models, existing impacts and uses of marine space. This could assist policy makers and regulators in promoting a development of aquaculture which follows the ecosystem approach. Indeed, spatial planning will be only the first step of this process, which will also include environmental impact assessment and monitoring programs (Sanchez-Jerez et al., 2016). We believe that the approach and the findings reported in this work can contribute to the identification of priority areas for aquaculture activities within the Italian EEZ. It is worth remarking that the identification carried out here with respect to finfish aquaculture needs, must be extended to consider also the potential for extractive aquaculture (shellfish and macroalgae). This step should take into account interactions and possibilities for Integrated Multi-Trophic Aquaculture (IMTA) development in this area. IMTA implementation is seen as a possible way to develop an ecological intensification of aquaculture activities (BLUEMED Italian White Paper Working Group, 2018). Once identified suitable areas, as in the present study, a more downscaled approach could allow to deeply examine the complex mosaic of local factors interacting with aquaculture installations. Specifically, the availability of local data, such as marine currents, and the application of depositional models, could determine a more precise and site-specific results allowing to highlight possible obstacles for seabass and seabream aquaculture development at the finest spatial scale. After the AZAs identification, carrying capacity, cost/benefit analysis and environmental quality standards should
be taken into account to define the Allowable Zone Effect and the Aquaculture Management Area (Sanchez-Jerez et al., 2016). These evaluations, being site-specific and depending on both environmental and socio-economic factors, should be considered as a further development of the analysis presented here.
The set of indicators used in this study could be expanded in different ways, however, this should be carried out by taking into account the availability of data, and the reliability of the models needed to derive the indicators. In perspective, model results could be improved by the development of new algorithms and new SRS products, such as organic fraction of the suspended matter and the detection of Harmful Algal Blooms, which will provide new opportunities in this area (Gernez et al., 2014, 2017). Future availability of SRS at highest resolution could improve the accuracy of suitability predictions, allowing to disentangle the complex mosaic of site-specific factors influencing the aquaculture activities. Finally, we remark that eco-physiological mathematical models, which within this work were forced by using SST data, could in perspective be applied for forecasting the effects of climate changes, by using as an input the downscaling simulation produced by hydrodynamic numerical models (e.g., Euro-CORDEX initiative11).
DATA AVAILABILITY STATEMENT
The spatial raster generated for this study can be found in the
Supplementary Material.
AUTHOR CONTRIBUTIONS
EP, RP, and DB conceptualized the study, wrote the manuscript, contributed to the manuscript revision, and read and approved the submitted version. EP ran the analysis.
FUNDING
This work was partially supported by PORTODIMARE project, project number 205, Priority Axis 2 Sustainable Region, funding program Interreg V B 2014–2020: Adriatic-Ionian Program – ADRION.
SUPPLEMENTARY MATERIAL
The Supplementary Material for this article can be found online at: https://www.frontiersin.org/articles/10.3389/fmars. 2019.00772/full#supplementary-material
11https://euro-cordex.net/
REFERENCES
Ahmed, N., and Thompson, S. (2019). The blue dimensions of aquaculture: a global synthesis.Sci. Total Environ. 652, 851–861. doi: 10.1016/j.scitotenv.2018. 10.163
Baldan, D., Porporato, E. M. D., Pastres, R., and Brigolin, D. (2018). An R package for simulating growth and organic wastage in aquaculture
farms in response to environmental conditions and husbandry
practices. PLoS One 13:e0195732. doi: 10.1371/journal.pone.019 5732
Ban, N. C., Alidina, H. M., and Ardron, J. A. (2010). Cumulative impact mapping: advances, relevance and limitations to marine management and conservation, using Canada’s Pacific waters as a case study.Mar. Pol. 34, 876–886. doi: 10. 1016/j.marpol.2010.01.010
Béné, C., Barange, M., Subasinghe, R., Pinstrup-Andersen, P., Merino, G., Hemre, G. I., et al. (2015). Feeding 9 billion by 2050–Putting fish back on the menu. Food Secur. 7, 261–274. doi: 10.1007/s12571-015-0427-z
Black, K. D. (2001).Environmental Impacts of Aquaculture. Sheffield: Sheffield Academic Press.
BLUEMED Italian White Paper Working Group (2018).The BLUEMED Italian White Paper: An Overview of Relevance, Obstacles and Proposals of the Key Sectors for a Blue Growth. Roma: CNR Edizioni.
Branch, T. A., Jensen, O. P., Ricard, D., Yimin, Y., and Hilborn, R. (2011). Contrasting global trends in marine fishery status obtained from catches and from stock assessments.Conserv. Biol. 25, 777–786. doi: 10.1111/j.1523-1739. 2011.01687.x
Brigolin, D., Lourguioui, H., Taji, M. A., Venier, C., Mangin, A., and Pastres, R. (2015). Space allocation for coastal aquaculture in North Africa: data constraints, industry requirements and conservation issues. Ocean Coast. Manage. 116, 89–97. doi: 10.1016/j.ocecoaman.2015.07.010
Brigolin, D., Meccia, V. L., Venier, C., Tomassetti, P., Porrello, S., and Pastres, R. (2014). Modelling biogeochemical fluxes across a mediterranean fish cage farm. Aquac. Environ. Interact. 5, 71–88. doi: 10.3354/aei00093
Brigolin, D., Pastres, R., Tomassetti, P., and Porrello, S. (2010). Modelling the biomass yield and the impact of seabream mariculture in the adriatic and tyrrhenian seas (Italy). Aquac. Int. 18, 149–163. doi: 10.1007/s10499-008-9232-4
Brigolin, D., Porporato, E. M. D., Prioli, G., and Pastres, R. (2017). Making space for shellfish farming along the adriatic coast.ICES J. Mar. Sci. 74, 1540–1551. doi: 10.1093/icesjms/fsx018
Buck, B. H., and Langan, R. (2017).Aquaculture Perspective of Multi-Use Sites in the Open Ocean: The Untapped Potential for Marine Resources in the Anthropocene. New York, NY: Springer.
Buongiorno Nardelli, B., Tronconi, C., Pisano, A., and Santoleri, R. (2013). High and Ultra-high resolution processing of satellite Sea Surface temperature data over Southern European Seas in the framework of MyOcean project.Remote Sens. Environ. 129, 1–16. doi: 10.1016/j.rse.2012.10.012
Clavelle, T., Lester, S. E., Gentry, R., and Froehlich, H. E. (2019). Interactions and management for the future of marine aquaculture and capture fisheries.Fish. Fish. 20, 368–388. doi: 10.1111/faf.12351
Coll, M., Piroddi, C., Albouy, C., Ben Rais Lasram, F., Cheung, W. W. L., Christensen, V., et al. (2012). The mediterranean Sea under siege: spatial overlap between marine biodiversity, cumulative threats and marine reserves. Glob. Ecol. Biogeogr. 21, 465–480. doi: 10.1111/j.1466-8238.2011. 00697.x
Costello, C., Ovando, D., Clavelle, T., Strauss, C. K., Hilborn, R., Melnychuk, M. C., et al. (2016). Global fishery prospects under contrasting management regimes. Proc. Natl. Acad. Sci. U.S.A. 113, 5125–5129. doi: 10.1073/pnas.1520420113 da Luz Fernandes, M., Esteves, T. C., Oliveira, E. R., and Alves, F. L. (2017). How
does the cumulative impacts approach support maritime spatial planning?Ecol. Indic. 73, 189–202. doi: 10.1016/j.ecolind.2016.09.014
Delgado, C. L., Wada, N., Rosegrant, M. W., Meijer, S., and Ahmed, M. (2003).Fish to 2020: Supply and Demand in Changing Global Markets. Penang: World Fish Center.
Eastman, J. R. (1999). Multi-criteria evaluation and GIS.Geograph. Inf. Syst. 1, 493–502.
EC Directive (2014).2014/89/EU of the European Parliament and of the Council of 23 July 2014 Establishing a Framework for Maritime Spatial Planning. EUMOFA (2017).Highlights the EU in the World EU Market Supply, Consumption,
trade, EU Landings, Aquaculture Production. Belgium: EUMOFA.
EUMOFA (2019).Seabass in the EU. Price Structure in the Supply Chain for Seabass. Belgium: EUMOFA.
European Commission (2018).Facts and Figures on the Common Fisheries Policy. Basic statistical data. Brussels: European Commission.
European Commission [EC] (2012). Communication from the Commission to the European Parliament, the Council, the European Economic and Social Committee and the Committee of the Regions. Blue Growth Opportunities for Marine and Maritime Sustainable Growth. Brussels: European Commission.
European Commission [EC] (2013).Communication from the Commission to the European Parliament, the Council, the European Economic and Social Committee and the Committee of the Regions: Strategic Guidelines for the Sustainable Development of EU Aquaculture. Brussels: European Commission. European Community (2000).Directive 2000/60/EC of the European Parliament
and of the Council of 23 October 2000 Establishing a Framework for Community Action in the Field OF Water Policy. Bruxelles: European Community. Falconer, L., Hunter, D. C., Scott, P. C., Telfer, T. C., and Ross, L. G. (2013). Using
physical environmental parameters and cage engineering design within GIS-based site suitability models for marine aquaculture.Aquac. Environ. Interact. 4, 223–237. doi: 10.3354/aei00084
FAO (2012).Report of the Thirty-Sixth Session of the General Fisheries Commission for the Mediterranean. Rome: FAO.
FAO (2018). The State of World Fisheries and Aquaculture 2018. Meeting the Sustainable Development Goals. Rome: FAO.
FAO and World Bank (2015). Aquaculture Zoning, Site Selection and Area Management Under the Ecosystem Approach to Aquaculture. Rome: World Bank.
Ferreira, J. G., Aguilar-Manjarrez, J., Bacher, C., Black, K., Dong, S. L., Grant, J., et al. (2012). “Progressing aquaculture through virtual technology and decision-support tools for novel management,” inProceedings of the Global Conference on Aquaculture 2010, Farming the Waters for People and Food eds R. P. Subasinghe, J. R. Arthur, D. M. Bartley, S. S. De Silva, M. Halwart, N. Hishamunda, C. V. Mohan, and P. Sorgeloos (Rome: FAO), 643–704.
Filgueira, R., Comeau, L. A., Landry, T., Grant, J., Guyondet, T., and Mallet, A. (2013). Bivalve condition index as an indicator of aquaculture intensity: a meta-analysis.Ecol. Indic. 25, 215–229. doi: 10.1016/j.ecolind.2012.10.001 Føre, M., Frank, K., Norton, T., Svendsen, E., Alfredsen, J. A., Dempster, T.,
et al. (2018). Precision fish farming: a new framework to improve production in aquaculture.Biosyst. Eng. 173, 176–193. doi: 10.1016/j.biosystemseng.2017. 10.014
Froehlich, H. E., Smith, A., Gentry, R. R., and Halpern, B. S. (2017). Offshore aquaculture: i know it when I see it.Front. Mar. Sci. 4:154. doi: 10.3389/fmars. 2017.00154
Gentry, R. R., Froehlich, H. E., Grimm, D., Kareiva, P., Parke, M., Rust, M., et al. (2017). Mapping the global potential for marine aquaculture.Nat. Ecol. Evol. 1:1317. doi: 10.1038/s41559-017-0257-9
Gernez, P., Barillé, L., Lerouxel, A., Mazeran, C., Lucas, A., and Doxaran, D. (2014). Remote sensing of suspended particulate matter in turbid oyster-farming ecosystems.J. Geophys. Res. Oceans 119, 7277–7294. doi: 10.1002/ 2014JC010055
Gernez, P., Doxaran, D., and Barillé, L. (2017). Shellfish aquaculture from space: potential of Sentinel2 to monitor tide-driven changes in turbidity, chlorophyll concentration and oyster physiological response at the scale of an oyster farm. Front. Mar. Sci. 4:137. doi: 10.3389/fmars.2017.00137
GFCM (2012).Resolution GFCM/36/2012/1 on Guidelines on Allocated Zones for Aquaculture (AZA). Rome: GFCM.
Giannoulaki, M., Belluscio, A., Colloca, F., Fraschetti, S., Scardi, M., Smith, C., et al. (2013).Mediterranean Sensitive Habitats (MEDISEH), Final Project Report. DG MARE Specific Contract SI2.600741. Anavyssos: Hellenic Centre for Marine Research.
Gómez-Delgado, M., and Tarantola, S. (2006). GLOBAL sensitivity analysis, GIS and multi-criteria evaluation for a sustainable planning of a hazardous waste disposal site in Spain. Int. J. Geogr. Inf. Sci. 20, 449–466. doi: 10.1080/ 13658810600607709
Halpern, B. S., Frazier, M., Potapenko, J., Casey, K. S., Koenig, K., Longo, C., et al. (2015). Spatial and temporal changes in human impacts on the world’s ocean. Nat. Commun. 6:7615. doi: 10.1038/ncomms8615
Halpern, B. S., Kappel, C., Selkoe, K., Micheli, F., Ebert, C., Kontgis, C., et al. (2009). Mapping cumulative human impacts to California current marine ecosystems. Conserv. Lett. 2, 138–148. doi: 10.1111/j.1755-263X.2009.00058.x
Halpern, B. S., Walbridge, S., Selkoe, K. A., Kappel, C. V., Micheli, F., D’Agrosa, C., et al. (2008). A global map of human impact on marine ecosystems.Science 319, 948–952. doi: 10.1126/science.1149345
Hengl, T., and Reuter, H. I. (eds) (2008).Geomorphometry: Concepts, Software, Applications. Amsterdam: Elsevier.
Holmer, M., Argyrou, M., Dalsgaard, T., Danovaro, R., Diaz-Almela, E., Duarte, C. M., et al. (2008). Effects of fish farm waste onPosidonia oceanica meadows:
synthesis and provision of monitoring and management tools.Mar. Pollut. Bull. 56:e1629. doi: 10.1016/j.marpolbul.2008.05.020
Kapetsky, J. M., and Aguilar-Manjarrez, J. (2007).Geographic Information Systems, Remote Sensing and Mapping for the Development and Management of Marine Aquaculture. Rome: Food & Agriculture Org.
Kelly, C., Gray, L., Shucksmith, R. J., and Tweddle, J. F. (2014). Investigating options on how to address cumulative impacts in marine spatial planning. Ocean Coast. Manage. 102, 139–148. doi: 10.1016/j.ocecoaman.2014.09.019 Kluger, L. C., Filgueira, R., and Byron, C. J. (2019). Using media analysis to scope
priorities in social carrying capacity assessment: a global perspective.Mar. Pol. 99, 252–261. doi: 10.1016/j.marpol.2018.10.042
Libralato, S., and Solidoro, C. (2008). A bioenergetic growth model for comparing Sparus aurata feeding experiments. Ecol. Model. 214, 325–337. doi: 10.1016/j. ecolmodel.2008.02.024
Little, D. C., Newton, R. W., and Beveridge, M. C. M. (2016). Aquaculture: a rapidly growing and significant source of sustainable food? Status, transitions and potential.Proc. Nutr. Soc. 75, 274–286. doi: 10.1017/S0029665116000665 Longdill, P. C., Healy, T. R., and Black, K. P. (2008). An integrated GIS approach for
sustainable aquaculture management area site selection.Ocean Coast. Manage. 51, 612–624. doi: 10.1016/j.ocecoaman.2008.06.010
Longo, S. B., Clark, B., York, R., and Jorgenson, A. K. (2019). Aquaculture and the displacement of fisheries captures.Conserv. Biol. 33, 832–841. doi: 10.1111/cobi. 13295
Malczewski, J. (2006). GIS-based multicriteria decision analysis: a survey of the literature.Int. J. Geogr. Inf. Sci. 20, 703–726. doi: 10.1080/13658810600661508 Margules, C. R., and Pressey, R. L. (2000). Systematic conservation planning.
Nature 405, 243–253. doi: 10.1038/35012251
McKindsey, C. W., Thetmeyer, H., Landry, T., and Silvert, W. (2006). Review of recent carrying capacity models for bivalve culture and recommendations for research and management. Aquaculture 261, 451–462. doi: 10.1016/j. aquaculture.2006.06.044
Micheli, F., Halpern, B. S., Walbridge, S., Ciriaco, S., Ferretti, F., Fraschetti, S., et al. (2013). Cumulative human impacts on mediterranean and black sea marine ecosystems: assessing current pressures and opportunities.PLoS One 8:e79889. doi: 10.1371/journal.pone.0079889
Naylor, R., and Burke, M. (2005). Aquaculture and ocean resources: raising tigers of the sea.Annu. Rev. Environ. Resour. 30, 185–218. doi: 10.1146/annurev.energy. 30.081804.121034
Pressey, R. L., Cabeza, M., Watts, M. E. J., Cowling, R. M., and Wilson, K. A. (2007). Conservation planning in a changing world.Trends Ecol. Evol. 22, 583–592. doi: 10.1016/j.tree.2007.10.001
PSA (2014-2020).Piano Strategico per l’Acquacoltura in Italia 2014-2020. Available at: https://www.politicheagricole.it/flex/cm/pages/ServeAttachment.php/L/ IT/D/b%252F1%252Ff%252FD.428bdb5bca0aa9cf42e1/P/BLOB%3AID% 3D8752/E/pdf (accessed November 18, 2019).
Quantum GIS Development Team (2018).Quantum GIS Geographic Information System. Open Source Geospatial Foundation Project. Available at: http://qgis. osgeo.org (accessed September 15, 2018).
R Core Team, (2018).R: A language and environment for Statistical Computing. R Foundation for Statistical Computing. Vienna: R Core Team.
Radiarta, I. N., Saitoh, S. I., and Miyazono, A. (2008). GIS-based multi-criteria evaluation models for identifying suitable sites for Japanese scallop (Mizuhopecten yessoensis) aquaculture in Funka Bay, southwestern Hokkaido Japan.Aquaculture 284, 127–135. doi: 10.1016/j.aquaculture.2008.07.048 Ramírez Villegas, J., and Jarvis, A. (2010).Downscaling Global Circulation Model
Outputs: The Delta Method Decision and Policy Analysis Working Paper No. 1. Available at: https://hdl.handle.net/10568/90731 (accessed November 18, 2019).
Saaty, T. L. (1980).The Analytic Hierarchy Process: Planning, Priority Setting, Resources Allocation. New York, NY: RWS Publications.
Saitoh, S.-I., Mugo, R., Radiarta, I. N., Asaga, S., Takahashi, F., Hirawake, T., et al. (2011). Some operational uses of satellite remote sensing and marine GIS for sustainable fisheries and aquaculture.ICES J. Mar. Sci. 68, 687–695. doi: 10.1093/icesjms/fsq190
Sanchez-Jerez, P., Karakassis, I., Massa, F., Fezzardi, D., Aguilar-Manjarrez, J., Soto, D., et al. (2016). Aquaculture’s struggle for space: the need for coastal spatial planning and the potential benefits of Allocated Zones for Aquaculture (AZAs) to avoid conflict and promote sustainability.Aquac. Environ. Interact. 8, 41–54. doi: 10.3354/aei00161
Sarà, G., Gouhier, T. C., Brigolin, D., Porporato, E. M. D., Mangano, M. C., Mirto, S., et al. (2018). Predicting shifting sustainability tradeoffs in aquaculture under climate change.Glob. Change Biol. 24, 3654–3665. doi: 10.1111/gcb. 14296
Soto, D., Aguilar-Manjarrez, J., and Hishamunda, N. (eds) (2008).Building an Ecosystem Approach to Aquaculture: FAO/Universitat de Les Illes Balears Expert Workshop, 7-11 May, 2007, Palma de Mallorca, Spain. Rome: FAO Fisheries and Aquaculture.
Stelzenmüller, V., Rogers, S. I., and Mills, C. M. (2008). Spatio-temporal patterns of fishing pressure on UK marine landscapes, and their implications for spatial planning and management.ICES J. Mar. Sci. 65, 1081–1091. doi: 10.1093/ icesjms/fsn073
Stock, A., and Micheli, F. (2016). Effects of model assumptions and data quality on spatial cumulative human impact assessments.Glob. Ecol. Biogeogr. 25, 1321–1332. doi: 10.1111/geb.12493
Tacon, A. G. J., and Metian, M. (2016). Fish matters: importance of aquatic foods in human nutrition and global food supply.Rev. Fish. Sci. 21, 22–38. doi: 10.1080/10641262.2012.753405
Telesca, L., Belluscio, A., Criscoli, A., Ardizzone, G., Apostolaki, E. T., Fraschetti, S., et al. (2015). Seagrass meadows (Posidonia oceanica) distribution and trajectories of change.Sci. Rep. 5:12505. doi: 10.1038/srep 12505
Thomas, Y., Mazurié, J., Alunno-Bruscia, M., Bacher, C., Bouget, J. F., Gohin, F., et al. (2011). Modelling spatio-temporal variability ofMytilus edulis (L.) growth by forcing a dynamic energy budget model with satellite-derived environmental data. J. Sea Res. 66, 308–317. doi: 10.1016/j.seares.2011. 04.015
Troell, M., Jonell, M., and Henriksson, P. (2017). Ocean space for seafood.Nat. Ecol. Evol. 1, 1224–1225. doi: 10.1038/s41559-017-0304-6
Weiss, C. V., Ondiviela, B., Guanche, R., Castellanos, O. F., and Juanes, J. A. (2018). A global integrated analysis of open sea fish farming opportunities.Aquaculture 497, 234–245. doi: 10.1016/j.aquaculture.2018.07.054
World Bank (2013). Fish to 2030: Prospect for Fisheries and Aquaculture. Washington, DC: World Bank.
Conflict of Interest:EP, RP, and DB are researchers employed at the Department
of Environmental Sciences, Informatics and Statistics, University of Venice (DAIS). RP and DB are shareholders of Bluefarm S.r.l., a spin-off company of DAIS. There are no patents, products in development or marketed products to declare. Copyright © 2020 Porporato, Pastres and Brigolin. This is an open-access article distributed under the terms of the Creative Commons Attribution License (CC BY). The use, distribution or reproduction in other forums is permitted, provided the original author(s) and the copyright owner(s) are credited and that the original publication in this journal is cited, in accordance with accepted academic practice. No use, distribution or reproduction is permitted which does not comply with these terms.