UNIVERSITY OF SASSARI
PhD School in Biomedical Sciences
Director: Professor Andrea Fausto Piana
Curriculum: Physiology, Morphology and Physiopathology of the Nervous System
CYCLE XXVIII
Sites and Mechanisms of Trigeminal Nerve
Stimulation: a Human and Animal Study
Supervisors
Prof. Franca Deriu
Dr. Paolo Enrico
PhD Candidate:
Dr. Beniamina Mercante
Summary 4
Introduction 5
1.1 Rationale and aim of the project. 9
Study 1: Trigeminal nerve stimulation modulates brainstem more than
cortical excitability in healthy humans. 11
2.1 Introduction 12
2.2 Methods and materials 13
2.2.1 Subjects 13
2.2.2 EMG recordings 13
2.2.3 Electrical stimulations (ES) 14
2.2.4 TMS 15
2.2.5 TNS 15
2.2.6 Experimental design 16
2.2.7 Experiment 1: TNS effects on brainstem excitability 16 2.2.8 Experiment 2: TNS effects on intracortical excitability 16 2.2.9 Experiment 3: TNS effects on cortical sensorimotor integration 17
2.3 Statistical analysis 17
2.4 Results 18
2.4.1 Experiment 1: TNS effects on brainstem excitability 18 2.4.2 Experiment 2: TNS effects on intracortical excitability 21 2.4.3 Experiment 3: TNS effects on cortical sensorimotor integration 23
2.5 Discussion 24
2.5.1 Effects of TNS on brainstem excitability 24 2.5.2 Effects of TNS on cortical excitability and sensorimotor integration 28
Study 2: Transcutaneous trigeminal nerve stimulation induces a long-term depression-like plasticity of the human blink reflex. 31
3.1 Introduction 32
3.2 Materials and methods 33
3.2.1 Subjects 33
3.2.2 EMG recordings 34
3.2.3 Electrical stimulations 34
3.2.4 TNS 35
3.2.5 Experimental design 35
3.2.8 Experiment 3: Aftereffects of unilateral real-TNS on BR 36
3.3 Statistics 37
5.4 Results 38
3.4.1 Experiment 1: Aftereffects of bilateral real-TNS on BR 39 3.4.2 Experiment 2: Effects of sham-TNS versus real-TNS on BR 41 3.4.3 Experiment 3: Aftereffects of unilateral real-TNS on BR 42
3.5 Discussion 43
3.5.1 Sites of action and possible mechanisms 45
Study 3: Effects of trigeminal nerve stimulation on rat hippocampal
neurogenesis 48
4.1 Introduction 49
4.2 Materials and Methods 50
4.2.1 Animal and surgical procedure 50
4.2.2 Nerve cuff electrodes. 51
4.2.3 Electrode implantation. 51 4.2.4 TNS 52 4.2.5 Drug treatment 52 4.2.6 Immunostaining 52 4.3 Statistical analysis 53 4.4 Results 54 4.5 Discussion 56 4.6 Conclusions 59 Conclusions 60 References 63
Summary
Trigeminal nerve stimulation (TNS) has proven efficacious in the treatment of several neurological disorders, but sites and mechanisms of action are still unknown. TNS effects were investigated on: intracortical circuits and sensorimotor integration at cortical level (Study 1), brainstem excitability and plasticity (Study 2), in healthy subjects; hippocampal neurogenesis (Study 3), in rats.
TNS consisted of 20min bilateral stimulation of the infraorbital nerve. Study 1: Short- and long-interval intracortical inhibition, intracortical facilitation,
short- and long-afferent inhibition were assessed using transcranial magnetic stimulation in 17 volunteers before and after TNS.
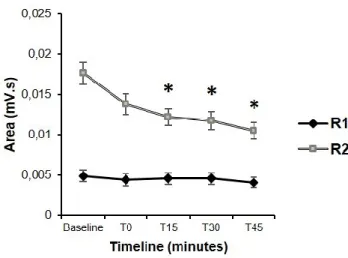
Study 2: The R1 and R2 areas of the blink reflex (BR) were measured before and after 0, 15, 30, 45min from TNS delivery.
Study 3: Hippocampal neurogenesis was evaluated in 18 male Sprague-Dawley rats after 24h from TNS, through immunohistochemical labeling of newly formed brain cells.
Results. Study 1: cortical excitability and sensorimotor integration were unaltered by TNS.
Study 2: The R2 area of the BR was significantly reduced after TNS at all time points tested. By contrast, R1 area was unaffected.
Study 3: The number of newly formed cells in the dentate gyrus was significantly increased after TNS.
These data suggest that TNS mainly acts on brainstem polysynaptic circuits with a minor role in modifying the activity of higher-level structures. Acute TNS induces a long-lasting inhibition of the R2 component of the BR, which resembles a long-term depression-like effects. In the rat TNS promotes new cell proliferation in the hippocampus, which supports the notion of an involvement of hippocampal plasticity in the TNS effects described in several neurological conditions.
The use of electrical and/or magnetic stimulation techniques in order to manipulate the activity of the central nervous system (CNS) has a long history.
Different brain stimulation techniques, both invasive and noninvasive, are currently used in neurology and psychiatry. Some common examples of therapeutic application of neurostimulation include:
● deep brain stimulation (DBS) which has now replaced the old methods of ablation used to treat movement disorders and today applied to treatments of Parkinson's disease, dystonia, epilepsy and psychiatric disorders such as some forms of depression, obsessive-compulsive disorder and Tourette's syndrome (Tekriwal and Baltuch, 2015);
● transcranial direct current stimulation (tDCS) used for neuropsychiatric disorders such as depression (Shiozawa et al 2014), motor function and cognitive disorders (Andrews et al., 2011; Elsner et al, 2013);
● sacral nerve stimulation (SNS) for the treatment of imbalances in the pelvic region and incontinence (Bemelmans et al., 1999; Brazzelli et al., 2006);
● repetitive transcranial magnetic stimulation (rTMS) for the treatment of various psychiatric cognitive disorders (Poleszczyk, 2015)
● glossopharingeal nerve stimulation (GNS) for the treatment of epilepsy
(Tubbs et al., 2002).
● vagus nerve stimulation (VNS), for the treatment of some forms of epilepsy (Connor et al., 2012), obesity (Bodenlos et al., 2014) and depression (Beekwilder and Beems, 2010);
● trigeminal nerve stimulation (TNS) as an alternative option to VNS the treatment of drug-resistant epilepsy (DeGiorgio et al., 2003), depression (Shiozawa, 2014) and migraine (Riederer et al., 2015) .
These techniques probably act via different mechanisms; some of these work by directly stimulating the brain, others indirectly through stimulation of peripheral nerves. In particular, the first group of techniques (DBS, tDCS, rTMS) are supposed to act with a top-down mechanism, that modulates brain activity directly through subcortical excitability changes in the activity of primary cortical
network. On the other hand, stimulation of peripheral nerves (VNS, TNS, GNS) may affect brain activity through a bottom-up mechanisms that is, by stimulating cranial nerves nuclei in the brainstem, which, in turn, make extensive connections to higher CNS structures (Shiozawa et al., 2014)
From a medical viewpoint neurostimulation techniques may provide several advantages with respect to conventional drug treatment:
● specificity: stimulation can be targeted to particular areas avoiding the insurgence of systemic side-effects, typical of traditional drug therapies; ● safety: neurostimulation techniques are generally well-tolerated and
almost devoid of dangerous side effects:
● flexibility: the treatment can be interrupted at any time.
With regard to the effects of cranial nerve stimulation, the first observation that VNS directly affected central function in cats is from Bailey and Bremer, 1938. This seminal work was confirmed by Dell and Olson in 1951 and primate studies provided evidence of VNS effects on basal limbic structures, thalamus, and cingulate cortex (MacLean, 1990).
Based on these findings it was hypothesized that VNS would have anticonvulsant properties (Zabara, 1985a, Zabara, 1985b), with an impact on both direct termination of an ongoing seizure as well as seizure prevention (Zabara, 1992). Following this basic work, VNS was further developed as an adjunct treatment for seizure disorders, leading to approval by the Food and Drug Administration (FDA) for the treatment of pharmacoresistant epilepsy in 1997.
VNS-induced mood elevation was serendipitously observed in epilepsy patients and prompted researchers to also examine possible effects of VNS on emotional health (Elger et al., 2000; Goodnick et al., 2001; Gaynes et al., 2011). Several clinical trials were conducted to evaluate the efficacy of VNS in depressed patients resistant to standard antidepressant treatments. The prospective investigation of VNS effects in depressed patients resulted in the FDA approval of VNS as an adjunct therapy for the treatment of drug-resistant major depression in 2005.
The clinical use of VNS has been also shown to suffer from several limitations (Ben-Menachem et al., 2015). Some of them are related to the surgical implantation of the stimulating device (hoarseness, cough, vocal cord paralysis, infections), but the most important limitation to the clinical use of VNS is the presence of a visceral component in the vagus nerve and in particular its role in cardiac function control (Schuurman and Beukers, 2009). Therefore in order to avoid a possible depressive effect on cardiac performance, VNS cannot be applied bilaterally nor at high stimulation frequencies, with an overall decrease in its efficacy.
To overcome the limitations of VNS, during the last decade an increasing number of experimental and clinical studies have focused their attention on TNS, which has been consistently proved to exert beneficial effects in the symptomatic treatment of several neuropsychiatric disorders (De Giorgio et al. 2003, 2009, 2011, 2013; Schoenen et al., 2013; Shiozawa et al,. 2014; Cook et al., 2015). In particular, Fanselow et al. (2000) first demonstrated in the rat, that electrical stimulation of the infraorbital branch of the trigeminus nerve (ION) reduces both frequency and duration of pentylenetetrazole-induced seizures. In the same study it was also shown, using field potential recording at the thalamic and cortical level, that TNS administration is able to stop the synchronized burst firing at its initial moment, with a general desynchronizing effect.
Based on these data, DeGiorgio and Coll. (DeGiorgio et al., 2003, 2006, 2009, 2011) proposed for the first time the use of TNS in patients with drug-resistant epilepsy, as adjuvant or alternative to VNS. More recently TNS has been also proposed in the treatment of other neurological and psychiatric disorders such as depression, attention deficit hyperactivity disorder, post-traumatic stress disorder, Lennox Gastaut syndrome, post-traumatic brain injury, migraine, and tinnitus (Soleymani et al., 2011), for which clinical trials are underway.
1.1 Rationale and aim of the project.
Despite the increasing success and use of TNS for the symptomatological treatment of different neurological and psychiatric affections, the neurobiological mechanisms and levels of action of this treatments are yet to be understood.
It has been proposed that the trigeminal nerve (being the largest cranial nerve), can represent a privileged way to forward modulatory signals to the brain (Cook et al., 2014), with the added value that the absence of a visceral component guarantees against the cardiac side-effects observed with VNS.
So far, the majority of the evidences seem to support the idea of a bottom-up effect of TNS on CNS functions. Therefore, TNS effects on higher brain structures should be secondary to the excitation of the ascending reticular formation (RF), probably induced by locus coeruleus (LC) and raphe nuclei (RN) activation, on which trigeminal afferents project through the nucleus of the solitary tract (NST) (Magdaleno-Madrigal et al., 2002; Fanselow, 2012). In particular affiliation to the midbrain reticular formation that would cause desynchronization of cortical firing through generalized activation of the ascending reticular system (Fanselow et al., 2000).
However, another possible explanation is a top-down effect of TNS, based on the fact that through the trigeminal nerve tactile sensations reach the primary somatosensory cortex, via the ventro-posterior medial thalamic nuclei. Indeed a recent imaging study has shown that TNS activates the inferior frontal gyrus, the anterior cingulate and parietotemporal cortices; on the other hand it has also been observed inhibition in the left parahippocampal gyrus, sensorimotor, parietal top right, temporo-occipital and visual cortices (Schrader et al., 2012; Silverman et al., 2011).
These data show that a more thorough evaluation of the neurophysiological mechanisms of TNS at different brain levels is definitely needed. Therefore, the aim of the present study was to examine the effect of acute administration of TNS on the excitability of the motor cortex and brainstem of healthy subjects, in order to clarify the possible origin of the therapeutic effects observed in clinical trials. Further, following the reported positive effect of both
VNS and TNS on patient’s mood and the known link between recovery from depression and increased hippocampal neurogenesis, a more in-deep study was performed to assess a possible positive effect of TNS on neural stem cells proliferation.
To this end, the intracortical excitatory and inhibitory circuits, as well as the processes of sensorimotor integration that occurs at the cortical level, were explored using a transcranial magnetic stimulation (TMS) approach (Kujirai et al., 1993; Ziemann et al., 1996; Classen et al., 2000; Tokimura et al., 2000).
Facilitation and inhibition of brainstem interneurons were also tested using the blink reflex (BR) and its recovery cycle (BRRC), a reflection trigeminal-facial with integration center at the level of the brainstem (Kimura, 1989; Berardelli et al., 1999; Cruccu et al., 2000; Cruccu et al., 2005). The effect of TNS administration on hippocampal neurogenesis was studied in the rat using an immunohistochemical technique in order to measure the number of newly formed cells in the dentate gyrus of the hippocampus.
Study 1: Trigeminal nerve stimulation modulates
brainstem more than cortical excitability in
2.1 Introduction
VNS is the only neurostimulation method acknowledged for the treatment of drug-resistant epilepsy (DRE) and of major depression (Howland 2014).
However, a large body of evidence supports TNS as a potentially valid alternative to VNS in the treatment of DRE (DeGiorgio et al., 2003, 2006, 2009, 2013; Pop et al., 2011). In addition to DRE, migraine (Schoenen et al., 2013) and depression (Cook et al., 2013) have evidenced benefit from treatment with TNS. Despite its proved clinical effectiveness, the sites of action in the CNS and the neurobiological mechanisms by which TNS exerts its therapeutic effects have been poorly investigated so far. Accumulating evidence suggest that, like VNS, TNS ultimately influences the pattern of neuronal activity, with the additional advantage that the V nerve may represent a privileged pathway for conveying neuromodulatory signals to the CNS (Cook et al., 2014). Evidence from experimentally induced epileptic animals show that TNS induces cortical and thalamic desynchronization (Fanselow et al., 2000; De Giorgio et al., 2011). This observation is in line with EEG desynchronization observed in epileptic patients following acute (Todesco S., personal communication) as well as chronic TNS (Moseley and De Giorgio 2014). Hence, it has been proposed that the antiepileptic effect of TNS may be due to cortical desynchronization arising from changes in cortical excitability (Fanselow, 2012). However, as yet, a direct effect of TNS on cortical excitability has not been investigated in epileptic patients. A recent study, using TMS, indicates that acute continuous TNS administration does not affect cortical excitability in healthy subjects (Axelson et al., 2014). These data warrant a further in-depth evaluation of the neurophysiological mechanisms of TNS at different brain levels. In fact, the trigeminal afferent system has multiple targets within the CNS, including brainstem and thalamic nuclei, and from these up to subcortical and cortical structures (Fanselow, 2012). Both the brainstem and the cerebral cortex are accessible to noninvasive neurophysiological investigations in physiological and pathological conditions. Brainstem function is commonly studied by recording the BR and its recovery cycle (BRRC), which are considered reliable tests of brainstem interneuron
excitability (Kimura et al., 1969; Kimura, 1983; Berardelli et al., 1999; Cruccu and Deuschl, 2000). Investigations of cortical circuits are extensively performed using paired-pulse TMS (Valls-Solé et al., 1992; Kujirai et al., 1993; Wassermann et al., 1996; Ziemann et al., 1998). TMS protocols allow the exploration of inhibitory and facilitatory intracortical interneurons underlying the short- and long-interval intracortical inhibition (SICI and LICI, respectively), intracortical facilitation (ICF) and short-interval intracortical facilitation (SICF) phenomena (Valls-Solé et al., 1992; Kujirai et al., 1993; Wassermann et al., 1996; Ziemann et al., 1996; Chen et al., 1998). TMS protocols are also available to investigate sensorimotor integration processes occurring at cortical level, such as short- and long- afferent inhibition (SAI and LAI, respectively) (Tokimura et al., 2000; Classen et al., 2000).
The present study proposes to investigate the after effects of acute TNS administration on brainstem and intracortical excitability as well as on cortical sensorimotor integration, by assessing, before and after TNS, the: (i) BR and BRRC; (ii) SICI, LICI, ICF and SICF; (iii) SAI and LAI.
2.2 Methods and materials
2.2.1 SubjectsSeventeen healthy volunteers (9 females and 8 males; 30.0 ± 4.4 years old; range 24–40 years) participated in the study. All the subjects, but one, were right handed. Prior to the study subjects gave their informed written consent and the procedure, approved by the local ethical committee (Bioethics Committee of ASL n.1 Sassari, ID 982/2/L) was in accordance with the Helsinki Declaration. None of the participants had a history of neurological and/or psychiatric diseases, was on medication and presented contraindications to undergo TMS and/or surface electrical stimulation procedures.
EMG signals were recorded (D360 amplifier; Digitimer Ltd, Welwyn Garden City, UK) using 9-mm-diameter Ag–AgCl surface cup electrodes, placed over the target muscle in a belly tendon montage. Trials with excessive EMG artifact were rejected online. Data were recorded and analyzed using Signal 5.02 software (Cambridge Electronic Design, UK).
In experiment 1, the first (R1) and the second (R2) components of the BR were recorded bilaterally from the orbicularis oculi muscle (OO), with the recording electrode placed over the lower lid, the reference electrode two cm far from the lateral cantus and the ground electrode over the forehead. EMG was amplified (×5000), filtered (bandpass 50–5000 Hz) and sampled (10 kHz per channel in a window frame of 4000 ms) using a CED1401 power analogto-digital converter (Cambridge Electronic Design, Cambridge, UK). The raw blink recordings were DC-corrected, rectified, and averaged for off-line measurements.
In experiment 2 and 3, motor evoked potentials (MEP) were recorded from the first dorsal interosseous muscle (FDI) of the dominant hand. The recording electrode was placed over the FDI, the reference electrode on the first metacarpophalangeal joint and the ground electrode on the volar surface of the forearm. EMG was amplified (×1000), filtered (bandpass 3–3000 Hz) and sampled (5 kHz per channel in a window frame length of 250 ms) using a CED1401 power analog-to-digital converter.
2.2.3 Electrical stimulations (ES)
To elicit the BR in experiment 1, ES of the left supraorbital nerve (SON) was delivered at the supraorbital notch, via cup electrodes (cathode over the homonymous foramen and anode two cm lateral) connected to a DS7A Stimulator (Digitimer, Welwyn Garden City, Herts, UK). All stimuli were square waves (0.2 ms duration), and stimulus intensity was set at three times the R2 threshold (lowest intensity that evoked at least five R2 responses in 10 consecutive trials).
ES were delivered to the SON at variable time intervals (between 20 and 40 s) to minimize habituation of the BR. To test sensorimotor integration in experiment 3,
wrist through bipolar electrodes (cathode proximal) connected to a Digitimer DS7A constant current stimulator. ES consisted of single square-wave pulses of 0.2 ms width and 0.25 Hz frequency; intensity was set at nearly 2–3 times the perceptual threshold (PT), just above the motor threshold for evoking a visible twitch of the thenar muscles.
2.2.4 TMS
TMS of the motor cortex innervating the dominant hand was performed using a figure-of-eight coil (external loop diameter of 9 cm), with the coil handle pointing backwards and about 45° laterally.
Magnetic stimuli were generated via two Magstim 200 stimulators connected in a Bistim module (Magstim Co., Whitland, Dyfed, UK). The optimal stimulation site for eliciting MEPs in the contralateral FDI was marked on the scalp with a soft tip pen to ensure that the coil remained in the same place throughout the experiments. In all experiments, TMS frequency was 0.25 Hz.
The resting motor threshold (RMT) was taken as the lowest TMS intensity that elicited, in the relaxed FDI, MEPs of 50 µV in at least 5 out of 10 consecutive trials (Rothwell et al., 1999). Motor threshold was expressed as a percentage of the maximum stimulator output (MSO). The test stimulus (TS) intensity was the intensity sufficient to evoke a motor response in relaxed FDI of 1 mV peak-to peak amplitude (1 mV MEP).
2.2.5 TNS
TNS was delivered bilaterally to the infraorbital nerve (ION) through 26-mm-diameter disposable, hypoallergenic, silver-gel self-adhesive stimulating electrodes (Globus, Domino s.r.l., Codognè, TV, IT) placed over the ION foramina and connected to a Winner® stimulator (Fisioline biomedical instrumentation, Verduno, CN, IT). According to DeGiorgio’s original protocol (DeGiorgio et al., 2003), the stimulus consisted of an asymmetric biphasic squarewave pulse with an electrical mean equal to zero, duration of 0.25 ms, frequency of 120 Hz, delivered in a cyclic modality where 30 s ON and 30 s OFF
were alternated. The total period of TNS was equal to 20 min, according to Schoenen et al. (2013). Stimulation intensities ranged from 1 to 20 mA and corresponded, for each ION, to the maximal pain sub-threshold intensity endurable comfortably by the subject.
2.2.6 Experimental design
BR (Experiment 1) and TMS (Experiment 2 and 3) protocols were performed in all subjects in two distinct experimental sessions. Experiments were carried out in a quiet room by the same operator and at a consistent time of the day. Subjects sat in a comfortable chair with the neck supported and were asked to keep their eyes open and to stay relaxed but alert during data collection.
2.2.7 Experiment 1: TNS effects on brainstem excitability
The early ipsilateral R1 response and the late ipsilateral (iR2) and contralateral (cR2) R2 responses induced by SON stimulation (Kimura, 1983) were assessed before and immediately after TNS. EMG recordings from OO muscles, started 2 s before each stimulus, to allow recognition of excessive background muscle activity and thus rejecting the trial online. R2 threshold, R1 and R2 areas were calculated before and after TNS.
The R2 recovery cycle was investigated using two electrical stimuli of equal intensity delivered to the SON at interstimulus intervals (ISIs) of 250, 500 and 1000 ms (10 trials for each ISI in a randomized order). The R2 inhibition was calculated as a ratio of conditioned/unconditioned R2 area, for each ISI.
2.2.8 Experiment 2: TNS effects on intracortical excitability
RMT, 1 mV MEP, SICI, ICF, SICF and LICI were measured before and immediately after TNS. SICI and ICF were assessed through the classical paired pulse paradigm described by Kujirai et al. (1993). Conditioning stimulus (CS) intensity was 80 % of RMT, while TS intensity was adjusted to elicit 1 mV MEP in the dominant FDI. SICF was tested through the paired-pulse protocol described
by Ziemann et al. (1998). The ISIs tested 1.5 ms for SICF, 3 ms for SICI and 10 ms for ICF were examined in a randomized order. Ten unconditioned MEPs and 10 conditioned MEPs for each ISI were recorded in this experimental block. LICI was evaluated using the paired-pulse protocol consisting of suprathreshold CS and TS (Valls-Solé et al., 1992; Wassermann et al., 1996). The intensities were both adjusted to elicit 1 mV MEP and separated by 100 ms ISI. Twenty pulses were delivered in a randomized order (10 pulses for conditioned MEP at each ISI and 10 pulses for the test MEP alone).
The MEP peak-to-peak amplitude was measured for each trial and then averaged. Mean amplitude of the conditioned MEP was expressed as a ratio of the averaged test MEP.
2.2.9 Experiment 3: TNS effects on cortical sensorimotor integration
SAI and LAI were induced coupling the ES of the median nerve with TMS of the primary hand motor cortex (Chen et al., 1998; Classen et al., 2000; Tokimura et al., 2000). The 20 ms ISI for SAI and the 200 ms ISI for LAI were examined in a randomized order. Ten unconditioned MEPs and 10 conditioned MEPs for each ISI were recorded and averaged.
The MEP peak-to-peak amplitude was measured for each trial and averaged, before and immediately after TNS administration. Mean amplitude of the conditioned MEP was expressed as a ratio of the averaged test MEP.
2.3 Statistical analysis
Statistical analysis was performed with SPSS 18 software (SPSS Inc, Chicago, IL, USA). In the analysis performed with repeated measures analysis of variance (ANOVA), compound symmetry was evaluated testing the sphericity with the Mauchly’s test. The Greenhouse-Geisser correction was used to compensate for non-spherical data. A p value <0.05 was considered significant. Unless otherwise stated, values are expressed as mean ± standard deviation (SD) of the mean. In experiment 1 and 2, differences between R2 threshold, R1 area and RMT before and after TNS were assessed using Student’s paired t test.
In experiment 1, repeated measures ANOVA with TNS (before, after) and SIDE (iR2, cR2) as within-subject factors was performed to evaluate different effects of TNS on the ipsilateral and contralateral OO muscles. In case of any significant effect of SIDE or any significant interaction SIDE*ISI, TNS effects were measured on iR2 and cR2 together. Repeated measures ANOVA and post hoc Student’s paired t test were used to test the effect of ISI (250, 500, 1000 ms) and TNS (before, after) on R2 ratio.
In experiment 2 and 3, the effect of TNS (before, after) and ISI (SICI: 3 ms; ICF: 10 ms; SICF: 1.5 ms; LICI: 100 ms; SAI: 20 ms; LAI: 200 ms) on the amplitude of the conditioned MEP (expressed as conditioned amplitude/unconditioned amplitude) was assessed by ANOVA using a model of repeated measures. In case of significant values, Student’s paired t test was used for post hoc analysis applying the Bonferroni correction for multiple comparisons when needed.
2.4 Results
No subjects reported any side effects or pain during and/ or after the experimental sessions, apart from sleepiness or relaxation during and immediately after TNS delivery.
2.4.1 Experiment 1: TNS effects on brainstem excitability
Blink reflex
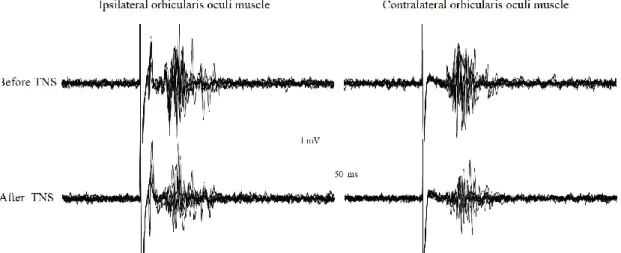
Following unilateral SON stimulation, all subjects showed an early R1 ipsilateral response and a late bilateral R2 response. The BR recorded at baseline and immediately after TNS administration is reported in Fig. 1.
Fig. 1 Blink reflex recorded from a representative subject before and immediately after
delivery of trigeminal nerve stimulation. The blink reflex was evoked by the electrical stimulation of the left supraorbital nerve (stimulus parameters: pulse duration 0.2ms, intensity 24 mA, frequency 0.02-0.025 Hz). Trigeminal nerve stimulation was given bilaterally over the infraorbital nerve and consisted of trains (asymmetric biphasic square wave pulses of 0.25 ms, 120 Hz) delivered in a cyclic modality (30 s ON and 30 s OFF) for a total period of 20 minutes, at an intensity of 11 mA.
TNS administration did not affect the R1 component of the BR, by contrast both ipsilateral and contralateral R2 responses appeared reduced (Fig. 1), showing a cumulative significant decrease of their areas to 82 ± 33 and 85 ± 35 % of the pre-TNS values (p < 0.05), respectively (Fig. 2).
Fig.2 Effects of trigeminal nerve stimulation on the areas of the R1 and R2 components of the blink reflex. Cumulative data showing changes of the R1, ipsilateral R2 (iR2) and contralateral R2 (cR2) areas observed immediately after trigeminal nerve stimulation (TNS). TNS
after effects are represented as mean ± SEM percentage values of the R1, iR2 and cR2 areas measured before TNS, which were taken as 100% (horizontal dotted line). TNS administration proved to be able to affect only the R2 response, which appeared significantly reduced. *: p<0.05.
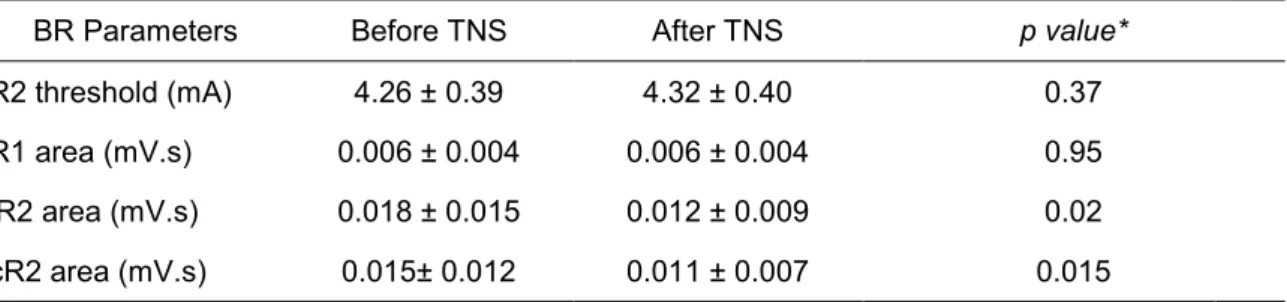
The raw values of R2 threshold R1, iR2 and cR2 areas are reported in Table 1. Two-way repeated measures ANOVA with TNS (before, after) ad SIDE (iR2, cR2) showed a significant effect of TNS (p = 0.018) on the R2 area but no effect of SIDE or interaction TNS*SIDE. Student’s paired t test revealed a significant reduction in iR2 (p = 0.02) and cR2 (p = 0.015) areas after TNS.
Blink reflex recovery cycle
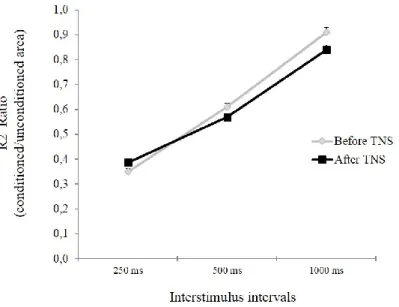
All subjects showed a normal BRRC, with an almost complete recovery of the response R2 response at 1000 ms ISI, which appeared not affected by TNS delivery at any ISI used (Fig. 3). A three-way repeated measures ANOVA with TNS (before, after), SIDE (iR2, cR2) and ISI (250, 500, 1000 ms) as within-subject factors, showed no interaction SIDE*ISI and TNS*SIDE*ISI, demonstrating that TNS effects on iR2 and cR2 ratios were not significantly different, according to SIDE. The averaged R2 ratios were then compared by means of two-way repeated measures ANOVA with ISIs and TNS as within-subject factors.
Table 1 Mean ± SD values (n=17) of the blink reflex parameters, before and after
Trigeminal Nerve Stimulation
BR Parameters Before TNS After TNS p value*
R2 threshold (mA) 4.26 ± 0.39 4.32 ± 0.40 0.37
R1 area (mV.s) 0.006 ± 0.004 0.006 ± 0.004 0.95
iR2 area (mV.s) 0.018 ± 0.015 0.012 ± 0.009 0.02
cR2 area (mV.s) 0.015± 0.012 0.011 ± 0.007 0.015
TNS = Trigeminal Nerve Stimulation; BR = Blink Reflex; R2= R2 component of the BR; iR2 = ipsilateral R2 area; cR2 = contralateral R2 area; *Student t test.
Statistical analysis showed a significant effect of ISI (p < 0.001) but no significant interaction TNS*ISI. Posthoc analysis revealed inhibition of conditioned R2 at 250 and 500 ms (p < 0.001).
Fig. 3 Effects of trigeminal nerve stimulation (TNS) on the R2 recovery cycle.
The graphs report mean ± SEM values of the conditioned R2 area of the blink reflex, expressed as ratio of the unconditioned response. The left supraorbital nerve was stimulated at interstimulus intervals of 250, 500 and 1000 ms and the ratio between R2 conditioned area/unconditioned area was calculated at each ISI. With respect to baseline, no significant changes of the R2 recovery cycle were observed after TNS administration at any ISI tested.
2.4.2 Experiment 2: TNS effects on intracortical excitability
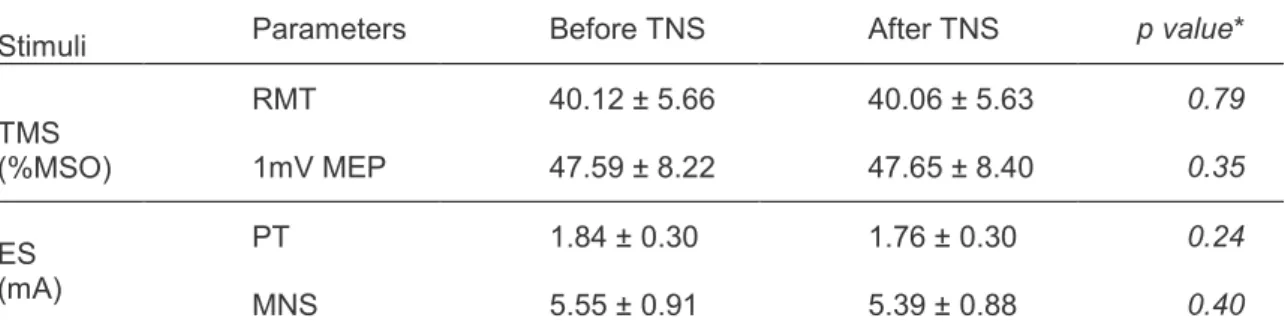
Student’s paired t test showed that RMT and 1 mV MEP intensity values were not significantly different before and after TNS (Table 2).
Table 2 Mean ± SD (n = 17) of motor and perceptual thresholds, intensities of magnetic and electrical stimulations before and after Trigeminal Nerve Stimulation.
Stimuli Parameters Before TNS After TNS p value*
TMS (%MSO) RMT 40.12 ± 5.66 40.06 ± 5.63 0.79 1mV MEP 47.59 ± 8.22 47.65 ± 8.40 0.35 ES (mA) PT 1.84 ± 0.30 1.76 ± 0.30 0.24 MNS 5.55 ± 0.91 5.39 ± 0.88 0.40
TNS: Trigeminal Nerve Stimulation; TMS: transcranial magnetic stimulation, ES: electrical stimulation; RMT: resting motor threshold; 1 mV MEP: TMS intensity that evokes motor potential of 1 mV; %MSO: percentage of maximal stimulator output; PT: perceptual threshold; MNS: intensity of median nerve stimulation; *Student t test.
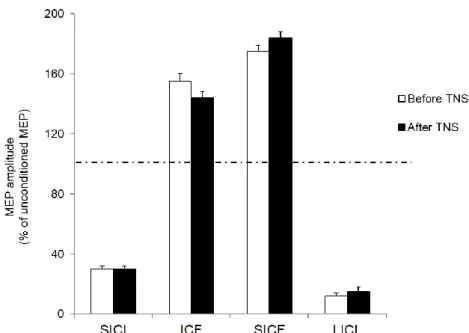
Two-way repeated measures ANOVA comparing TNS effects (before vs. after) and ISI in the paired-pulse protocols testing SICF, SICI, ICF and LICI (at ISIs of 1.5, 3, 10 and 100 ms, respectively) revealed a significant effect of ISI (p < 0.001) but no significant effect of TNS or interaction between TNS and ISI. Because of this lack of interaction, averaged MEP amplitudes measured before and after TNS were compared by means of a one-way ANOVA with ISI as main factor. Results showed a significant effect of ISI (p < 0.001) and planned post hoc Student t test showed a significant (p < 0.001) inhibition at 3 and 100 ms (SICI and LICI, respectively) and a significant facilitation (p < 0.001) at 1.5 and 10 and ms (SICF and ICF, respectively) (Fig. 4).
Fig. 4 Effect of trigeminal nerve stimulation on intracortical excitability. Histograms report short interval intracortical inhibition (SICI), intracortical facilitation (ICF), short interval intracortical facilitation (SICF) and long interval intracortival facilitation (LICI) measured from the dominant FDI muscle, before (white colums) and after (black colums) 20 minutes of trigeminal nerve stimulation (TNS). Paired TMS induced a significant inhibition of motor evoked potentials (MEPs) at 3 ms (SICI) and 100 ms (LICI) intervals and a significant facilitation at 10 ms (ICF) and 1,5 ms (SICF) interstimulus intervals. Ordinates indicate MEP amplitude expressed as a mean ± SEM percentage value of the unconditioned MEP, induced by a single pulse TMS, taken as 100% (dotted horizontal line). All parameters of intracortical excitability appeared substantially unchanged after TNS administration
2.4.3 Experiment 3: TNS effects on cortical sensorimotor integration
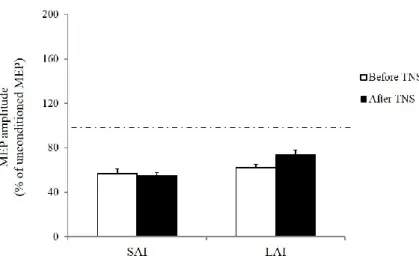
TNS administration did not significantly affect PT and ES intensity values (Table 2) as well as the short-latency (SAI) and long-latency (LAI) inhibitory effects of a conditioning ES of the median nerve on MEPs induced in the FDI by TMS of the contralateral hand motor area (Fig. 5).
A two-way repeated measures ANOVA with TNS (before, after) and ISI (20 ms for SAI, 200 ms for LAI) as within-subject factors showed a significant effect of ISI (p < 0.001) but no significant interaction between TNS and ISI. Post hoc analysis revealed significant inhibitory effects on the conditioned MEP amplitude both at 20 and 200 ms ISI (p < 0.001).
Fig. 5 Effect of trigeminal nerve stimulation on sensory-motor integration occurring at cortical level. Histograms show values of short afferent inhibition (SAI) and long afferent inhibition (LAI) measured from the dominant FDI muscle before (white column) and after (black columns) trigeminal nerve stimulation (TNS). MEP amplitudes were significantly reduced when TMS of the cortical motor area innervating the dominant hand was preceded by electrical stimulation of the ipsilateral median nerve by 20 ms (SAI) and 200 ms (LAI) intervals However, SAI and LAI did not change significantly after TNS. Ordinates indicate MEP amplitude (mean ± SEM) expressed as a percentage of unconditioned MEP induced by the TMS alone, taken as 100% (dotted horizontal line).
2.5 Discussion
The present study examined brainstem and cortical excitability following acute TNS. Results showed that TNS significantly depresses brainstem circuits mediating the R2 but not the R1 component of the BR. By contrast, the activity of both facilitatory and inhibitory intracortical interneurons as well as processes of sensorimotor integration, occurring at cortical level, appeared unaltered after TNS.
2.5.1 Effects of TNS on brainstem excitability
To the best of our knowledge, the current study is the first to examine the effects of acute TNS on brainstem excitability. Our data showed that acute, cyclic,
20-min TNS ad20-ministration significantly alters the magnitude of the R2 response of the BR, leaving the R1 component unaffected.
These different effects exerted by TNS on the BR components should be interpreted in light of the different circuits they involve and of the functional properties of the nervous structures which modulate them. The R1 circuit is thought to be restricted to the pons, where an ipsilateral pathway connects the sensitive afference, the main trigeminal sensitive nucleus and the facial motor nucleus (Aramideh and Ongerboer de Visser, 2002; Cruccu et al., 2005). The consistency of the R1 response after TNS, in comparison with the baseline, indicates that no changes in the excitability status of the R1 oligosynaptic circuit occurred. Indeed, the R1 response is regarded as a stable component of the BR, insensitive to suprategmental influences, including supratentorial lesions, disorders of consciousness and cognitive factors (Cruccu and Deuschl, 2000). On the other hand, the R2 response arises out of a complex bilateral polysynaptic circuit, which includes the spinal trigeminal nucleus, neurons in the lateral tegmental field and the lateral reticular formation (Kimura, 1983; Bourque and Kolta, 2001; Aramideh and Ongerboer de Visser, 2002; Cruccu et al., 2005). The R2 response is less stable than the R1 response and appears very sensitive to sensory inputs and to suprategmental influences, consciousness status and cognitive factors (Cruccu and Deuschl, 2000), probably because of the high number of synapses in the reflex circuits (Berardelli et al., 1999). Our data offer no indication on the possible origin of the TNS induced inhibitory effect on the R2 circuit. However, since the R2 components share the same motoneurons with the R1 response, the TNS-induced bilateral and symmetric reduction in the R2 area cannot be explained by possible changes in the excitability of neurons in the facial motor nucleus. Instead, this effect is likely due to an increased inhibitory weight on those structures (spinal trigeminal nucleus, interneurons in the lateral reticular formation and in the lateral tegmental field) underpinning the R2 circuit, which are not in common with the R1 pathway (Aramideh and Ongerboer de Visser, 2002; Cruccu et al., 2005). All these areas can be possible targets for TNS action. Afferent trigeminal fibers project primarily to the trigeminal nuclei in the brainstem, from where facial and oral somatosensory information is
sent to the thalamus and then conveyed to the somatosensory cortex. Trigeminal nuclei are also connected to brain areas which are thought to modulate the lateral reticular formation, such as the NTS and the LC. The NTS is the main recipient of vagal afferents (Nieuwenhuys et al., 2008), which in part also projects to the spinal trigeminal nucleus (Kiernan, 2009). The NTS is, in turn, connected to noradrenergic and serotoninergic systems associated with the regulation of mood, anxiety, emotions (Ruffoli et al., 2011) and to glutamatergic and GABAergic systems regulating the susceptibility to seizures (Walker et al., 1999). The LC provides virtually all noradrenergic innervation to the brain by means of its widespread varicosities and plays a crucial role for vigilance (Halliday, 2004). Both LC and NTS are considered as nuclei which disseminate neuromodulatory compound (Fanselow, 2012) in the CNS, since they profoundly affect its excitability at virtually all levels. In addition, the LC and the NTS are believed to play a key role in mediating the clinical benefits observed following TNS in several neurological and neuropsychiatric disorders such as epilepsy, depression, anxiety and migraine (Shiozawa et al., 2014; Fanselow, 2012). In addition to the indirect effects on the lateral reticular formation, TNS can also modulate the activity of interneurons in the lateral tegmental field. This is suggested by the sedative effects described during SON stimulation (Piquet et al., 2011) which aligns with the relaxing effects following ION stimulation in our subjects. It has been shown that the level of arousal influences in a different manner the early and late components of the BR (Shahani, 1968). For instance, during sleep the R1 component of the BR is absent, while the second component is preserved. On the other hand, an apprehension state results in a marked increase in the amplitude of the R2 component of the BR.
Conversely, when the subject is relaxed and assured that the electrical stimulus would not be painful, only the first component is elicitable. The LC, which is recognized as a major wakefulness-promoting nucleus (Samuels and Szabadi, 2008) and is a relays station between trigeminal afferent projecting neurons and facial motoneurons involved in the BR circuit (Dauvergne et al., 2008; Steidl et al., 2004; Bourque and Kolta, 2001), could modulate the occurrence of the blinking, facilitating or inhibiting the BR, depending on the arousal state,
emotions or alertness (Ueno and Uchikawa, 2004). Basing on the above reported literature, it is reasonable to speculate that an overall TNS-induced decrease in the level of arousal could explain the observed reduction in the R2 area.
The excitability of the BR has been experimentally modulated with other methods using repetitive stimulation of the trigeminal nerve, like the high-frequency stimulation (HFS) of the SON (Mao and Evinger, 2001). HFS has been demonstrated to facilitate or attenuate the R2 response of the BR, depending on the time the burst was applied. These effects were attributed to a long-term potentiation or to a long-term depression of the wide dynamic range neurons involved in the BR circuit (Mao and Evinger, 2001; Quartarone et al., 2006; Zeuner et al., 2010; Bologna et al., 2010; Suppa et al., 2011, 2014) These data allow speculating that the TNS-induced reduction in the R2-area might be mediated by plastic changes in the BR, although long-term after effects on the BR were not possible to be investigated in the present experimental set up. Although the TNS protocol used in this study significantly reduced the R2 area of the BR, it proved unable to affect the activity of brainstem inhibitory interneurons that modulate the R2 recovery cycle. Our subjects showed a normal R2 recovery curve after TNS, suggesting that trigeminal stimulation was not able to influence passive mechanisms or activation of negative feedback circuits which are accounted for suppression of the R2 response (Cruccu and Deuschl, 2000). As pointed out above, the excitability of the R2 component of the BR is modulated by inputs other than the local ones originating in the brainstem, like descending projections coming from suprasegmental levels (Kumru et al., 2009; Valls-Solé et al., 2004; Kimura, 1973). In particular, a key role in the modulation of the excitability of brainstem interneurons involved in the R2 recovery cycle seems to be played by the basal ganglia, via the superior colliculus (Basso et al., 1996). This assumption is supported by the demonstration that in pathological conditions, characterized by a basal ganglia dysfunction, the R2 recovery cycle is altered, while the R1 and R2 areas are unaffected (Pauletti et al., 1993; Berardelli et al., 1999; Nisticò et al., 2014). Therefore, it is conceivable that TNS
effects are mainly exerted on brainstem structures and are unlikely to involve basal ganglia circuits.
2.5.2 Effects of TNS on cortical excitability and sensorimotor integration
Our study did not provide evidence of any effect exerted by TNS on the resting and active motor thresholds as well as on the activity of cortical interneurons mediating SICF, SICI, ICF and LICI phenomena. These findings, obtained following 20-min of cyclic bilateral TNS of the ION, are in agreement with data reported by a recent work, performed in healthy subjects, where a 40-min continuous TNS delivered to the SON, failed to show any alteration of the excitability of SICI, ICF and LICI circuits recorded in the hand motor cortex (Axelson et al., 2014). Our study demonstrated for the first time that sensorimotor integration processes occurring at cortical level (i.e. SAI and LAI) were also unaffected by TNS. It should be taken into account that the hand motor cortex may not be a specific “spatial” target for TNS. However, this area was used in this study as a model to assess cortical excitability for several reasons: first, all single and paired TMS protocols have been widely investigated and hence standardized in the hand motor cortex (Rossini et al., 2015); second, the same protocols have been also studied in cranial muscles but there is not universal agreement yet on the cortical origin as well as on reproducibility of motor evoked responses (Cruccu et al., 1989, 1990, 1997; Kobayashi et al., 2001; Dubach et al., 2004; Sohn et al., 2004; Paradiso et al., 2005; Ortu et al., 2008; Pilurzi et al., 2013); third, recordings of TMS-induced responses from cranial muscles are technically challenging due to the difficulty or impossibility to evoke stable MEPs in resting conditions, to cross-talk from neighboring muscles, high motor threshold of masseter and facial motor area (Ortu et al., 2008; Cattaneo and Pavesi, 2014); and finally, most of studies performed in neurological and psychiatric conditions not involving the motor cortex used TMS over the hand motor area and concluded that this procedure is the most suited one to disclose cortical excitability changes without any spatial specificity (Kobayashi and Pascual-Leone, 2003; Di Lazzaro et al., 2004; Badawy et al.,
TNS parameters used in the present study are proved to be clinically efficacious and safe in epilepsy (DeGiorgio et al., 2006; Pop et al., 2011), in major depressive disorders (Cook et al., 2013) and in migraine (Schoenen et al., 2013), similar to the well-established VNS therapy (Groves and Brown, 2005). The similarity of clinical effects induced by VNS and TNS has given rise to the hypothesis that these neuromodulatory interventions may share not only crucial anatomical structures but also neurobiological mechanisms (Fanselow, 2012; Bari and Pouratian, 2012). The effects of VNS on hand cortical excitability, namely on SICI were explored by only one study (Di Lazzaro et al., 2004). Di Lazzaro and Coll. studied VNS effects on SICI of epileptic patients, and interestingly, they found that only those patients with a pathologically reduced SICI responded to VNS with a SICI increase. Conversely, patients with a normal SICI had a lack of VNS effect. These findings lead these authors to hypothesize that VNS could be of limited value when the baseline levels of intracortical inhibition are high, probably because of a “floor effect” (Di Lazzaro et al., 2004). It is reasonable to assume that also the inefficacy of TNS on the cortical excitability of healthy subjects, observed in the present study and in the study of Axelson et al. (2014), might be explained in terms of baseline levels, which may account for a quasi “floor” or “ceiling” effect, so that the potential influence of TNS cannot be demonstrated physiologically.
In most of clinical studies (DeGiorgio et al., 2006, 2013; Pop et al., 2011; Cook et al., 2013; Schoenen et al., 2013), TNS was delivered for long periods, thus our findings cannot be generalized to the clinical context. In the present study, a short-lasting TNS rather than a chronic TNS was delivered since our aim was to investigate the site of action, cortical and/or subcortical, of the TNS rather than exploring its clinical effects in the short-term period. However, 20-min TNS have been also proved to be able to induce short-term effects in patients with migraine (Piquet et al., 2011; Schoenen et al., 2013).
In conclusion, in normal subjects 20 min of cyclic bilateral TNS of the ION was able to induce after effects on brainstem polysynaptic circuits mediating the R2 component of the BR. By contrast, it proved inefficacious in modifying the activity of higher-level structures involved in the R2 recovery cycle and in modulation of
cortical excitability. Further experiments performed in pathological conditions presenting these last parameters altered, might provide more information on TNS sites and mechanisms of action. Moreover, it may be worth investigating whether TNS administered chronically has a higher potential in producing measurable after effects on its CNS targets.
Study 2: Transcutaneous trigeminal nerve stimulation
induces a long-term depression-like plasticity of the
3.1 Introduction
Transcutaneous stimulation of cranial nerves has been used to treat several neurological conditions. In particular, TNS is a noninvasive neuromodulation method which has been recently proposed for the treatment of drug-resistant epilepsy (DeGiorgio et al., 2003, 2006, 2009, 2013; Pop et al., 2011; Moseley and DeGiorgio, 2014; Soss et al., 2015; Cook et al., 2015), migraine (Schoenen et al., 2013), and depression (Schrader et al., 2011; Cook et al., 2013, 2014; Shiozawa et al., 2015). TNS has been proved to be safe, not associated with adverse cardiovascular events (Pop et al., 2011), and to have some advantages in comparison with the well acknowledged VNS. In fact, differently from VNS, TNS can be applied bilaterally with larger effects than unilateral stimulation (Fanselow et al., 2000; DeGiorgio et al., 2003) and none of the autonomic disadvantages of a bilateral VNS (Pop et al., 2011; Howland, 2014).
Despite its proved clinical effectiveness, the neurophysiological mechanisms by which TNS modulates brain activity are still under debate. TNS is thought to involve a number of different actions on the nervous system, including changes in the levels of inhibitory or excitatory networks (Faingold, 2008a, b; Shiozawa et al., 2014). Furthermore, recent animal and human studies suggested that cranial nerve stimulation causes neuroplasticity and neurogenesis in the brain (Marrosu et al., 2003; Follesa et al., 2007; Faingold, 2008a; Biggio et al., 2009; Shiozawa et al., 2014; Grimonprez et al., 2015). Stimulation techniques can be used to modulate disease symptoms inducing short- and long-lasting increase (long-term potentiation, LTP) or decrease (long-term depression, LTD) in synaptic transmission (Cooke and Bliss, 2006; Bliss et al., 2013). In the last decade, LTP-like plasticity and LTD-LTP-like plasticity have been studied at subcortical level using the BR as a model suitable to document some neurophysiological mechanisms underlying brain stem function (Aramideh and Ongerboer de Visser, 2002; Valls-Solé, 2005). The BR consists of two electromyographic (EMG) responses evoked in the orbicularis oculi (OO) muscles by the percutaneous electrical stimulation of the supraorbital branch of the trigeminal nerve (supraorbital nerve, SON). The early R1 response is mediated by an oligosynaptic pontine circuitry,
whereas the late R2 component results from the activation of a polysynaptic chain of brain stem interneurons extending in the lateral reticular formation at the pontine and medullar level (Aramideh and Ongerboer de Visser, 2002; Cruccu et al., 2005). Low-frequency stimulation (LFS) of the SON has been proved to induce a significant reduction in the BR integral and the sensory-evoked cortical potentials (Schorr and Ellrich, 2002; Ellrich and Schorr, 2004). Furthermore, noxious LFS of the mental nerve also causes a decrease in the masseteric inhibitory reflex (Ellrich and Schorr, 2002). Both these effects lasted for at least 1 h, meeting the criteria for an LTD-like effect (Hess and Donoghue, 1996), which led the authors to conclude that LTD-like plasticity of synaptic transmission in the brain stem can be reliably induced by LFS of trigeminal afferents (Schorr and Ellrich, 2002; Ellrich and Schorr, 2002). In addition to LFS, high-frequency stimulation (HFS) of the SON also has been demonstrated to facilitate or attenuate the R2 response of the BR, depending on the time the burst was applied. In fact, an LTP- or an LTD-like effect was observed when the burst coincided or preceded the reflex blink, respectively (Mao and Evinger, 2001). Another method able to alter brain stem excitability is a cyclic 20-min TNS, which recently has been proved to depress significantly the area of the R2 component of the BR, without modifying its recovery cycle (Mercante et al., 2015). Plastic mechanisms mediating this TNS-induced effect have been hypothesized, but evidence of this phenomenon is still lacking. This hypothesis was here tested by investigating whether such a protocol of TNS exerts long-term plastic changes on brain stem excitability.
3.2 Materials and methods
3.2.1 SubjectsThirty-one volunteers (18 females and 13 males; 28 ± 4.5 years old; range 20–37 years) participated in the study. Informed written consent was obtained from all subjects and the procedure, approved by the local ethical committee (Bioethics Committee of ASL n.1 Sassari, Prot n. 2078/ce), was in accordance with the Helsinki Declaration.
None of the participants had a history of neurological and/or psychiatric diseases. Experiments were carried out in a quiet room. Subjects sat in a comfortable chair with headrest and were asked to keep their eyes open and to stay relaxed but alert during data collection.
3.2.2 EMG recordings
Reflex responses were recorded from both OO, using 8-mm diameter Ag–AgCl surface cup electrodes, with the recording electrode placed over the lower lid, the reference electrode 2 cm away from the lateral cantus with the ground electrode over the forehead. EMG signals were amplified (x5000; D360 amplifier; Digitimer Ltd, Welwyn Garden City, UK), filtered (bandpass 50–5000 Hz), and sampled (10 kHz per channel in a window frame of 2500 ms) using a CED1401 power analog-to-digital converter (Cambridge Electronic Design, Cambridge, UK). The raw blink recordings were DC-corrected and rectified for off-line measurements.
EMG recordings from OO muscles started 2 s before each stimulus, to allow online rejection of trials with excessive activity. Data were stored on a personal computer and analyzed using Signal 5.02 software (Cambridge Electronic Design, UK).
3.2.3 Electrical stimulations
Electrical stimulation of the left SON was delivered at the supraorbital notch, using silver chloride disc surface electrodes (cathode over the homonymous foramen and anode two cm lateral) connected to a constant current stimulator (DS7A Stimulator, Digitimer, Welwyn Garden City, Herts, UK). Square-wave pulses (0.2-ms duration) were delivered to the SON at variable time intervals (between 20 and 40 s) to minimize habituation of the BR, and stimulus intensity was set at three times the R2 threshold (lowest intensity that evoked at least five R2 responses in 10 consecutive trials).
3.2.4 TNS
In light of the similar effects induced by SON and infraorbital nerve (ION) stimulation (DeGiorgio et al., 2006; Pop et al., 2011) and of the effectiveness of ION stimulation on the R2 component of the BR (Mercante et al., 2015), in the present study TNS was delivered to the ION through disposable, hypoallergenic, silver gel self-adhesive stimulating electrodes (30 mm diameter, SEI-EMG s.r.l. Cittadella, IT) with the cathode placed over the ION foramina and the anode 2 cm lateral, and connected to a Winner® stimulator (Fisioline biomedical instrumentation, Verduno, CN, IT).
The stimulation of the ION instead of the SON allowed the delivery of both TNS and BR stimuli (to the SON) without changing the electrode position during the experiment.
A TNS protocol, which proved to be able to inhibit the area of the R2 component of the BR (Mercante et al., 2015), was used. It consisted of asymmetric biphasic square-wave pulses (0.25-ms duration, 120 Hz) with an electrical mean equal to zero delivered in a cyclic modality (30-s ON and 30-s OFF) for 20 min, which was demonstrated to inhibit the R2 area (Mercante et al., 2015). In each subject, perceptual and pain thresholds were bilaterally calculated. Stimulation intensity corresponded, for each ION, to the maximal intensity endurable comfortably by the subject, always below the pain threshold (range 1–20 mA).
3.2.5 Experimental design
The study was composed of three experimental sessions. For those subjects who participated in more than one experiment, sessions took place at least 2 weeks apart.
3.2.6 Experiment 1: Aftereffects of bilateral real-TNS on BR
Twenty volunteers (12 females and 8 males; 29.0 ± 4.2 years old; range 21–37 years) participated in this experiment, which was aimed at evaluating the effect of 20-min bilateral TNS on the BR over a 45-min time period. The early ipsilateral
R1 and the late ipsilateral (iR2) and contralateral (cR2) R2 responses of the BR evoked by SON stimulation (Aramideh and Ongerboer de Visser, 2002) were assessed before, immediately after (T0), and at 15 (T15), 30 (T30), and 45 (T45) min following TNS. Ten BRs were collected at each time interval, and R1 and R2 areas were calculated. Three out of the 20 subjects who participated in this experiment (two females and 1 male; 31.3 ± 2.5 years old; range 28–34 years) underwent the same stimulation protocol with data collection at baseline, T0, T15, T30, 60 (T60), and 90 (T90) min after TNS.
3.2.7 Experiment 2: Effects of sham-TNS versus real-TNS on BR
The aim of experiment 2 was to verify whether the prolonged inhibition of the R2 component of the BR, observed following TNS administration (Mercante et al., 2015), could be due to a reflex habituation. Eleven participants (six females and five males; 26.1 ± 4.2 years old; range 20–33 years) underwent an ineffective 20-min bilateral TNS (sham-TNS). The sham-TNS protocol mimicked the initial bilateral real-TNS stimulus perception and consisted of a previous calculation of both perceptual and pain threshold, followed by 20 s of TNS, the intensity of which was subsequently gradually decreased down to zero, corresponding to the OFF position of the stimulator. The BR was assessed using the same experimental procedure and measurements as experiment 1. The R2 area after the shamTNS was calculated as a ratio of the R2 baseline area at each time point and compared with R2 ratios obtained after the real-TNS.
3.2.8 Experiment 3: Aftereffects of unilateral real-TNS on BR
In 12 subjects who participated in experiment 1 (seven females and five males; 30.4 ± 4.0 years old; range 21–37 years), the BR induced by the stimulation of the left and of the right SON was randomly recorded before and after unilateral TNS. Twenty BRs (10 BR per SON) were recorded in the same experimental session at baseline and at 0–45 min after TNS. Perceptual and pain thresholds were calculated for the left ION, and TNS was then applied at a sub-painful intensity for 20 min. The R2 areas obtained following left and right SON
stimulation were recorded before and after unilateral TNS to test effects on the R2 circuits ipsilateral and contralateral to the TNS stimulated ION. Effects of unilateral and bilateral TNS on the R2 ratios calculated following left SON stimulation were compared at each time point (T0–T45).
3.3 Statistics
Statistical analysis was performed with SPSS 18 software (SPSS Inc, Chicago, IL, USA). In the analysis performed with repeated measures analysis of variance (ANOVA), compound symmetry was evaluated testing the sphericity with the Mauchly’s test. The Greenhouse–Geisser correction was used to compensate for non-spherical data. A p value <0.05 was considered significant. Unless otherwise stated, values are expressed as mean ± standard deviation (SD) of the mean. In experiment 1, to analyze the effects of TNS within R1 and R2 components of BR, repeated measures ANOVA (RM-ANOVA) was performed separately on raw data for R1 and R2. For R1 analysis, one-way RM-ANOVA was performed with TIME (before, T0, T15, T30, and T45) as within-subject factor. Two-way RM-ANOVA with TIME (before, T0, T15, T30, and T45) and SIDE (iR2, cR2) as within-subject factors was performed to evaluate different effects of TNS on the ipsilateral and contralateral OO muscles. In case of no significant interaction SIDE*TIME, TNS effects were measured on iR2 and cR2 together. In case of significant values, Student’s paired t test was used for post hoc analysis applying the Bonferroni correction for multiple comparisons. In the three subjects, who underwent 90 min post-TNS recordings, a separate oneway RM-ANOVA with TIME (baseline, T0, T15, T30, T60, T90) on averaged iR2 and cR2 areas and on R1 area was performed.
In experiment 2, the effects of TNS on R2 ratio was tested performing RM-ANOVA with TIME (T0-T45) as within-subject factor and TREATMENT (real- vs. shamTNS) as between-subject factor. Planned post hoc Student’s independent sample t test with Bonferroni correction was used in case of significant values. In experiment 3, three-way RM-ANOVA with TIME (before, T0, T15, T30, and T45), SIDE (iR2, cR2), and NERVE (left and right SON) as within-subject factors
was performed to evaluate different effects of unilateral TNS on the ipsilateral and contralateral SON stimulation and iR2 and cR2 responses. In case of no significant interaction TIME*SIDE*NERVE, TNS effects on iR2 and cR2 after left and right SON were measured together. To test the different effect of unilateral and bilateral TNS on R2 ratio, RM-ANOVA with TIME (T0-T45) and TNS (bilateral vs. unilateral) as within-subject factors was performed. In case of significant values, Student’s paired t test was used for post hoc analysis applying the Bonferroni correction for multiple comparisons.
5.4 Results
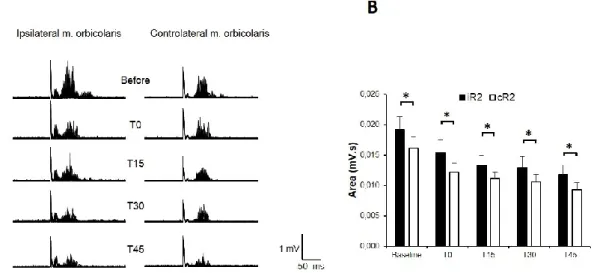
The electrical stimulation of the left SON evoked ipsilateral R1 and bilateral R2 responses in all 31 subjects tested (Fig. 1).
Fig. 1 Effects of transcutaneous trigeminal nerve stimulation (TNS) on the Blink Reflex recorded from the orbicularis oculi (OO) following electrical stimulation of the left supraorbital nerve (SON). A.EMG Recordings from a representative subject. In each trace of 10 single trials were superimposed. B. The histograms report mean R2 data collected from 20 subjects. Clear ipsilateral R1 and bilateral R2 responses were visible in the OO EMG after SON stimulation, with the ipsilateral R2 (iR2) significantly larger than the contralateral R2 (cR2) at any time-point tested. The figure reports the BR recorded before (baseline) and after real-TNS at zero (T0), 15 (T15), 30 (T30) and 45 (T45) minutes. In comparison to baseline, both iR2 and cR2 areas were significantly inhibited following TNS, while the R1 response was unaffected. Asterisks: p<0.05. Error bars represent mean ± standard error.
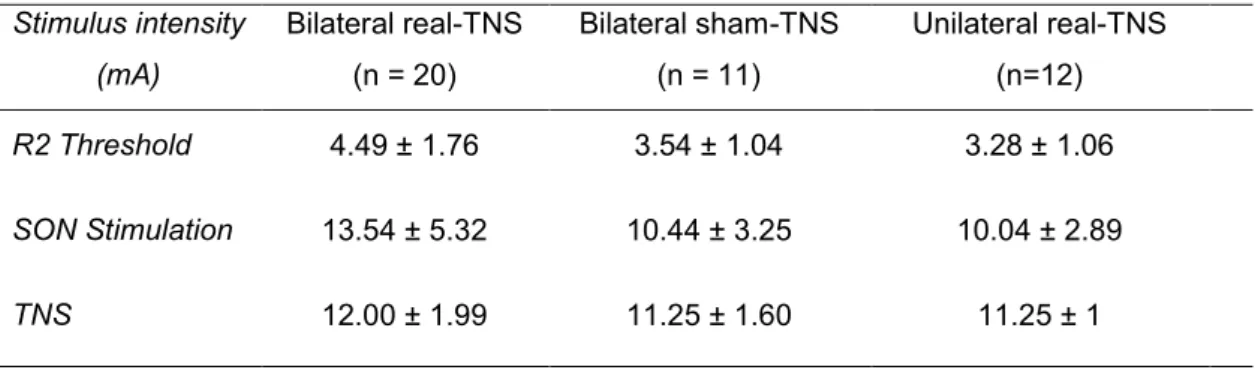
None experienced pain or side effects during and/or after the experimental procedures. Mean age of the participants as well as values of stimulus intensities used were not significantly different between the bilateral real-TNS, unilateral real-TNS, and bilateral sham-TNS groups (Table 1).
Table 1. Mean ± SD values of stimuli parameters in the bilateral real-TNS, bilateral
sham-TNS and unilateral real- sham-TNS groups.
Stimulus intensity (mA) Bilateral real-TNS (n = 20) Bilateral sham-TNS (n = 11) Unilateral real-TNS (n=12) R2 Threshold 4.49 ± 1.76 3.54 ± 1.04 3.28 ± 1.06 SON Stimulation 13.54 ± 5.32 10.44 ± 3.25 10.04 ± 2.89 TNS 12.00 ± 1.99 11.25 ± 1.60 11.25 ± 1
SON: supraorbital nerve; TNS: trigeminal nerve stimulation
3.4.1 Experiment 1: Aftereffects of bilateral real-TNS on BR
Two-way RM-ANOVA with TIME (before, T0, T15, T30, T45) and SIDE (iR2, cR2) showed a significant effect of TIME (p < 0.001) and SIDE (p = 0.008) on the R2 area but no interaction TIME*SIDE, being TNS effects on iR2 and cR2 not statistically different. The significant effect of SIDE is due to the well-known difference in amplitude between iR2 and cR2, with the former being larger than the latter (Peddireddy et al., 2006; Kofler et al., 2013). Student’s paired t test showed a significant difference in R2 areas with iR2 bigger than cR2 area at each time point tested (baseline: p = 0.042; T0: p = 0.005; T15: p = 0.034; T30: p = 0.031; T45: p = 0.008) (Fig. 1). As a result of the lack of interaction TIME*SIDE, averaged iR2 and cR2 areas were analyzed together by post hoc planned Student’s t test with Bonferroni correction. A significant inhibition of R2 area at T15 (p = 0.013), T30 (p = 0.002), and T45 (p = 0.001) was found after 20 min of TNS administration (Fig. 2).
Fig. 2 Time course of mean changes induced by real TNS intervention on the early and late components of the Blink Reflex. The graph reports mean data obtained from twenty subjects who underwent real-TNS administration. Time course of changes in the mean R1 (black line) and R2 (white line) areas from baseline to 0 min, 15 min, 30 min and 45 min after TNS are reported. iR2and cR2 areas were pooled. Asterisks: p<0.05. Error bars represent mean ± standard error.
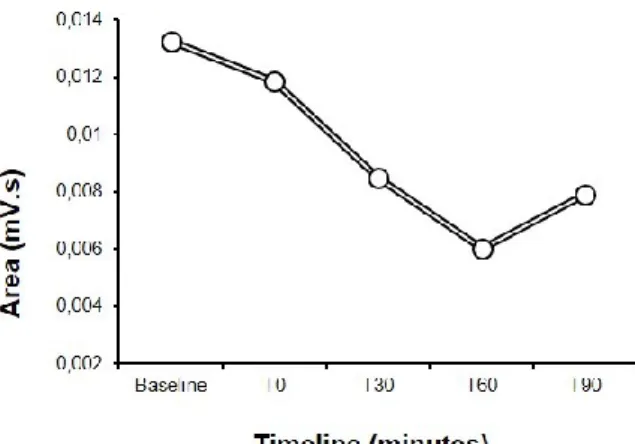
By contrast, the one-way RM-ANOVA showed that the R1 component of the BR was unaffected by TNS at any time point tested (Fig. 2). Three out of 20 subjects underwent baseline and 90-min recordings (T0, T15, T30, T60, and T90) after TNS delivery (Fig. 3). One-way RMANOVA was performed separately for R1 and R2 components.
Statistical analysis showed a significant effect of TIME (p = 0.001) on R2 areas recorded in six muscles (ipsi- and contralateral OO). One-way RM-ANOVA used to analyze R1 area over time in three muscles (ipsilateral response) was not statistically significant.
Fig. 3 Time course of TNS-induced inhibition of R2 area, over 90 minutes. The blink reflex was recorded from 3 subjects at baseline and after 0 (T0), 15 (T15), 30 (T30), 60 (T60) and 90 (T90) minutes after TNS administration. The graph shows a significant inhibition of R2 area after TNS lasting up to 90 minutes, with a tendency to recovery after 90 minutes.
3.4.2 Experiment 2: Effects of sham-TNS versus real-TNS on BR
RM-ANOVA with TIME (T0, T15, T30, and T45) as within-subject factor and TREATMENT (real- vs. shamTNS) as between-subject factor showed a significant interaction TIME*TREATMENT (p = 0.005). Independent sample Student’s t test showed a significant difference in R2 ratios at T30 (p = 0.012) and T45 (p = 0.002), while, although showing a trend, at T0 (p = 0.05) and T15 (p = 0.069), it was not statistically significant (Fig. 4).