CORSO DI DOTTORATO DI RICERCA IN SCIENZE BIOMEDICHE
Coordinatore del Corso: Prof. Andrea Fausto Piana
CURRICULUM IN SANITÀ PUBBLICA Responsabile di Curriculum: Prof. Andrea Fausto Piana
XXX CICLO
DIABETES AND MEDICAL DEVICES:
WHICH DEVICE FOR WHICH PATIENT
Coordinatore:
Prof. Andrea Fausto Piana Tutor:
Prof.ssa Maria Giuliana Solinas
Tesi di dottorato di: Dott.ssa Giulia Abis
Contents
Contents _____________________________________________________________ 1 List of Tables __________________________________________________________ 3 List of Figures _________________________________________________________ 4 Abstract ______________________________________________________________ 5 Acknowledgements ____________________________________________________ 7 Introduction __________________________________________________________ 8 1.1 Related literature _________________________________________________________ 9 Aim ________________________________________________________________ 11 2.1 Research planning ________________________________________________________ 11 2.2 Ethical Approval _________________________________________________________ 12 Tools and Methods ____________________________________________________ 13 3.1 Patients’ Lifestyle with Diabetes Insulin-treated (PLDI) Questionnaire ______________ 133.1.1 Pilot testing _____________________________________________________________________ 14
3.2 Statistical Analysis ________________________________________________________ 14
3.2.1 Exploratory Factor Analysis _________________________________________________________ 15 3.2.2 Confirmatory Factor Analysis _______________________________________________________ 19 3.2.3 Regression Analysis _______________________________________________________________ 24
Results ______________________________________________________________ 25 4.1 Pilot Study: PLDI questionnaire validation _____________________________________ 25 4.2 Final Study ______________________________________________________________ 26
4.2.1 The Sample _____________________________________________________________________ 26 4.2.2 Descriptive Analysis _______________________________________________________________ 27 4.2.3 EFA results ______________________________________________________________________ 38 4.2.4 CFA results ______________________________________________________________________ 42 4.2.5 Multiple linear regression results ____________________________________________________ 48
4.3 Patient’s Profile __________________________________________________________ 50 Conclusions __________________________________________________________ 52 Appendix A __________________________________________________________ 55
Giulia Abis, Diabetes and Medical Devices: which Device for which Patient
Tesi di Dottorato in Scienze Biomediche – Curriculum Sanità Pubblica, Università degli Studi di Sassari Appendix B __________________________________________________________ 57 Appendix C __________________________________________________________ 61 References ___________________________________________________________ 65
Giulia Abis, Diabetes and Medical Devices: which Device for which Patient
Tesi di Dottorato in Scienze Biomediche – Curriculum Sanità Pubblica, Università degli Studi di Sassari
List of Tables
Table 1. Fit statistics of the measurement model ... 23
Table 2. Descriptive results by Gender and Medical Device (MD) ... 26
Table 3. Distribution of the sample by Gender ... 27
Table 4. Relationship between gender and Medical Devices (MD) ... 28
Table 5. Relationship between type of diabetes and Medical Devices (MD) ... 28
Table 6. Modal values and corresponding frequencies of items for Perception of Health in patients by medical devices groups ... 29
Table 7. Modal values and corresponding frequencies of items for Satisfaction of Medical Device in patients by medical devices groups ... 30
Table 8. Modal values and corresponding frequencies of items about patient's lifestyle in patients by medical devices groups ... 34
Table 9. Percentage of patients with outliers values for clinical parameter ... 35
Table 10. Significant relationships between items of PLDI questionnaire and clinical variables and age ... 37
Table 11. Total variance explained by factors in EFA ... 39
Table 12. Communalities of observed variables in EFA ... 40
Table 13. Goodness of fit Indices of the model ... 40
Table 14. Rotated Factor Matrix of EFA ... 41
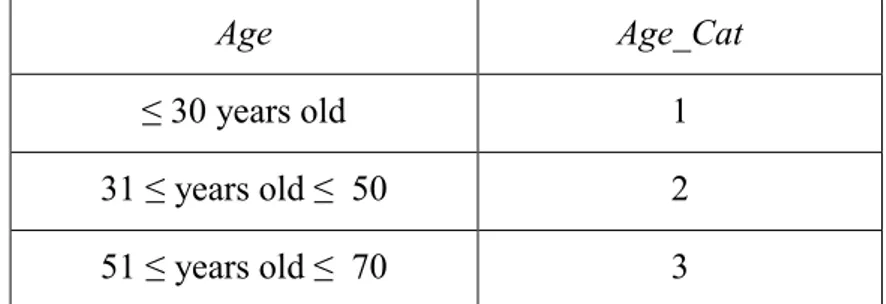
Table 15. Categorization of observed variable Age considered into CFA model ... 42
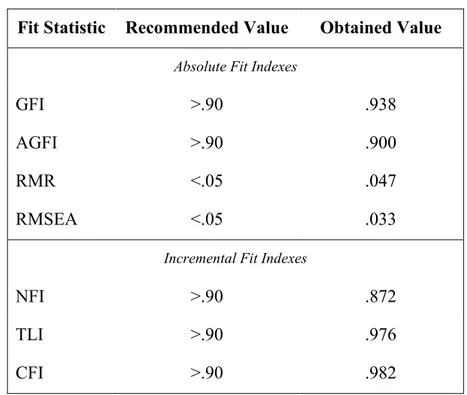
Table 16. Absolute fit indexes value obtained in CFA ... 44
Table 17. Correlations of factor model with standardized parameters ... 44
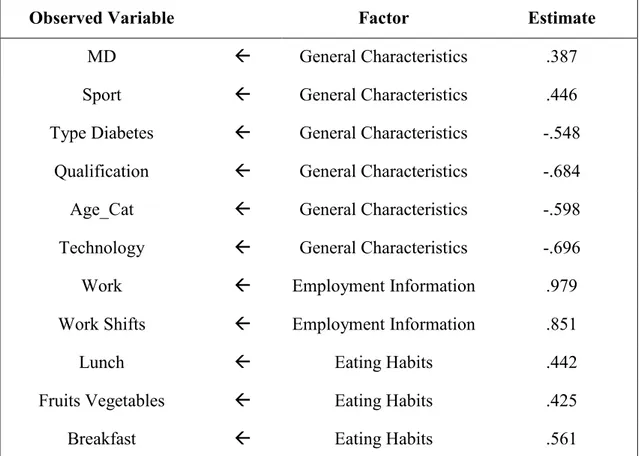
Table 18. Standardized Regression Weights ... 45
Table 19. Statistically significant regression weights and correlation ... 46
Table 20. ANOVA table: fit of regression models ... 49
Table 21. Coefficients and significant value of multiple linear regression models ... 49
Table 22. Profiles for MDI and CSII patients considering factor resulted by CFA with p-value in dark bold when p<.05 ... 51
Giulia Abis, Diabetes and Medical Devices: which Device for which Patient
Tesi di Dottorato in Scienze Biomediche – Curriculum Sanità Pubblica, Università degli Studi di Sassari
List of
Figures
Figure 1. Generic path diagram of CFA... 20
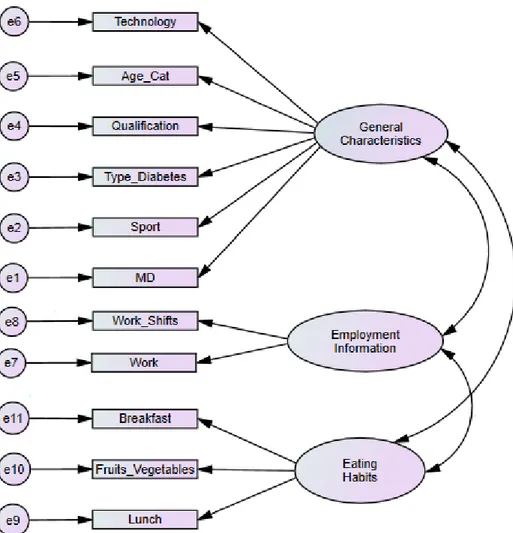
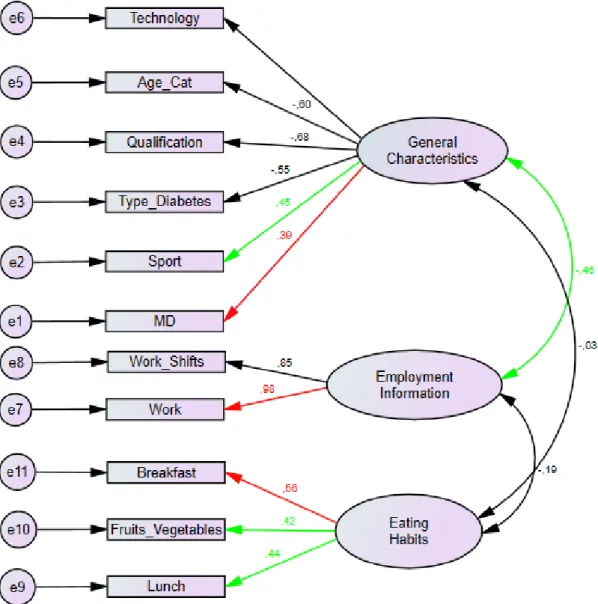
Figure 2. Path diagram based on EFA results ... 43
Figure 3. Path diagram with standardized parameters ... 46
Giulia Abis, Diabetes and Medical Devices: which Device for which Patient
Tesi di Dottorato in Scienze Biomediche – Curriculum Sanità Pubblica, Università degli Studi di Sassari
Abstract
Introduction
Diabetes care costs amount to 8% of all national healthcare expenditure referred to hospitalization (50.1%), outpatient services (17.4%), other drugs (21.3%), drugs for diabetes (6.9%) and medical devices (4.3%) (De Berardis, et al., 2012).
Insulin therapy is a pharmaceutical treatment option used to lower blood glucose in all patients with type 1 diabetes (T1D) and in a part of patients with type 2 diabetes (T2D). For insulin-treated patients blood glucose optimisation can be managed by different types of insulin that can be integrated in various medical devices technologies such as insulin pumps (Continuous Subcutaneous Insulin Infusion, CSII) and insulin pens (Multiple Daily Insulin Injection, MDI).
Aim
To draw the profile of patients in insulin therapy with insulin pumps and with multiple daily injections by identifying the variables that influence the use and the choice of two different medical devices.
Tools and Methods
We developed the PLDI questionnaire to rate clinical and physical characteristics of these patients, their way of life, their lifestyles in general. The Explorative Factor Analysis (EFA) was performed to define the profiles of insulin-treated patients with diabetes enrolled in our study and the Confirmatory Factor Analysis (CFA) was performed to validate the relationships between the factors that identify the profiles that are defined with the EFA. Regression Models were performed to estimate the effects of demographic variables, clinical data, lifestyles and behaviour on the choice of medical device and its cost.
Giulia Abis, Diabetes and Medical Devices: which Device for which Patient
Tesi di Dottorato in Scienze Biomediche – Curriculum Sanità Pubblica, Università degli Studi di Sassari Results
The whole PLDI questionnaire has a good internal items consistency (α=.85.
Thanks to EFA three factors were lastly extracted: “General Characteristics”, “Employment Information” and “Eating Habits” that were finally accepted and confirmed by CFA. General Characteristics and Eating Habits also resulted the independent variables highlighted in the regression models’ results.
Conclusions
The results provide supporting evidence that there are many, but not only clinical, characteristics of patients with diabetes useful to the appropriate choice of medical device for insulin treatment.
This study is not devoid of limitations and the main is based on the sample and its composition, which limits the generalizability of results. Therefore, next development is to make the results more generalizable in order that they can be used by policy makers in healthcare for a better management of resources and the best appropriateness of patients’ eligibility at the use of CSII technology.
Giulia Abis, Diabetes and Medical Devices: which Device for which Patient
Tesi di Dottorato in Scienze Biomediche – Curriculum Sanità Pubblica, Università degli Studi di Sassari
Acknowledgements
First, and foremost, I would like to express my sincere gratitude to my advisor Giuliana Solinas, for her immense knowledge, patience, continuous support and invaluable guidance throughout these years, as well as her immense goodness of mind. I could not have imagined having a better advisor and mentor for my Ph.D. studies. I am truly grateful to dr. Francesco Mastinu for his support defining the research planning, as well as all staff in the Department of Diabetology at the San Martino Hospital in Oristano.
I also want to thank Barbara Podda and Donatella Garau for the suggestions they provided on my research.
Finally, I gratefully acknowledge the Biomedical Department of the University of Sassari for everything I have accomplished with this path and what I can achieve.
Giulia Abis, Diabetes and Medical Devices: which Device for which Patient
Tesi di Dottorato in Scienze Biomediche – Curriculum Sanità Pubblica, Università degli Studi di Sassari
Introduction
Diabetes is a chronic disease that occurs either when the pancreas does not produce enough insulin or when the body cannot effectively use the insulin it produces. Insulin is a hormone that regulates blood sugar. During 2016, there are over 3 million 200 thousand people in Italy who claim to be suffering from diabetes, the 5.3% of the entire population (16.5% among the people of 65 years and beyond) (ISTAT, 2017). Diabetes care costs amount to 8% of all national healthcare expenditure referred to hospitalization (50.1%), outpatient services (17.4%), other drugs (21.3%), drugs for diabetes (6.9%) and medical devices (4.3%) (De Berardis, et al., 2012).
Insulin therapy is a pharmaceutical treatment option used to lower blood glucose in all patients with type 1 diabetes (T1D) and in a part of patients with type 2 diabetes (T2D) whose pancreas don’t produce enough amounts of the hormone insulin.
For insulin-treated patients blood glucose optimisation can be managed by different types of insulin that can be integrated in various medical device technologies such as insulin pumps (Continuous Subcutaneous Insulin Infusion, CSII) and insulin pens (Multiple Daily Insulin Injection, MDI). Both CSII and MDI are forms of intensified insulin treatment, but CSII mimics a physiological situation better (Jeitler, et al., 2008).
CSII technology was introduced in the 1970s to achieve normoglycaemia in people with type 1 diabetes mellitus (Pickup, et al., 1978). The first insulin pump had to be worn like a backpack, whereas nowadays a traditional CSII device includes: the pump and its controls, the processing module, the batteries, a disposable reservoir for insulin, a disposable infusion set, a cannula for subcutaneous insertion (under the skin) and a
Giulia Abis, Diabetes and Medical Devices: which Device for which Patient
Tesi di Dottorato in Scienze Biomediche – Curriculum Sanità Pubblica, Università degli Studi di Sassari tubing system to interface the insulin reservoir to the cannula. The pump delivers insulin in two ways:
a basal dose which is infused continuously to correct the basal rate;
the bolus doses which are infused “on-demand” to cover food eaten or to correct a high blood glucose level.
The main difference between CSII than MDI treatment is obviously the basal dose, that is not provided in MDI.
According to the third Italian survey, the number of patients with T1D and T2D that use CSII increased by 396% between 2005-2013 (Bruttomesso, et al., 2015). These values might keep increasing, and more work is needed to ensure uniform treatment strategies throughout the country. In fact, the spread of CSII resulted really uneven between Italian regions and even between different diabetes care centres of the same region.
1.1 Related literature
CSII is recommended as a possible treatment for patients who attempt to achieve target haemoglobin levels following high levels of HbA1c (8.5% or above) with MDI despite carefully managing their diabetes (NICE, 2008).
Candidates for CSII include patients with type 1 diabetes and patients with type 2 diabetes who are insulin dependent and have inadequate control with MDI.
CSII should only be used in patients who are motivated, knowledgeable in diabetes self-care, take insulin multiple times per day, assess blood glucose levels multiple times daily, are motivated to achieve tighter glycaemia control, are willing, intellectually and physically able to undergo the rigors of insulin pump therapy initiation and maintenance (AACE/ACE Diabetes Guidelines, 2015). The American Diabetes Association (ADA) annually publishes its standards of medical care for patients with diabetes: for glycaemia treatment it is recommended that individuals who have been successfully using CSII should have continued access after they turn 65 years old (American Diabetes Association, 2016).
Italian standards recommend the advice of expert panels who have the task of selecting candidate patients for the use of the insulin pumps. These patients must have
Giulia Abis, Diabetes and Medical Devices: which Device for which Patient
Tesi di Dottorato in Scienze Biomediche – Curriculum Sanità Pubblica, Università degli Studi di Sassari poor glycaemia control and/or recurrent hypoglycaemia despite an optimal basal-bolus regimen (level III strength, strength of recommendation B) (AMD-SID, 2014).
Furthermore, there is a lot of considerable research and tools designed to assess patient satisfaction, diabetes knowledge and diabetes QoL (Burroughs, et al., 2004; Eigenmann, et al., 2011; Paddock, et al., 2000).
Giulia Abis, Diabetes and Medical Devices: which Device for which Patient
Tesi di Dottorato in Scienze Biomediche – Curriculum Sanità Pubblica, Università degli Studi di Sassari
Aim
The aim of this study is to draw the profile of patients in insulin therapy with insulin pump (CSII) and with multiple daily injections (MDI) by identifying the variables that influence the use and the choice of two different medical devices. We rate clinical and physical characteristics of these patients, their way of life, the work they do and its organization, their qualifications, physical activity and other recreational interests practiced, their marital status, the parity of pregnancies and the number of children (only for women), their lifestyles, eating and behavioural habits.
2.1 Research planning
A cross-sectional study was planned and has involved people in insulin treatment using MDI and CSII for at least six months, residents in Sardinia during the period of study (since 2015) and being treated at diabetes centres in the same region.
The patients enrolled in the study are adult patient (≥18 years old). The date of birthwill be considered to calculate the age (years) of the enrolled patients.
The informed consents for the participants at the study are reported in Appendix A in Italian language.
Data collection includes patients’ clinical data and non-clinical data gathered by the structured questionnaire with a majority of closed questions.
The form of clinical data available only in Italian language is reported in Appendix B. A structured interview is used as a method of data collection proposed to each patient enrolled in the study. The interview is conducted by the same person. Although the interaction between interviewer and interviewee is face-to-face, enrolled patients don’t
Giulia Abis, Diabetes and Medical Devices: which Device for which Patient
Tesi di Dottorato in Scienze Biomediche – Curriculum Sanità Pubblica, Università degli Studi di Sassari take direct vision of the questionnaire; in this way the emotional independence of the answers to the questionnaire and the consequent absence of conditioning by previously reading of the whole text is ensured.
The final research is preceded by a pilot study designed, to reveal deficiency in the proposed structured questionnaire (to check the comprehensibility of the questions and the logical structure of the same, as well as to monitor the time of detection information) and to validate it.
A pilot study is understood as a pre-testing or ‘trying out’ for further epidemiological studies (Baker, 1994). It should be recognized that the pilot studies may have a number of limitations and as a chance to make inaccurate forecasts or assumptions related to the sample size. Although pilot study findings may offer some indication of the likely size of the response rate in the main survey, they cannot guarantee this because they don’t have a statistical foundation and are nearly always based on small numbers (Van Teijlingen & Hundley, 2001).
2.2 Ethical Approval
Before conducting the study, we requested the ethical approval from the Local Health Authority of Sassari’ Ethic Committee, Sardinia Region (Italy). We have obtained the ethical approval to conduct this research and to use documents reported in Appendix A, Appendix B, Appendix C1.
Giulia Abis, Diabetes and Medical Devices: which Device for which Patient
Tesi di Dottorato in Scienze Biomediche – Curriculum Sanità Pubblica, Università degli Studi di Sassari
Tools and Methods
3.1 Patients’ Lifestyle with Diabetes Insulin-treated (PLDI)
Questionnaire
Currently, for my knowledge, there are no recommended standards which enable to correlate patients’ lifestyle with insulin therapy and technology used. Because no tools are available to assess the choice of medical device for insulin treatment based on patients’ lifestyle, we developed a questionnaire to study the way of life of patients with diabetes in insulin-treatment. We call this tool Patients’ Lifestyle with Diabetes
Insulin-treated (PLDI) questionnaire.
The PLDI questionnaire was validated after the pilot study (see Appendix C) in Italian language and contains questions about perception of health, satisfaction of medical device and patient’s lifestyle. To make sure that the items of PLDI questionnaire were understandable, an expert panel of healthcare professionals reviewed the tool and all items.
Moreover, the PLDI questionnaire contains questions about medical device for insulin treatment used, the length of their use and general information of the patients with type 1 and type 2 diabetes. There are also demographic items providing information about professional activity, marital status, qualification, length of time since diagnosis of diabetes and for women also the number of pregnancies. There are in total 25 items.
Giulia Abis, Diabetes and Medical Devices: which Device for which Patient
Tesi di Dottorato in Scienze Biomediche – Curriculum Sanità Pubblica, Università degli Studi di Sassari For questions on the perception of health and some on the patient’s lifestyle (eating habits, sport, qualification, etc.) the ISTAT survey questionnaire multipurpose was considered (Istat, 2015).
The PLDI questionnaire is the same for patients with type 1 and type 2 diabetes. Every item is measured using Likert scale scores expressed in 5 dimensions from 1 to 5 with the assumption of ordinals from low risk to high risk.
3.1.1 Pilot testing
For the pilot test of the PLDI questionnaire, all detailed information of the study was provided to prospective participants and written consents were obtained. People with type 1 and type 2 diabetes were recruited from a Primary Health Care Centre of Sardinia (Italy) (see 4.2.1).
Health professionals of diabetes were asked to introduce the pilot study to patients with type 1 and type 2 diabetes and to request them if they would take part in the survey. The PLDI questionnaire was submitted under interview form to patients interested to participate and who had signed the informed consent. The PLDI questionnaire was performed, for each insulin-treated patient, by the same interviewer.
The interaction between interviewer and interviewee was face-to-face and patients enrolled in the study didn’t take direct vision of the questionnaire; in this way the emotional independence of the answers was ensured to the questionnaire and the consequent absence of conditioning by previously reading it too.
The internal consistency of the items of the PLDI questionnaire was assessed by Cronbach’s Alpha (α) index (Armitage & Colton, 1998) using STATA 14. The α value was calculated for the whole questionnaire. We performed also a descriptive analysis by medical device used, gender, age, qualification and marital status.
3.2 Statistical Analysis
The Explorative Factor Analysis (EFA) was performed to define the profiles of insulin-treated patients with diabetes enrolled in our study and the Confirmatory Factor Analysis (CFA) was performed to validate the relationships between the factors that identify the profiles that are defined with the EFA.
Giulia Abis, Diabetes and Medical Devices: which Device for which Patient
Tesi di Dottorato in Scienze Biomediche – Curriculum Sanità Pubblica, Università degli Studi di Sassari The Regression Models were performed to estimate the effects of demographic variables, clinical data, lifestyles and behaviour on costs related to medical devices. The EFA and the Regression Models were implemented in SPSS 24, while the CFA was ran with AMOS 24.
Univariate analyses preceded multivariate analyses. For the univariate analyses, descriptive statistics (mean, standard deviation, minimum and maximum values, frequencies) are calculated for quantitative and qualitative variables, respectively. 3.2.1 Exploratory Factor Analysis
Exploratory Factor Analysis (EFA) is a type of factor analysis, and the purpose is to identify the underlying dimensional structure of a set of measures summarizing data so that relationships and patterns can be easily interpreted and understood. So that, EFA tries to uncover complex patterns by exploring the dataset and testing predictions (Yong & Pearce, 2013). Factor analysis is useful for studies that involve a few or hundreds of variables, items from questionnaires, or a battery of tests (Rummel, 1970).
In EFA, measurable and observable variables can be reduced to fewer “latent variables” that share a common variance, are unobservable and non directly measured but are used to represent variables (Bartholomew, 1980). These variables are interdependent: there are no dependent or independent variables, but they are correlated.
For each factor or latent variable we define:
- factor loading, a measure of how much a observed variable contributes to the factor (the larger the factor loading the more the variable has contributed to that factor);
- factor score, the weights of each observed variable in producing a score representing each factor;
- eigenvalue, the sum of the squared factor loadings for a given factor;
- communality, the variance in the observed variables which are accounted for by a common factor (shows how much each variable can be predicted the extracted factors).
Giulia Abis, Diabetes and Medical Devices: which Device for which Patient
Tesi di Dottorato in Scienze Biomediche – Curriculum Sanità Pubblica, Università degli Studi di Sassari In the mathematical model, p denotes the number of variables (X1, X2,…, Xp) and
m defines the number of underlying factors (F1, F2,…,Fm). Xj is the variable represented
in latent factors. Thus, this model assumes that there are m underlying factors whereby each observed variables is a linear function of these factors together with a residual variant.
The factor loadings are aj1, aj2,…, ajm which denotes that aj1 is the factor loading of jth
variable on the 1st factor. The specific or unique factor is denoted by ej.
The communality is denoted by h2 and is the summation of the squared factor ladings:
The unique variance is denoted by u2 and is the proportion of the variance that excludes the common factor variance which is represented by the formula:
Thus, is the variance due by variable j.
If you know that unique variance is split into specific variance and error variance, the formula of the total variance is:
Factor loadings are very similar to weights in multiple regression analysis, and they represent the strength of the correlation between the variable and the factor. Factor analysis uses matrix algebra when computing its calculations. The basic statistic used in factor analysis is the correlation coefficient which determines the relationship between two variables. Generally, a factor analysis performed using a correlation matrix produces standardized data, thus it is recommended for variables that are not meaningfully comparable (e.g., items from different scales). On the other hand, factor analysis performed using a covariance matrix is conducted on variables that are similar (e.g., items from the same scales). The basic idea behind this model is that factor
Giulia Abis, Diabetes and Medical Devices: which Device for which Patient
Tesi di Dottorato in Scienze Biomediche – Curriculum Sanità Pubblica, Università degli Studi di Sassari analysis tries to look for no correlations between any pairs of Xi and Xj because the
factors themselves will account for the correlations. This means that all pairs of any two observed variables (Xi, Xj,…, Xp), are conditionally independent given the value of F1,
F2,…, Fm (Yong & Pearce, 2013).
The process of conducting an EFA involves three steps: 1. extraction and rotation;
2. evaluation goodness of the model; 3. interpretation of results.
1. Extraction refers to the process of determining how many factors best explain the observed covariation matrix within the data set. The best is the fewest number of factors that explains the largest amount of variation of the observed variables. There are many methods for conducting an exploratory factor analysis: principal components (PC) unweighted least squares (ULS), generalized least squares (GLS), maximum likelihood (ML), principal axes factoring (PAX), alpha factoring (AF) and image factoring (IF). Information on relative strengths and weaknesses of these techniques is scarce, often only available in obscure references. It is often hard to figure out which method a textbook or journal article author is describing, and whether or not it is actually available in the software package the researcher is using (Costello, 2005).
If data is relatively normally distributed, maximum likelihood is the best choice; if the assumption of multivariate normality is severely violated one of principal factoring methods is recommended (Costello, 2005).
Two methods to determine the appropriate number of factors to extract are the Kaiser’s Criterion and the Scree Test. The Kaiser’s Criterion suggests retaining all factors that are above the eigenvalue of 1 (Kaiser, 1960). In fact, because we are interested in explaining as much variance in observed indicators as possible, we can decide to retain only those latent variables with sufficiently high eigenvalues. Scree Test is based on scree plot and considers the number of factors above the point of inflexion, but is often hard to interpret and is subjective and open to different interpretations.
Factors are rotated for better interpretation. The goal of rotation is to attain an optimal simple structure which attempts to have each variable load on as few factors as possible, but maximizes the number of high loadings on each variable (Rummel, 1970). There are orthogonal and oblique rotation. Orthogonal rotation is when the factors are
Giulia Abis, Diabetes and Medical Devices: which Device for which Patient
Tesi di Dottorato in Scienze Biomediche – Curriculum Sanità Pubblica, Università degli Studi di Sassari rotated 90° from each other and it is assumed that the factors are uncorrelated, oblique rotation is when the factors are not rotated 90° from each other and it is assumed that the factors are correlated (Rummel, 1970). Two common orthogonal techniques are Quartimax and Varimax rotation: Quartimax involves the minimization of the number of factors needed to explain each variable, while Varimax minimizes the number of variables that have high loadings on each factor and works to make small loadings even smaller. The common oblique rotation techniques are Direct Oblimin and Promax. Direct Oblimin attempts to simplify the structure and the mathematics of the output, while Promax involves raising the loadings to a power of four which ultimately results in greater correlations among the factors and achieves a simple structure (Yong & Pearce, 2013). Conventional wisdom advises researchers to use orthogonal rotation because it produces interpretable results more easily (Costello, 2005).
So, if we decide that our factors should be correlated then we select an oblique solution, whereas if you decide that our factors should not be correlated then we select an orthogonal solution.
2. Among evaluation goodness of the model we consider Kaiser-Meyer-Olkin (KMO) test, Bartlett’s tests and Goodness-of-fit Test. KMO test is a measure of how suited your data is for factor analysis. The test measures sampling adequacy for each variable in the model and for the complete model. The statistic is a measure of the proportion of variance among variables that might be common variance. KMO returns values between 0 and 1. A rule of thumb for interpreting the statistic:
KMO values less than 0.6 indicate the sampling is not adequate and that remedial action should be taken;
KMO values between 0.6 and 0.69 are mediocre;
KMO values between 0.7 and 0.79 are middling;
KMO values between 0.8 and 1 indicate the sampling is adequate.
Bartlett’s test shows the homogeneity of variance: the null hypothesis is all the population variances (k populations being compared) are equal or the correlation matrix is an identity matrix. The alternative hypothesis is the population variances are not all equal. This means at least one is not equal to the others. The test does not explicitly determine which one is different, just that at least one is different.
The Goodness-of-fit Test determines if the sample data (correlations) is likely to arise from the correlated factors. In this situation we want the probability value of the
Chi-Giulia Abis, Diabetes and Medical Devices: which Device for which Patient
Tesi di Dottorato in Scienze Biomediche – Curriculum Sanità Pubblica, Università degli Studi di Sassari Square statistic to be greater than the chosen alpha (generally .05), or that is accepted the null hypothesis that the model fits the data.
3. The interpretation is naming the factors using our psychological knowledge to provide a meaningful understanding of the common feature among the relevant items.
Among requirements, to be labelled as a factor it should have at least 3 variables; a factor with 2 variables is only considered reliable when the variables are highly correlated with each other (r > .70) but fairly uncorrelated with other variables (Yong & Pearce, 2013). Generally, the correlation r must be .30 or greater to suggest a very weak relationship between the variables (Tabachnick & Fidell, 2007).
As a rule of thumb, a bare minimum of 10 observations per variable is necessary to avoid computational difficulties. Also, the theory states that the number of variables used in a study should be much greater than the number of extracted factors. Generally, it is considered a good over determination condition of factors when the proportion between observed used variables and extracted factors is 4-5 to 1 (Pannocchia & Giannini, 2007).
EFA can provide an infinitive number of possible solutions and the method of determining the appropriate number of factors to retain is very subjective. EFA is also a highly data-driven rather than a theory-driven method of investigation.
3.2.2 Confirmatory Factor Analysis
Confirmatory Factor Analysis (CFA) is a type of factor analysis, and the purpose is to test whether a dimensional structure is consistent with the structure obtained in a particular set of measures. In CFA, the researchers look for what they expect to find before doing the analysis and then seek to confirm this using the appropriate techniques (Stewart, 2001).
During CFA, the researchers use a hypothesized model that can be the result of a previously conducted analysis (i.e. EFA) or a priori built-in model based on knowledge of the studied phenomenon and the related literature. Both cases, CFA attempts to confirm hypotheses and represent variables and factors using path diagram. Often CFA results and their measurement model are used for testing a Structural Equation Model (SEM).
Giulia Abis, Diabetes and Medical Devices: which Device for which Patient
Tesi di Dottorato in Scienze Biomediche – Curriculum Sanità Pubblica, Università degli Studi di Sassari It is common to display confirmatory factor models as path diagrams. CFA uses distinct categories of variables that are termed in different ways. Observed variables are also named measured, indicator and manifest. Researchers and software traditionally use a square or rectangle to designate them graphically. Unobserved variables are also named latent factors, factors or constructs. Researchers and software traditionally use circles or ovals to designate them graphically. Figure 1 shows a generic path diagram where the unobserved or latent variables are represented as circles at the top and the observed variables are represented as rectangles in the middle.
The circles at the bottom are the unique factors or measurement errors in the variables. The unique factors differ from factors because their effect is associated with one only observed variables. Each unique factor effects only a single variable and incorporates the variance in each observable variable not captured by the latent factors, such as measurement error. The straight lines pointing from each factor to the observed variables indicates the causal effect of each latent variable on the observed variables: in factor analysis the researchers almost always assume that the latent variables “cause” the observed variables. The scores of the relationship between factors and observed variables are the factor loadings (see 3.2.1). The two-headed curved arrow between factors indicates that they are correlated.
CFA is theory-driven and it’s possible to place substantively meaningful constraints on the factor model, such as setting the effect of one latent variable to equal
Giulia Abis, Diabetes and Medical Devices: which Device for which Patient
Tesi di Dottorato in Scienze Biomediche – Curriculum Sanità Pubblica, Università degli Studi di Sassari zero on a subset of the observed variables. The advantage of CFA is that it allows to test hypotheses about a particular factor structure (Albright, 2006-2008).
The graphic representation is the hypothesized model that is to be tested to see how well it fits the observed data.
The confirmatory factor model can be summarized by the equation
in which is the vector of observed variables, is the matrix of loadings connecting each to the , is the vector of factors and is the vector of unique factors. It is assumed that the unique factors have a mean of zero (E( )=0), and that the factors and unique factors are uncorrelated (E( )=0). The equations of the model for Figure 1 can be written as:
First Factor Second Factor
The equations of the model are similar to regression analysis, but the primary difference between these factor equations and regression analysis is that are unobserved. The sample covariance matrix for can be decomposed as follows (when the variables are measured as deviations from their means):
where is the covariance matrix of the factors and is the covariance matrix of the unique factors (Bollen, 1989). Several different fitting functions exist to determine the closeness of the implied covariance matrix to the sample covariance matrix and maximum likelihood is among the most common.
The first step in CFA is determining whether the specified model is identified. In fact, if the model is unidentified it means that it is impossible to come up with unique
Giulia Abis, Diabetes and Medical Devices: which Device for which Patient
Tesi di Dottorato in Scienze Biomediche – Curriculum Sanità Pubblica, Università degli Studi di Sassari parameter estimates. That is when the factors model can make true for infinite number of values. In CFA, a model is identified if all of the unknown parameters can be rewritten in terms of the variances and covariances of the variables (Bollen, 1989). Without introducing some constraints any confirmatory factor model is not identified because the latent variables are unobserved and hence their scales are unknown. It therefore becomes necessary to set the metric of the latent variables in some manner; the two most common constraints are to set either the variance of the latent variables or one of their factor loadings to one.
The second step is to assess how well the model matches the observed data. About simple size, it is important because it relates to the stability of the parameter estimates, but there is no exact rule for the number of participants (Shreiber, et al., 2006). About handling of missing data, in general, pairwise deletion is not recommended and listwise deletion is problematic unless the missing data has proved to be missing at random (Shreiber, et al., 2006). The core of the second step, apart from representing the impact of one latent construct on another or the latent construct on the observable variables, is the examination of the coefficients of hypothesized relationships of whether the hypothesized model is a good fit to the observed variables (Shreiber, et al., 2006). The model adequacy is measured with the conventional overall test of fit, χ2 statistic, where the null hypothesis under test is that the model fits the data.
In reference to model fit, there are used numerous goodness-of-fit indicators to assess a model. Fit indexes can be classified into absolute and incremental fit indexes (Hu & Bentler, 1999) also known tests of relative fit. The absolute fit indexes assess how well a priori model reproduces the sample data. Examples of absolute fit indexes include the Goodness-of-Fit Index (GFI), the Adjusted Goodness-of-Fit Index (AGFI), the Root Mean Squared Residual (RMR) and the Root Mean Square Error of Approximation (RMSEA).
The incremental fit indexes measure the proportionate improvement in fit by comparing a target model with a more restricted, nested baseline model. Examples of incremental fit indexes are the Normal Fit Index (NFI), the Tucker-Lewis Index (TLI) and the Bentler’s Comparative Fit Index (CFI).
Fit indexes were designed to avoid some of the problems of sample size and distributional misspecification associated with the conventional overall test of fit (the χ2 statistic) in the evaluation of the model. However, this promising claim that fit indexes
Giulia Abis, Diabetes and Medical Devices: which Device for which Patient
Tesi di Dottorato in Scienze Biomediche – Curriculum Sanità Pubblica, Università degli Studi di Sassari would more unambiguously point to model adequacy as compared to the χ2 test has little empirical support (Hu & Bentler, 1999).
The pressing issue is the selection of the “rules of thumb” conventional cutoff criteria for given fit indexes used to evaluate model fit; researchers often question the adequacy of these conventional cutoff criteria due to lack of empirical evidence and compelling rationale for these rules of thumb. Many studies evaluated conventional cutoff criteria for fit indexes, but finally they should be considered only as rules of thumb. Table 1 reports a chart with the conventional cutoff criteria related fit indexes of the model (Shreiber, et al., 2006; Hu & Bentler, 1999). About conventional overall test of fit χ2 statistic in the evaluation of the model, so that the null hypothesis can be accepted, we hope to find a small, non-significant χ2 value for this test. So, failure to reject the null hypotheses is therefore a sign of a good model fit.
Fit Statistic Recommended Value
Absolute Fit Indexes
GFI >.90
AGFI >.90
RMR <.05
RMSEA <.05
Incremental Fit Indexes
NFI >.90
TLI >.90
CFI >.90
Giulia Abis, Diabetes and Medical Devices: which Device for which Patient
Tesi di Dottorato in Scienze Biomediche – Curriculum Sanità Pubblica, Università degli Studi di Sassari 3.2.3 Regression Analysis
Regression analysis is a set of techniques for estimating relationships between variables. It can be discriminated between simple linear regression and multiple linear
regression. The equation for the simple linear regression model is listed below, where is called the independent variable or predictor variable and is called the dependent variable or response variable.
Regarding quantities from the fit, is the intercept of the line and is the slope of the line that corresponds at regression coefficient. A value of the slope very close to zero indicates little to no relationship, large positive or negative values indicate large positive or negative relationships, respectively.
In multiple linear regression there are more variables. In this case instead of just a single scalar value , there is a vector for every data point .
The linear equation model for multiple linear regression model is:
Typically, we will use an analysis of variance (ANOVA) test to measure this. If the ANOVA test determines that the model explains a significant portion of the variability in the data, then we can consider testing each of the hypotheses and correcting for multiple comparisons.
Giulia Abis, Diabetes and Medical Devices: which Device for which Patient
Tesi di Dottorato in Scienze Biomediche – Curriculum Sanità Pubblica, Università degli Studi di Sassari
Results
4.1 Pilot Study: PLDI questionnaire validation
Thirty-three patients with diabetes of type 1 and 2 were randomly selected from the database of a Primary Health Care Centre of Sardinia (Italy). After validation, only 32 questionnaires were considered for statistical analysis because during PLDI questionnaire validation one item was modified. Therefore, 97% of demographic information of the 33 patients interviewed were considered.
A value of α=.85, calculated for the whole questionnaire, indicates a good internal items consistency.
Slightly more than half the respondents are female (55%), 7 (22%) use CSII and 25 (78%) use MDI (see Table 2).
Age of 32 respondents range from 21 to 70 years old with a mean of 52 years. Qualification ranges from a completed doctoral or university degree to no qualifications, with 50% having completed just a secondary school degree.
In examining respondents’ marital status, 16 (50%) are married and live with their spouse.
Examining respondents’ insulin treatment, the use of MD ranged from 6 months to 20 years and 87.5% are more than satisfied.
Giulia Abis, Diabetes and Medical Devices: which Device for which Patient
Tesi di Dottorato in Scienze Biomediche – Curriculum Sanità Pubblica, Università degli Studi di Sassari
| MD |
Gender | CSII MDI | Total
---+--- Female | 4 13 | 17 %r | 23.53 76.47 | 100.00 %c | 57.14 52.00 | 54.84 ---+--- Male | 3 12 | 15 %r | 21.43 78.57 | 100.00 %c | 42.86 48.00 | 45.16 ---+--- Total | 7 25 | 32 %r | 21.88 78.12 | 100.00 %c | 100.00 100.00 | 100.00
Table 2. Descriptive results by Gender and Medical Device (MD)
4.2 Final Study
4.2.1 The Sample
We used the database of Diabetes Centre of ASSL of Oristano as a sampling frame to obtain access to the population of interest. This population is composed by patients with diabetes in insulin therapy.
During the 2016, adult patients (age ≥18 years old) with diabetes in insulin treatment were 2402, of which 180 were using CSII technology.
We random selected a sample of 134 patients with diabetes in insulin therapy from this database. Of these insulin-treated patients, 19 use CSII technology and 115 use MDI one.
If we consider a subgroup of patients in insulin treatment born afterwards 01.01.1946, the number of patients from the database of Diabetes Centre of ASSL of Oristano is 1056, of which 160 patients use CSII technology. Calculating that the percentage of patients enrolled in the study is 12.7% of the total patients with diabetes and in insulin treatment, then 11.9% of which use CSII and 12.8% of which use MDI.
Six patients of the 134 interviewed were excluded from the study for different reasons:
1 was under the age of 18 years old;
1 had already been excluded during the validation of the PLDI questionnaire (see 4.1);
Giulia Abis, Diabetes and Medical Devices: which Device for which Patient
Tesi di Dottorato in Scienze Biomediche – Curriculum Sanità Pubblica, Università degli Studi di Sassari 2 were excluded because their diabetes were not categorized as type 1 or type 2, but
as other;
4 were excluded because they had been using the device for less than 6 months (see 2.1).
4.2.2 DescriptiveAnalysis
The sample was analysed by gender, age, type of diabetes, years by diagnoses of disease, type and years of using medical devices (MDI or CSII). The sample is made from 126 patients, 46% females (see Table 3) with the mean age of 54 ± 3 (years) and 54% males with the mean age of 50 ± 3 (years). The mean age of the whole sample is 52 ± 2 (years).
Gender | Freq. Percent | ---+---| Female | 58 46.03 | Male | 68 53.97 | ---+---| Total | 126 100.00 | ---+---|
Table 3. Distribution of the sample by Gender
Regarding the type of diabetes (1 or 2), 54% of the sample is represented by patients with T1D diabetes, of which mean year of diagnosis of disease is 22 ± 13 (years) and 46% of the sample is represented by patients with T2D diabetes, of which mean year of diagnosis of disease is 13 ± 8 (years). The mean year of diagnosis of disease in all patients is 18 ± 12 (years); for males is 19 ± 11 (years) while in females is 17 ± 13 (years).
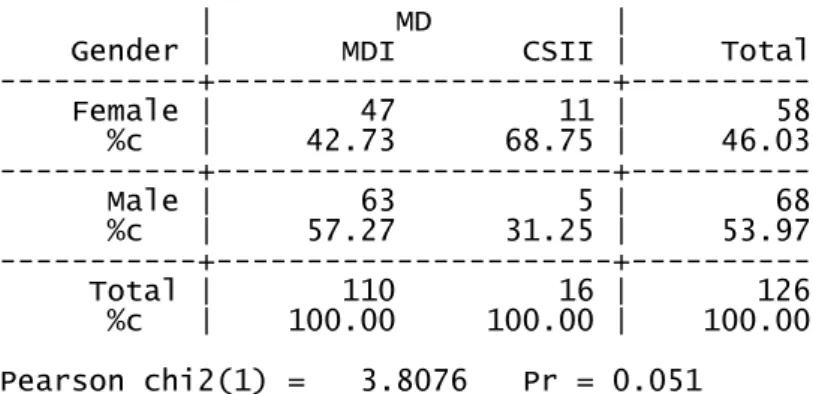
About medical devices, 110 (87.3%) patients use MDI technology of which 57.3% are male; 16 (13.7%) use insulin pump (CSII) of which 68.8% are female (see Table 4). Those who use MDI discovered their disease 18 ± 12 years ago (min 1, max 47), whereas who use CSII discovered the disease 21 ± 12 years ago (min 4, max 44).
The association between gender and medical device used although not statistically significant highlights a relationship (χ2=3.81, p=.051).
Giulia Abis, Diabetes and Medical Devices: which Device for which Patient
Tesi di Dottorato in Scienze Biomediche – Curriculum Sanità Pubblica, Università degli Studi di Sassari
| MD |
Gender | MDI CSII | Total ---+---+--- Female | 47 11 | 58 %c | 42.73 68.75 | 46.03 ---+---+--- Male | 63 5 | 68 %c | 57.27 31.25 | 53.97 ---+---+--- Total | 110 16 | 126 %c | 100.00 100.00 | 100.00 Pearson chi2(1) = 3.8076 Pr = 0.051
Table 4. Relationship between gender and Medical Devices (MD)
Of the sixteen patients that use CSII technology, 94% are affected by T1D diabetes (ten females and five males), while only 6% are patients with T2D diabetes (a female) (see Table 5). This is in according to international guidelines that recommend the use of CSII in people with T1D diabetes (ADA, 2014; NICE, 2010).
Type of | MD |
Diabetes | MDI CSII | Total ---+---+--- 1 | 53 15 | 68 %c | 48.18 93.75 | 53.97 ---+---+--- 2 | 57 1 | 58 %c | 51.82 6.25 | 46.03 ---+---+--- Total | 110 16 | 126 %c | 100.00 100.00 | 100.00 Fisher's exact = 0.001
Table 5. Relationship between type of diabetes and Medical Devices (MD)
The sixty-three men that use MDI have a mean age of 51 ± 13 (years) with a minimum age of 24 and a maximum age of 66. These men have been using MDI technology for a mean of 109 ± 81 months with a minimum value of 6 and a maximum of 360 months. The five men that use CSII have a mean age of 41 ± 23 (years) with a min of 21 and a max of 66. These men have been using CSII technology for a mean of 53 ± 46 months with a minimum of 12 and a maximum of 108 months.
The forty-seven women that use MDI have a mean age of 56 ± 11 (years) with a minimum age of 23 and a maximum age of 70. These women have been using MDI technology for a mean of 88 ± 85 months with a minimum of 6 and a maximum of 312 months. The eleven women that use CSII have a mean age of 48 ± 13 (years) with a minimum age of 27 and a maximum age of 64. These women have been using CSII
Giulia Abis, Diabetes and Medical Devices: which Device for which Patient
Tesi di Dottorato in Scienze Biomediche – Curriculum Sanità Pubblica, Università degli Studi di Sassari technology for a mean of 70 ± 44 months with a minimum of 12 and a maximum of 144 months.
The Skewness/Kurtosis test was performed to determine the normality of age by MD groups. The hypothesis of normality for age is rejected (p=0.0021) so, the Mann-Whitney U test was applied to compare age’s medians in each group and the result shows a not significant value (p=0.126).
The difference of proportions by MD groups was tested by Z test and the result showed a high significant z value (z=6.71, p<0.001).
As regards the PLDI questionnaire’s replies we calculated the frequency for each question and evaluated the relationships between them and the type of diabetes, medical devices and gender. We reported in Tables 6-8 the modal value of each item by each medical devices group and for the whole sample. The corresponding frequencies are reported in brackets.
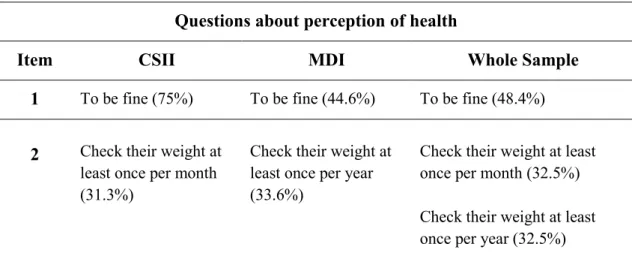
Regarding perception of health we had asked to patients how their health was, if they check their weight and how often (questions 1-2 respectively).
Questions about perception of health
Item CSII MDI Whole Sample
1 To be fine (75%) To be fine (44.6%) To be fine (48.4%) 2 Check their weight at
least once per month (31.3%)
Check their weight at least once per year (33.6%)
Check their weight at least once per month (32.5%) Check their weight at least once per year (32.5%)
Table 6. Modal values and corresponding frequencies of items for Perception of Health in patients by medical devices groups
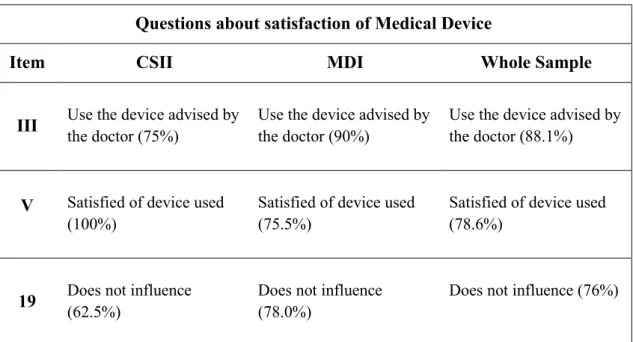
Regarding questions about satisfaction of medical device, we had asked patients which was the reason why they used this device, how satisfied they were to use it and how much the device influenced their couple’s life (questions III, V, 19 respectively).
Giulia Abis, Diabetes and Medical Devices: which Device for which Patient
Tesi di Dottorato in Scienze Biomediche – Curriculum Sanità Pubblica, Università degli Studi di Sassari Questions about satisfaction of Medical Device
Item CSII MDI Whole Sample
III Use the device advised by the doctor (75%) Use the device advised by the doctor (90%) Use the device advised by the doctor (88.1%)
V Satisfied of device used (100%)
Satisfied of device used (75.5%)
Satisfied of device used (78.6%)
19 Does not influence (62.5%) Does not influence (78.0%) Does not influence (76%) Table 7. Modal values and corresponding frequencies of items for Satisfaction of Medical Device in patients by medical devices groups
Regarding questions about patient’s lifestyle we had asked patients what their main meal was, if they had breakfast and what they ate, where they had lunch, how often they ate different kinds of foods, how often they drank different kinds of drinks, if they smoked, how often they did different kinds of activities, if they did sport, where and how often they did physical activity, the reasons why they didn’t do sport or physical activity, what their job was and how it was organized, and during free time what they preferred doing (questions 3-9, 12-18 respectively).
Questions about patient’s lifestyle
Item CSII MDI Whole Sample
3 The main meal is lunch (93.8%) The main meal is lunch (78.4%) The main meal is lunch (80.5%)
4 Eat and drink for breakfast
(43.8%)
Eat and drink for breakfast
(67.3%)
Eat and drink for breakfast
(64.3%)
5 Have lunch at home (93.8%)
Have lunch at home (94.6%)
Have lunch at home (94.4%)
Giulia Abis, Diabetes and Medical Devices: which Device for which Patient
Tesi di Dottorato in Scienze Biomediche – Curriculum Sanità Pubblica, Università degli Studi di Sassari 6 Eat carbohydrates more
times per day (43.8%) Eat carbohydrates one time per day (43.8%)
Eat carbohydrates more times per day (41.8%)
Eat carbohydrates more times per day (42.1%)
Eat cold cuts a few times per week (43.8%)
Eat cold cuts a few times per week (52.7%)
Eat cold cuts a few times per week (51.6%)
Eat meat few times per week (81.3%)
Eat meat few times per week (72.7%)
Eat meat few times per week (73.8%)
Don’t drink milk (31.3%) Drink milk once time per day (43.6%)
Drink milk once time per day (41.3%)
Eat dairy products few times per week (56.3%)
Eat dairy products few times per week (63.6%)
Eat dairy products few times per week (62.7%)
Eat eggs few times per week (68.8%)
Eat eggs few times per week (54.6%)
Eat eggs few times per week (56.4%)
Eat fish few times per week (75%)
Eat fish few times per week (50.9%)
Eat fish few times per week (54.0%)
Eat vegetables few times per day (62.5%)
Eat vegetables few times per day (52.7%)
Eat vegetables few times per day (54.0%)
Eat fruits few times per day (56.3%)
Eat fruits few times per day (66.4%)
Eat fruits few times per day (65.1%)
Eat legumes few times per week (81.3%)
Eat legumes few times per week (58.2%)
Eat legumes few times per week (61.1%)
Eat potatoes few times per week (56.3%)
Eat potatoes few times per week (65.5%)
Eat potatoes few times per week (64.3%)
Giulia Abis, Diabetes and Medical Devices: which Device for which Patient
Tesi di Dottorato in Scienze Biomediche – Curriculum Sanità Pubblica, Università degli Studi di Sassari Eat snacks less than once
a week (43.8%)
Eat snacks less than once a week (48.2%)
Eat snacks less than once a week (47.6%)
Eat desserts less than once a week (50%)
Eat desserts less than once a week (50.9%)
Eat desserts less than once a week (50.8%)
7 Drink water over one litre per day (68.8%)
Drink water over one litre per day (71.8%)
Drink water over one litre per day (71.4%)
Drink rarely sodas (56.3%)
Drink rarely sodas (50.9%)
Drink rarely sodas (51.6%)
Drink rarely beer (68.8%) Drink rarely beer (47.3%) Drink rarely beer (50%)
Don’t drink wine (50%) Don’t drink wine (40.9%) Don’t drink wine (42.1%)
Don’t drink other spirits (62.5%)
Don’t drink other spirits (70%)
Don’t drink other spirits (69.1%)
Drink two/three coffees per day (25%) and use sweetener (46.2%)
Drink three coffees per day (23.8%) and use sweetener (58.9%)
Drink three coffees per day (24.0%) and use sweetener (57.3%)
8 Ex-smokers (68.8%) Ex-smokers (40%) Ex-smokers (43.7%)
9 Listen to the radio every day (81.3%)
Listen to the radio every day (43.6%)
Listen to the radio every day (48.4%)
Watch TV every day (87.5%)
Watch TV every day (92.7%)
Watch TV every day (92.1%)
Watch DVDs and VDTs few times per year (56.3%)
Don’t watch DVDs and VDTs (46.4%)
Watch DVDs and VDTs few times per year (45.2%)
Giulia Abis, Diabetes and Medical Devices: which Device for which Patient
Tesi di Dottorato in Scienze Biomediche – Curriculum Sanità Pubblica, Università degli Studi di Sassari Don’t play videogames
(56.3%)
Don’t play videogames (81.8%)
Don’t play videogames (78.6%)
Browse the internet every day (75%)
Browse the internet every day (43.6%)
Browse the internet every day (47.8%)
Use PC every day (43.8%)
Don’t use PC (53.6%) Don’t use PC (49.2%)
Use smartphone every day (93.8%)
Use smartphone every day (83.6%)
Use smartphone every day (84.9%)
Read every day (56.3%) Read every day (41.8%) Read every day (43.7%)
Go to the theatre or cinema few times per year (75%)
Don’t go to the theatre or cinema (56.4%)
Don’t go to the theatre or cinema (52.4%) Don’t participate in recreational activity (68.8%) Don’t participate in recreational activity (66.4%) Don’t participate in recreational activity (66.7%)
Do food shopping more times a week (50%)
Do food shopping more times a week (33.9%)
Do food shopping more times a week (36%)
Take a walk every day (43.8%)
Take a walk every day (36.4%)
Take a walk every day (37.3%)
Don’t use public transport (87.5%)
Don’t use public transport (87.3%)
Don’t use public transport (87.3%)
12 Don’t do any sports (68.8%)
Don’t do any sports (82.7%)
Don’t do any sports (81%)
Giulia Abis, Diabetes and Medical Devices: which Device for which Patient
Tesi di Dottorato in Scienze Biomediche – Curriculum Sanità Pubblica, Università degli Studi di Sassari 13 Don’t do any physical
activity (43.8%)
Don’t do any physical activity (52.7%)
Don’t do any physical activity (51.6%)
14 Don’t do any sport neither physical activity (37.5%)
Don’t do any sport neither physical activity (43.6%)
Don’t do any sport neither physical activity (42.9%)
15 Don’t do much sport or physical activity due to the health (31.3%)
Don’t do much sport or physical activity due to the job (30%)
Don’t do much sport or physical activity due to the job (28.6%)
16 Don’t work (37.5%) Have a subordinate work (37.5%)
Don’t work (52.7%) Don’t work (50.8%)
17 Have all week the same shifts (31.3%)
Decide how to organize work shifts themselves (25.5%)
Decide how to organize work shifts themselves (25.4%)
18 During free time prefer to take a walk (56.3%)
During free time prefer to take a walk (30%)
During free time prefer to take a walk (33.3%)
Table 8. Modal values and corresponding frequencies of items aboutpatient's lifestyle in patients by medical devices groups
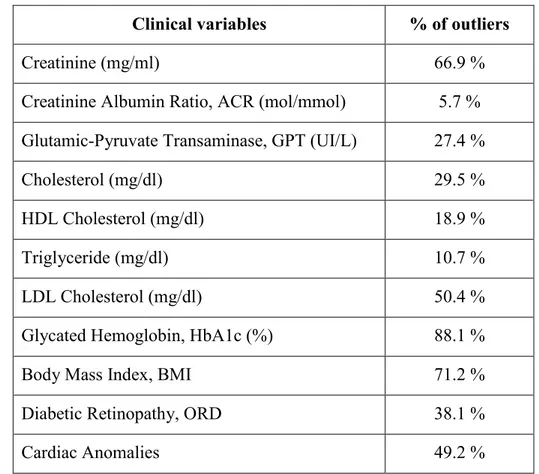
In Table 9, as regards clinical parameters, the percentages of outliers patients from standard values for blood tests of Laboratory of ASSL Oristano are reported.
The relationship between categorized BMI (0=normalweight; 1=over/underweight) and medical device is statistically significant (χ2 =4.0216; p <.05). The relationships between gender and the following categorized variables (0=normal; 1=outlier standard values) creatinine, HDL cholesterol, triglyceride, are statistically significant (p<.05). Also, the relationships between the type of diabetes and the categorized variables (0=normal; 1=outlier standard values) ACR, triglyceride, BMI, cardiac anomalies are highly statistical significant (p<.001).
Giulia Abis, Diabetes and Medical Devices: which Device for which Patient
Tesi di Dottorato in Scienze Biomediche – Curriculum Sanità Pubblica, Università degli Studi di Sassari Finally, the relationships between the age of patients and the categorized variables (0=normal; 1=outlier standard values) ORD, BMI, cardiac anomalies, are statistical significant (p<.005).
Also, 47.2% take cholesterol medications, 29.4% take anticoagulants drugs, 43.7% are treated with hypertension drugs and 52% take other drugs.
The relationship between the type of diabetes and the assumption of anticoagulants, hypertension and other drugs are statistically significant (p<.05).
The relationships between age of patients and the assumption of drugs is resulted highly statistical significant (p< .001).
The relationship between the type of diabetes and the assumption of anticoagulants drugs is statistically significant (p<.05).
Clinical variables % of outliers
Creatinine (mg/ml) 66.9 %
Creatinine Albumin Ratio, ACR (mol/mmol) 5.7 % Glutamic-Pyruvate Transaminase, GPT (UI/L) 27.4 %
Cholesterol (mg/dl) 29.5 %
HDL Cholesterol (mg/dl) 18.9 %
Triglyceride (mg/dl) 10.7 %
LDL Cholesterol (mg/dl) 50.4 %
Glycated Hemoglobin, HbA1c (%) 88.1 %
Body Mass Index, BMI 71.2 %
Diabetic Retinopathy, ORD 38.1 %
Cardiac Anomalies 49.2 %
Table 9. Percentage of patients with outliers values for clinical parameter
Furthermore, we analysed the relationships between the items of the PLDI questionnaire, clinical variables and age. In Table 10 only the statistical significant relationships at significant level 0.05 are shown.
Giulia Abis, Diabetes and Medical Devices: which Device for which Patient
Tesi di Dottorato in Scienze Biomediche – Curriculum Sanità Pubblica, Università degli Studi di Sassari Item of PLDI
questionnaire Clinical Variable
1
ACR
Triglyceride BMI
Take other drugs 6 – eat
carbohydrates Cardiac anomalies 6 – eat
cured meat
ACR
Take cholesterol medications Take antihypertensive drugs 6 – eat meat Creatinine
HbA1c 6 – drink milk HDL BMI 6 – eat dairy product Triglyceride
Take cholesterol medications Take antihypertensive drugs Take other drugs
ORD
Cardiac anomalies 6 – eat vegetables GPT
6 – eat snacks Take cholesterol medications BMI
6 – eat desserts
Take antihypertensive drugs ORD
BMI 7 – drink water GPT
Giulia Abis, Diabetes and Medical Devices: which Device for which Patient
Tesi di Dottorato in Scienze Biomediche – Curriculum Sanità Pubblica, Università degli Studi di Sassari Item of PLDI
questionnaire Clinical Variable
7 – drink beer
ACR
Take cholesterol medications Take anticoagulant drugs Take antihypertensive drugs Take other drugs
Cardiac anomalies BMI
7 – drink wine
ACR
Take cholesterol medications Take anticoagulant drugs Take antihypertensive drugs
7 – drink other spirits
Take cholesterol medications Take antihypertensive drugs BMI
8
Take cholesterol medications Take antihypertensive drugs Take other drugs
BMI
Cardiac anomalies Age
Giulia Abis, Diabetes and Medical Devices: which Device for which Patient
Tesi di Dottorato in Scienze Biomediche – Curriculum Sanità Pubblica, Università degli Studi di Sassari 4.2.3 EFA results
We conducted an Exploratory Factor Analysis (EFA) of the questionnaire responses and demographic information (age, MD and type of diabetes) to further understand and identify characteristics of people with T1D and T2D in insulin treatment. The number of cases used in the EFA analysis was 125 because, by default, SPSS does a listwise deletion of incomplete cases.
The observable variables used for the analysis were 12: Age (years), MD, Type of
Diabetes, Breakfast, Lunch, Fruits Vegetables, Technology, Qualification, Sport, Physical Activity, Work and Work Shifts. We respected the rule of thumb of 10
observations per variable (Pannocchia & Giannini, 2007). The other variables of the questionnaire had been progressively excluded to get the best model that fits the data.
The mean Age of respondents was 52 ± 13. MD is 0 for MDI technology and 1 for CSII technology. Responses in the Likert scale was based on five points ranging from low risk to high risk. Variable Sport reported 0 for answer “don’t sport” (Likert scale points 4, 5) and 1 for answer “do sport” (Likert scale points 1, 2, 3). For variables Fruits
Vegetables and Technology we did the average of the questionnaire questions indicated
for each respondents. Each of the 12 observed variables received equal weight. Three major sequential steps were undertaken for EFA.
Step 1 involved identifying the number of meaningful factors to retain based on Kaiser’s Criterion (eigenvalue >1) and the percentage of common variance accounted for by a given factor. We used maximum likelihood extraction’s method because we have assumed that the measured variables are the best representative of the measurable variables of the population that is the results are extendable to population. We involved a varimax (orthogonal) rotation on the retained factors because it minimizes the number of variables that have high loadings on each factor and works to make small loadings even smaller. Furthermore, varimax rotation was applied because a correlation between factors had previously been hypothesized, but it hadn’t been supported by oblimin rotation.The factors were selected if their eigenvalue was > 1, as is the Kaiser’s criterion.
As showed in Table 11, a four-factor solution was supported by the 62% percentage of variance accounted. The first factor accounted for 27% of the variance and the second, the third and the fourth factor accounted for an additional 14%, 12%,