Spatial bias analysis for the Weather
Research and Forecasting model
(WRF) over the Apulia region
F. Fedele 1,2,*, A. Pollice3, A. Guarnieri CalòCarduccci1, R. Bellotti2,4
1 Apulia Region Environmental Protection Agency (ARPA Puglia), Corso Trieste 27, IT-70126 Bari, Italy; [email protected], [email protected]
2 Dipartimento di Fisica, Università degli Studi di Bari, via Orabona, 4- IT-70125 Bari, Italy;
3 Dipartimento di Scienze Economiche e Metodi Matematici, Università degli Studi di Bari, Largo Abbazia S. Scolastica, 53 - IT-70124 Bari, Italy; [email protected]
4 Istituto Nazionale di Fisica Nucleare, Via Orabona 4, IT-70125 Bari, Italy; [email protected]
∗Corresponding author
Abstract. The Weather Research and Forecasting model (WRF) based on CORINE land-cover
database has been used to simulate 10m wind speed and 2m temperature over the Apulia region. A validation procedure against ground data from 48 monitoring stations for both a winter and a summer period inform on the spatial distribution of the model bias. A preliminary analysis based on three indices of model performance revealed that the summer period is better simulated than the winter one. Computation of Moran's index for the spatial distribution of the model bias shows that the summer 10m wind speed bias results to be weakly autocorrelated while this autocorrelation is absent for both winter and summer 2m temperature as well as for winter 10m wind speed. On the other hand, semivariogram analysis shows a slight correlation with a range value less than 2000m for 2m temperature's winter and summer biases.
Keywords. Spatial Bias; Numerical Weather Prediction Model; CORINEland cover
1
Introduction
Among Numerical Weather Prediction models a distinction is made between Global models, which usually have a coarse resolution and do not allow to simulate small scale features, and mesoscale models which cover only a small part of the planet but with a higher resolution. WRF is an example of mesoscale models [1]. Some atmospheric processes occur at spatial and temporal scales not resolved even for these high-resolution models and are represented by some physical parameterizations based on several approximations. This aspect, together with the uncertainties of the initial and boundary conditions provided by Global models, leads to the introduction of a bias in the model outputs [2, 3]. Many studies have been carried out to demonstrate the existence of a bias for 10m wind speed and 2m temperature, for several physical parameterizations. In the present study WRF model simulations for a summer and a winter period (January 2013 and July 2013) are validated against data from a set of ground stations quite
uniformly distributed over the Apulia region area. The aim of the analysis is to study the spatial pattern of the 10m wind speed and 2m temperature biases for WRF simulations.
F. Fedele et al. Spatial bias analysis over Apulia region
2
GRASPA 2015 Workshop
1
Materials and methods
In the present study, simulations have been performed with the WRF model [1], developed in a cooperative effort coordinated by the National Center for Atmospheric Research (NCAR). It is a state-of-the-art numerical weather prediction system that solves the fully compressible, non-hydrostatic Euler equations forming a system of partial differential equations used to simulate the dynamic of atmospheric processes. This system is solved on different vertical and horizontal levels of the simulation domain. Below a certain vertical level, within the Planetary Boundary Layer (PBL), many processes are characterized by a space-time resolution finer than that reachable by the model and therefore these processes are described by some parametrizations. For the simulations discussed in the present paper, the model has been implemented in a one-way nesting configuration, using the MYJ parametrization of the PBL [4]. The simulation domain has 108x108 grid points and a 16 km resolution covering the central Mediterranean. The model is forced with the 3-hourly Global Forecast System (GFS) forecasts, taken as initial and boundary conditions.
The default WRF setup includes the land cover database developed and distributed from the U.S. Geological Survey (USGS) LandCover Institute (LCI) [5], which is made of 24 land cover classifications with horizontal resolution down to 1 km (last update in 2000). The model setup implemented in the present study is based on the CORINE land cover database [6] which is characterized by higher resolution and more updated categories. CORINE has been produced by the European Environmental Agency for the 28 Member States and other European countries and includes 44 land cover classifications with a resolution down to 250 meters (last update in 2006).
Simulations of the hourly data for 2m temperature and 10m wind speed during a summer (July 2013) and a winter (January 2013) period have been performed and model outcomes have been validated against ground data from a set of meteorological monitoring stations. The validation database is provided by the Agrometeorological Service of the Apulia Region (ASSOCODIPUGLIA). The total number of available stations endowed with the set of sensors we are interested in is 58. The application of standard exploratory data analysis for the year 2013 has revealed that only 48 stations show reliable trends for the selected meteorological parameters thus meeting the requirements for the further analysis.
2
Results
A preliminary evaluation of the overall model performance was done by means of root mean squared errors (RMSE’s), correlation coefficients and bias standard deviations resulting from the comparison of the simulated 10m wind speed and 2m temperature databases with the ground data at each monitoring station. All these values are simultaneously reported in the Taylor diagrams of Figure 1. It is evident that the best performance of the model is obtained for July 2m (black dots) temperatures. Even if the wind speed performances are quite similar, a better performance is obtained for July (black dots) measures in terms of RMSE's for most of the stations.
Figure 1: (left) 10m wind speed Taylor Diagram for July 2013 (black dots) and January 2013 (blue dots). (right) 2m temperature Taylor Diagram for July 2013 (black dots) and January 2013 (blue dots). Each dot represents a monitoring station.
F. Fedele et al. Spatial bias analysis over Apulia region
3
GRASPA 2015 Workshop
To gain a further insight on the spatial behavior of model prediction, the mean model bias (MB) for each station is calculated and its spatial distribution has been analyzed. At the i-th station MB is defined as MB = ∑ − where and respectively represent the t-th observed value and the corresponding simulated value at the nearest grid point and T is the total number of pairs.
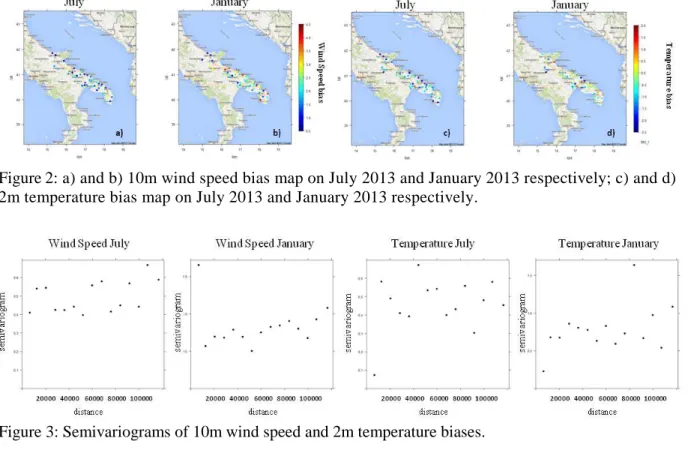
A first check of the WRF MB spatial distribution over the Apulia region is obtained by maps in Figure 2, including MB’s for the summer and winter period and for both selected meteorological parameters. As regards 10m wind speed bias, it can be noted that the summer period is the one with lower MB’s, while the winter period results to be the one with the lower MB’s for 2m temperature. In the case of wind speed summer MB a poor spatial variability is observed, while the other three mean biases show a higher degree of spatial heterogeneity.
To measure the spatial autocorrelation of these biases, two approaches have been used: the visual inspection of the semivariogram and Moran’s I hypothesis testing [7]. In Figure 3 the semivariogram of 2m temperature and 10m wind speed biases for both periods are reported. As can be noticed, 10m wind speed bias doesn't show evidence of spatial autocorrelation, however a weak spatial trend is present in both periods. As regards 2m temperature's bias, a slight spatial correlation is observed with a range value less than 20 Km.
Moran's index I gives an alternative measure of the global spatial autocorrelation for continuous data, based on the definition of a spatial neighborhood leading to a spatial weight matrix. Moran’s index lends itself to the calculation of Z-scores and relative p-values to test for presence of spatial autocorrelation.
Figure 2: a) and b) 10m wind speed bias map on July 2013 and January 2013 respectively; c) and d) 2m temperature bias map on July 2013 and January 2013 respectively.
Figure 3: Semivariograms of 10m wind speed and 2m temperature biases.
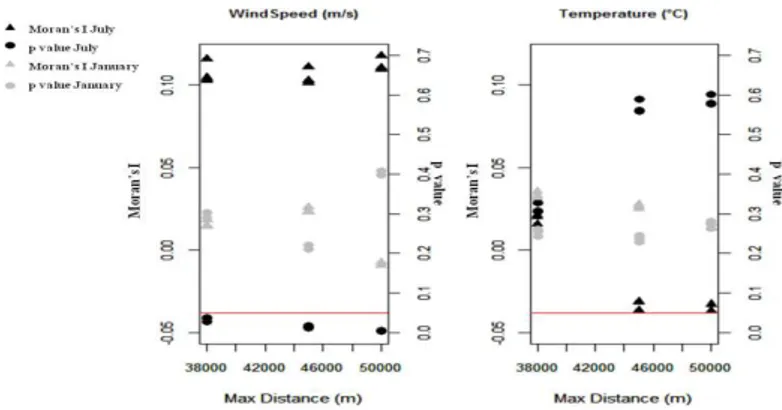
Moran's I index was calculated for nine alternative definitions of the distance weight matrix obtained combining maximum and minimum distance bounds, respectively 38000 m, 45000 m, 50000 m and 6000 m, 8000 m, 10000 m. The lowest minimum distance is approximately equal to the minimum distance between stations, the lowest maximum distance is the one for which the number of neighbors is different from zero for all stations, the upper maximum distance is the distance distribution's mode. In Figure 4 the different Moran's I values and the corresponding p-values are reported for all the weight matrixes. It is evident that the different specifications lead to similar results and the only case in which Moran's I value is significantly different from zero, though with quite a low value slightly above 0.1, is the one relative to the 10m wind speed bias for July period. This outcome implies that the spatial
F. Fedele et al. Spatial bias analysis over Apulia region
4
GRASPA 2015 Workshop
patterning of this variable shows a slightly positive global spatial autocorrelation.
In conclusion, the WRF setup results to be effective giving results which are independent from the validation point as bias analysis doesn't show strong evidence of spatial autocorrelation. Moreover, as shown in Taylor diagrams, there is a better agreement between ground observations and WRF July outputs than January ones. The highest correlation is obtained for July 2m temperature.
Figure 4: Moran's I and p-values for different distance matrixes for 10m wind speed bias (left) and 2m temperatures bias (right). Black marks are for July and grey marks for January. Triangles represent Moran test outcomes for each maximum distance (along x axis) and for each minimum distance and circles represent the associated p values. Red line marks the threshold of 0.05 for p value.
Acknowledgments. Authors gratefully acknowledge the Regional Association of Consortiums for the Protection of Apulia (Assocodipuglia) for making data available. The computational work has been executed on the IT resources made available by ReCaS, a project financed by the MIUR (Italian Ministry for Education, University and Research) in the "PON Ricerca e Competitività 20072013 -Azione I - Interventi di rafforzamento strutturale" PONa3_00052, Avviso 254/Ric.
References
[1] Skamarock,W.C., Klemp, J.B., Dudhia, J., Gill, D.O., Barker, D.M., Duda, M., Huang, X.-Y., Wang, W., Powers, J.G. (2008). A description of the advanced research WRF Version 3. NCAR Technical Note NCAR/TN–475 + STR.
[2] Liu, Y., Warner, T., Wu, W., Roux, G., Cheng, W., Chen, F., Delle Monache, L., Mahoney, W., Swerdlin, S. (2009). A versatile WRF and MM5-based weather analysis and forecasting system for supporting wind energy prediction. In: 23rd WAF/19thNWPConference, AMS, Omaha, NE. 1–5 June 2009, Paper 17B.3 [3] Coleman, R.F., Drake, J.F., McAtee, M.D., Belsma, L.O. (2010). Anthropogenic moisture effects on WRF summertime surface temperature and mixing ratio forecast skill in Southern California. Weather Forecast 25:1522–1535.
[4] Janjic, Z. I. (2002). Nonsingular Implementation of the Mellor–Yamada level 2.5 scheme in the CEP Meso model. NCEP Office Note 437, 61 pp.
[5] Anderson, J.R., Hardy, E.E., Roach, J.T., Witmer, R.E., 1976. A land use and landcover classification system for use with remote sensor data. U.S. Geological Survey Professional Paper 964.
[6] European Environmental Agency (EEA), 2000. CORINE Land Cover (1:100000), NATure/ LANd Cover information package. http://natlan.eea.eu.int.
[7] Bivand, R.S., Pebesma, E., Gómez-Rubio, V., 2013 Applied Spatial Data Analysis with R UseR! Series, Springer 2nd ed. 2013, ISBN: 978-1-4614-7617-7.