Department of Physiology and Pharmacology “V. Erspamer”
Ph.D. in Clinical-Experimental Neuroscience and Psychiatry
- XXX Cycle -
BACKTRANSLATION OF EEG
BIOMARKERS OF ALZHEIMER’S
DISEASE FROM PATIENTS TO MOUSE
MODELS
Ph.D. thesis by Dott. Susanna Lopez
Coordinator:
Tutors:
Prof. Marco Salvetti
Prof. Cristina Limatola
2 ALZHEIMER’S DISEASE: A GLOBAL EPIDEMY 8
2.1 INCIDENCE 8
2.2 STAGES 8
2.2.1 PRECLINICAL ALZHEIMER'S DISEASE 8
2.2.2 MILD COGNITIVE IMPAIRMENT (MCI) DUE TO AD 9
2.2.3 MILD DEMENTIA DUE TO AD 9
2.2.4 MODERATE DEMENTIA DUE TO AD 9
2.2.5 SEVERE DEMENTIA DUE TO AD 10
2.3 AD PATHOLOGY 10
2.4 DIAGNOSTIC AND TOPOGRAPHIC BIOMARKERS FOR AD 13
2.5 MOUSE MODELS OF AD 15
2.5.1 TRANSGENIC MICE WITH OVEREXPRESSION OF APP 16
2.5.2 TRANSGENIC MICE WITH PRESENILIN MUTATION 16
2.5.3 TRANSGENIC MICE WITH TAU MUTATION 17
3 ELECTROENCEPHALOGRAPHIC (EEG) RHYTHMS 18
3.1 ELECTROENCEPHALOGRAPHY 18
3.2 THE EEG RHYTHMS 18
3.3 PARADIGMS OF EEG DATA ACQUISITION 20
3.3.1 SUBJECT’S MENTAL STATE 20
3.3.2 ENVIRONMENTAL CONDITIONS 21
3.3.3 INSTRUCTIONS TO SUBJECTS 21
3.3.4 MONTAGE OF EEG ELECTRODES 21
3.3.5 MONTAGE OF OTHER SENSORS FOR THE QUALITY CONTROL OF EEG RECORDING 22 3.3.6 SETTING OF RSEEG RECORDING PARAMETERS (SAMPLING FREQUENCY, BANDPASS FILTER, AMPLIFICATION,
ETC…). 22
3.4 EEG SOURCE ESTIMATION 23
4 STUDY I: TWO-YEAR LONGITUDINAL MONITORING OF AMNESTIC MILD COGNITIVE IMPAIRMENT PATIENTS WITH PRODROMAL ALZHEIMER’S DISEASE USING TOPOGRAPHICAL BIOMARKERS DERIVED FROM FUNCTIONAL MAGNETIC RESONANCE IMAGING AND
ELECTROENCEPHALOGRAPHIC ACTIVITY 25
4.1 INTRODUCTION 25
4.2 MATERIALS AND METHODS 27
4.2.1 PARTICIPANTS, CLINICAL EXAMS, AND NEUROPSYCHOLOGICAL TESTS 27
4.2.4 PATIENTS’ CLASSIFICATION IN PRODROMAL AD AND CONTROL AMCI PATIENTS 29
4.2.5 STATISTICAL ANALYSIS 30
4.3 RESULTS 31
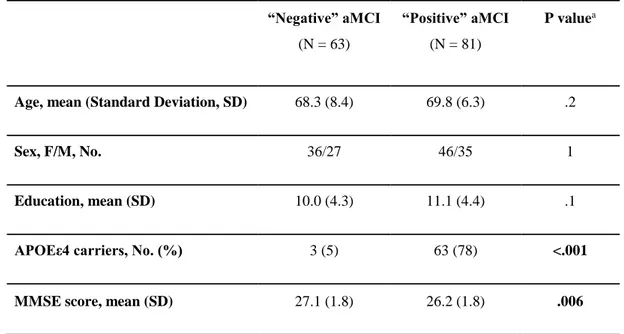
4.3.1 PATIENTS’ FEATURES 31
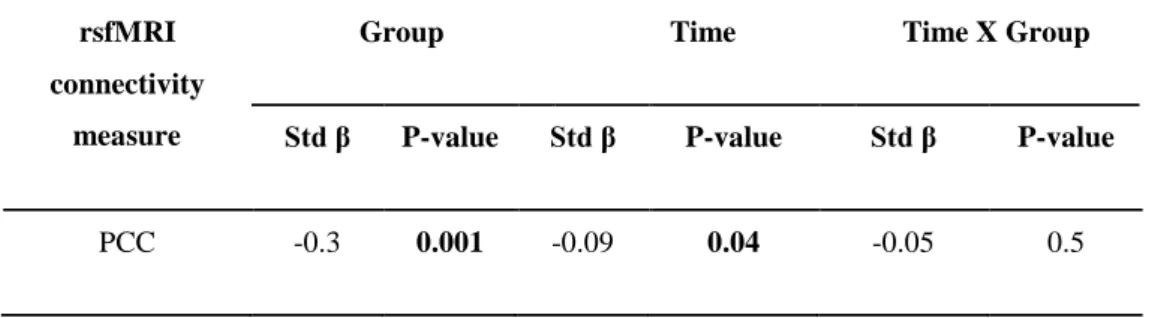
4.3.2 RSFMRI CONNECTIVITY MEASURES OF PRODROMAL AD 34
4.3.3 RSEEG AND ERP FUNCTIONAL BIOMARKERS OF PRODROMAL AD 36 4.3.4 CORRELATION OF RSFMRI AND EEG MARKERS WITH ADAS-COG13 SCORE 38
4.4 DISCUSSION 39
4.4.1 FUNCTIONAL BIOMARKERS GROUP EFFECTS 40
4.4.2 FUNCTIONAL BIOMARKERS TIME X GROUP EFFECTS: DIFFERENTIAL PROGRESSION PROFILES 42 4.4.3 WHAT DO RSFMRI AND EEG TOPOGRAPHIC BIOMARKERS TELL US ABOUT PRODROMAL AD? 43
5 STUDY II: ON-GOING ELECTROENCEPHALOGRAPHIC RHYTHMS RELATED TO CORTICAL
AROUSAL IN WILD TYPE MICE: THE EFFECT OF AGING 45
5.1 INTRODUCTION 45
5.2 METHODS 46
5.2.1 ANIMALS 46
5.2.2 PRE-SURGERY PHASE (3 WEEKS) 47
5.2.3 SURGERY 47
5.2.4 QUIET POST-SURGERY PERIOD (1 WEEK) 48
5.2.5 HANDLING POST-SURGERY PERIOD (1 WEEK) 48
5.2.6 EXPERIMENTAL DAY 48
5.2.7 DETERMINATION OF THE BEHAVIORAL MODE OF THE MICE 49
5.2.8 EEG DATA ANALYSIS 50
5.2.9 SPECTRAL ANALYSIS OF THE EEG DATA 50
5.2.10 STATISTICAL ANALYSIS 51
5.3 RESULTS 52
5.3.1 NORMALIZED EEG POWER DURING ACTIVE AND PASSIVE CONDITIONS 52
5.3.2 EFFECT OF AGE ON THE NORMALIZED EEG POWER 53
5.3.3 EFFECT OF SEX ON THE NORMALIZED EEG POWER 54
5.3.4 RELIABILITY OF THE SPECTRAL EEG MARKERS AMONG THE RECORDING CENTERS 56
5.4 DISCUSSION 58
5.4.1 ON-GOING CORTICAL EEG RHYTHMS IN WT MICE DIFFER BETWEEN THE PASSIVE AND ACTIVE CONDITIONS 58 5.4.2 ON-GOING CORTICAL EEG RHYTHMS IN WT MICE DIFFER ACROSS AGING 59
5.4.3 TRANSLATIONAL VALUE OF THE PRESENT RESULTS 59
6 STUDY III: ONGOING ELECTROENCEPHALOGRAPHIC ACTIVITY ASSOCIATED WITH
6.2 METHODS 63
6.2.1 ANIMALS 63
6.2.2 PRE-SURGERY (3 WEEKS) 64
6.2.3 SURGERY 64
6.2.4 QUIET POST-SURGERY PERIOD OF 1 WEEK 66
6.2.5 HANDLING POST-SURGERY PERIOD OF 1 WEEK 66
6.2.6 EXPERIMENTAL DAY 66
6.2.7 DETERMINATION OF THE ANIMAL BEHAVIOR 66
6.2.8 EEG DATA ANALYSIS 67
6.2.9 SPECTRAL EEG DATA ANALYSIS 68
6.2.10 STATISTICAL ANALYSIS 68
6.2.11 CONTROL ANALYSIS 69
6.3 RESULTS 70
6.3.1 ABSOLUTE EEG POWER (DENSITY) DURING PASSIVE AND ACTIVE CONDITIONS IN WT AND PDAPP GROUPS 70 71 6.3.2 COMPARISON OF THE FREQUENCY AND ABSOLUTE EEG POWER BETWEEN THE WT AND THE PDAPP GROUP 71
6.3.3 CONTROL ANALYSIS 73
6.4 DISCUSSION 75
7 STUDY IV: ONGOING ELECTROENCEPHALOGRAPHIC RHYTHMS RELATED TO CORTICAL
AROUSAL IN TRANSGENIC TASTPM MICE 79
7.1 INTRODUCTION 79
7.2 METHODS 82
7.2.1 ANIMALS 82
7.2.2 PRE-SURGERY (3 WEEKS) 83
7.2.3 SURGERY 83
7.2.4 QUIET POST-SURGERY PERIOD (1 WEEK) 84
7.2.5 HANDLING POST-SURGERY PERIOD (1 WEEK) 84
7.2.6 EXPERIMENTAL DAY 84
7.2.7 DETERMINATION OF THE BEHAVIORAL MODE 85
7.2.8 EEG DATA ANALYSIS 86
7.2.9 SPECTRAL ANALYSIS OF THE EEG DATA 86
7.2.10 STATISTICAL ANALYSIS 87
7.2.11 CONTROL ANALYSIS 88
7.3 RESULTS 88
7.3.1 NORMALIZED EEG POWER DENSITY DURING ACTIVE AND PASSIVE CONDITIONS IN WT AND TASTPM MICE 88 90 7.3.2 COMPARISON OF THE NORMALIZED EEG POWER BETWEEN WT AND TASTPM MICE 90
8.1 EEG BIOMARKERS IN AD PATIENTS 97
8.2 EEG BIOMARKERS IN AD MOUSE MODELS 98
6
1 Preamble
The present Ph.D. thesis has been mainly developed on the data of the project with the short name PharmaCog (2010-2015), granted by the European Framework Programme 7 with about 28 millions of Euro (i.e. Innovative Medicine Initiative, IMI, grant agreement n°115009; www.pharmacog.org). This project involved 15 academic institutions, 12 global pharmaceutical companies, and 5 small and medium sized enterprises (SMEs).
The PharmaCog project aimed at improving the pathway of drug discovery in Alzheimer’s disease (AD), based on a major interest of pharma companies, namely the validation of electrophysiological, neuroimaging, and blood biomarkers possibly sensitive to the effect of disease-modifying drugs reducing Ab42 in the brain in AD patients at the prodromal stage of amnesic mild cognitive impairment (aMCI). The core concept of the PharmaCog project was that the pathway of drug discovery in AD may be enhanced by (1) the validation of biomarkers derived from blood, EEG, magnetic resonance imaging (MRI), and positron emission tomography (PET) in patients with aMCI due to AD diagnosed by in-vivo measurement of Aand phospho-tau in the brain and (2) the evaluation of the translational value of those human biomarkers in wild type (WT) mice and animal models of AD including transgenic mice with the mutation of PS1 and/or APP (i.e. PDAPP and TASTPM strains). Those genetic factors induce an abnormal accumulation of Ain the brain and related cognitive deficits. The expected results may be (1) the identification of a matrix of biomarkers sensitive to the prodromal AD (aMCI cognitive status) and its progression in patients and (2) the selection of similar biomarkers related to AD neuropathology and cognitive deficits in PDAPP and TASTPM strains. These biomarkers were expected to be very useful in clinical trials testing the efficacy and neurobiological impact of new disease-modifying drugs against prodromal AD.
For the development of this Ph.D. thesis, the access to the experiments and the data of the PharmaCog project was allowed by Prof. Claudio Babiloni, leader of an Italian Unit (University of Foggia in 2010-2012 and Sapienza University of Rome in 2013-2015) of the PharmaCog Consortium and coordinator of study activities relative to biomarkers derived from electroencephalographic (EEG) signals recorded from human subjects and animals in that project. Specifically, Prof. Claudio Babiloni was in charge for the centralized qualification and analysis of EEG data recorded from aMCI patients (Work Package 5, WP5) and transgenic mouse models of AD such as PDAPP and TASTPM strains (WP6). The data of the present Ph.D. thesis mostly derived from the WP5 and WP6.
This document illustrating the Ph.D. thesis is structured in three main Sections:
▪ An Introductive part illustrating concisely the AD neuropathology, the mouse models of AD used in this thesis, and basic concepts of EEG techniques useful to understand the present study results; ▪ An Experimental part describing the result of the four research studies led in the framework of this
Ph.D. project. Two of these studies were published in international journals registered in ISI/PubMed with impact factor, while the other two are being currently under minor revisions in those journals; ▪ A Conclusion section.
7
Since the results of the present Ph.D. thesis are based on experiments developed in the framework of the PharmaCog project, the specific contribution of this Ph.D. candidate (Miss Susanna Lopez) may be not immediately detectable. To elucidate it, the following declaration of Prof. Claudio Babiloni is added to this preamble.
Declaration of Prof. Claudio Babiloni
During her Ph.D. course in Clinical/Experimental Neuroscience and Psychiatry (XXX Cycle), Miss Susanna Lopez has developed her Ph.D. project (curriculum in Neurophysiology) with two main scientific issues:
• Study of electroencephalographic (EEG) progression biomarkers of Alzheimer’s Dsease (AD) in the
prodromal stage of amnestic Mild Cognitive Impairment amnesico (aMCI);
• Evaluation of translational value of above-mentioned EEG biomarkers in wild type (WT) mice and in
transgenic mouse models with PS1 and/or APP mutation, inducing abnormal accumulation of A 42 in the brain, resembiling those in humans, and cognitive deficits.
These scientific issues have been addressed under my supervision using EEG data of PharmaCog project
(2010-2015), which received funding of about 28 millions of Euro form European Commission in the 7th Framework Programme (i.e. Innovative Medicine Initiative, IMI, grant agreement n°115009;
www.pharmacog.org). This project comprised 14 academic institutions, 12 pharma companies and 5 small-middle enterprises (SMEs). In th PharmaCog consortium, my Unit of University of Foggia and University of Rome was in charge for the centralized analysis of EEG data showed in Miss. Lopez’s Ph.D. thesis. In this framework, Miss. Lopez has distinguished herself in contributing to my Unit’s action. Specifically, in her project she has worked with scientific initiative and maturity in the following activities:
• Bibliographic review of the literature inherent to Ph.D. project;
• Visual, spectral and statistical analysis of EEG data of PharmaCog project of aMCI patients and WT
and transgenic mice (PS1 and/or APP mutations);
• Participation to teleconference of PharmaCog WP5 and WP6, beforw and fter the end of the project,
for the discussin of EEG results for the publications of the scientific papers;
• Contribution for the writing of the scientific reports (i.e., Deliverables on the activities in the
PharmaCog WP6), poster and scientific articles on the EEG data in the framework of Ph.D. project.
Miss Susanna Lopez presented posters in two European Conferences receiving a good feedback: • European Congress on Clinical Neurophysiology 2015 (October 2015; Brno, Czech Republic) • First Synanet Meeting (January 2017; Lisbon, Portugal).”
Sincerely, Prof. Claudio Babiloni
8
2 Alzheimer’s Disease: a global epidemy
2.1 Incidence
Recent statistics taken from Alzheimer’s Association report of 2017 show that someone in the world develops dementia every 3 seconds. In 2015 there were an estimated 46.8 million people worldwide living with dementia and this number is believed to be close to 50 million people in 2017. This number will almost double every 20 years, reaching 75 million in 2030 and 131.5 million in 2050 for the progressive ageing going on in most developed country, even though much of the increase will be in developing countries. Already 58% of people with dementia live in low and middle-income countries, but by 2050 this will rise to 68%. The fastest growth in the elderly population is taking place in China, India, and their south Asian and western Pacific neighbours. Alzheimer’s Disease (AD) is a neurodegenerative disease and one of the most common causes of dementia (60-70% of cases). AD was first described in 1906 at a conference in Tubingen, Germany by Alois Alzheimer, as a “peculiar severe disease process of the cerebral cortex” (Alzheimer, 1906), but about 70 years passed before it was recognized as a common cause of dementia and a major cause of death. It is characterized by specific episodic memory disorders at its initial stages but progressively other symptoms appear, such as problems with language, disorientation (including easily getting lost), mood swings, loss of motivation, not managing self-care, and behavioural issues with the final loss of independence in the daily living activities.
An estimated 5.5 million Americans of all ages are living with AD dementia in 2017. This number includes an estimated 5.3 million people age 65 and older and approximately 200,000 individuals under age 65 who have younger-onset AD, though there is greater uncertainty about the younger-onset estimate. One in 10 people aged 65 and older (10 percent) has AD dementia. The percentage of people with AD dementia increases with age: 3 percent of people age 65-74, 17 percent of people age 75-84, and 32 percent of people age 85 and older have AD dementia. Of people who have AD dementia, 82 percent are age 75 or older.
Of note, these statistics are extrapolated from prevalence studies in which all the subjects enrolled received a diagnosis of dementia. Outside from the research applications, only half of those who would meet the diagnostic criteria for AD and other dementias are diagnosed with dementia by a physician (Boustani et al., 2003, Bradford et al., 2009, Kotagal et al, 2015). Thus, as AD dementia is underdiagnosed and underreported, a large portion of patients with AD may not know they have it.
2.2 Stages
Several studies (Sperling et al., 2011; Albert et al., 2011; McKhann et al., 2011) established that AD is a pathology beginning years before the clear manifestation of clinical symptoms and the onset of dementia. Five stages in AD pathogenesis could be recognized according to Mayo Clinic classification:
9
AD begins long before any symptoms become apparent. This stage is called preclinical AD. Symptoms during this stage won’t be noticed, nor by the patients nor by people around him. This stage of AD can last for years, possibly even decades. Although any changes happen, imaging technologies can identify deposits of A The ability to identify these early deposits may be especially important in the future as new treatments are developed for Alzheimer's disease. Additional biomarkers indicating an increased risk of disease have been identified for AD. These biomarkers can be used to support the diagnosis of AD typically, after symptoms are evident. There are also genetic tests indicating a higher risk of AD, particularly early-onset AD. As with newer imaging techniques, biomarkers and genetic tests will become more important as new treatments for Alzheimer's disease are developed.
2.2.2 Mild cognitive impairment (MCI) due to AD
People with mild cognitive impairment have mild changes in their memory and thinking ability. These changes aren't significant enough to affect work or relationships yet. People with MCI may have memory lapses when it comes to information that is usually easily remembered, such as conversations, recent events or appointments. Furthermore, they may also have trouble judging the amount of time needed for a task, or they may have difficulty correctly judging the number or sequence of steps needed to complete a task. The ability to make sound decisions can become harder for people with MCI. Not everyone with MCI will develop AD. The same procedures used to identify preclinical Alzheimer's disease can help determine whether MCI is due to AD or something else.
2.2.3 Mild dementia due to AD
AD is often diagnosed in the mild dementia stage, when it becomes clear to family and doctors that a person is having significant trouble with memory and thinking that impacts daily functioning.
In the mild Alzheimer's stage, people may experience:
▪ Memory loss for recent events. Individuals may have an especially hard time remembering newly
learned information and ask the same question over and over.
▪ Difficulty with problem-solving, complex tasks and sound judgments. Planning a family event or
balancing a checkbook may become overwhelming. Many people experience lapses in judgment, such as when making financial decisions.
▪ Changes in personality. People may become subdued or withdrawn — especially in socially
challenging situations — or show uncharacteristic irritability or anger. Reduced motivation to complete tasks also is common.
▪ Difficulty organizing and expressing thoughts. Finding the right words to describe objects or clearly
express ideas becomes increasingly challenging.
▪ Getting lost or misplacing belongings. Individuals have increasing trouble finding their way around,
even in familiar places. It's also common to lose or misplace things, including valuable items.
2.2.4 Moderate dementia due to AD
During the moderate stage of AD, people grow more confused and forgetful and begin to need more help with daily activities and self-care.
People with moderate AD may:
▪ Show increasingly poor judgment and deepening confusion. Individuals lose track of where they are,
10
or mistake strangers for family. They may wander, possibly in search of surroundings that feel more familiar. These difficulties make it unsafe to leave those in the moderate Alzheimer's stage on their own.
▪ Experience even greater memory loss. People may forget details of their personal history, such as their
address or phone number, or where they attended school. They repeat favorite stories or make up stories to fill gaps in memory.
▪ Need help with some daily activities. Assistance may be required with choosing proper clothing for
the occasion or the weather and with bathing, grooming, using the bathroom and other self-care. Some individuals occasionally lose control of their bladder or bowel movements.
▪ Undergo significant changes in personality and behavior. It's not unusual for people with moderate
Alzheimer's disease to develop unfounded suspicions — for example, to become convinced that friends, family or professional caregivers are stealing from them or that a spouse is having an affair. Others may see or hear things that aren't there. Individuals often grow restless or agitated, especially late in the day. Some people may have outbursts of aggressive physical behavior.
2.2.5 Severe dementia due to AD
In the severe (late) stage of AD, mental function continues to decline, and the disease has a growing impact on movement and physical capabilities.
In severe AD, people generally:
▪ Lose the ability to communicate coherently. An individual can no longer converse or speak coherently,
although he or she may occasionally say words or phrases.
▪ Require daily assistance with personal care. This includes total assistance with eating, dressing, using
the bathroom and all other daily self-care tasks.
▪ Experience a decline in physical abilities. A person may become unable to walk without assistance,
then unable to sit or hold up his or her head without support. Muscles may become rigid and reflexes abnormal. Eventually, a person loses the ability to swallow and to control bladder and bowel functions.
2.3 AD pathology
The earliest and most severe degeneration that could be observed at autopsy in AD patients is usually found in the medial temporal lobe (enthorinal/perirhinal cortex and hippocampus), lateral temporal cortex, and nucleus basalis of Meynert.
11
Figure 1. Differences between normal and AD brains.
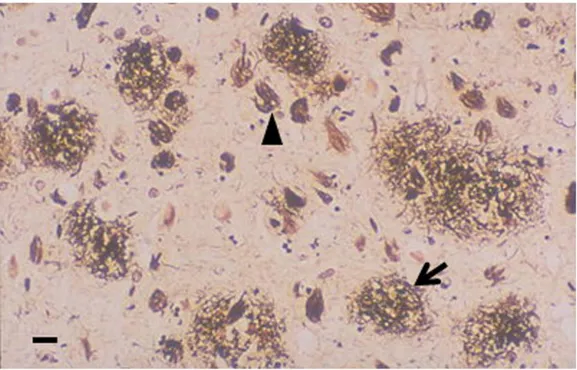
At the microscopic level, neuritic plaques and neurofibrillary tangles (NFTs) could be observed. They may appear also in normal ageing but are specifically linked with AD pathology. Increasing evidence suggest that cellular dysfunction is caused by soluble amyloid species called oligomers, which are toxic. Futher amyloid polymerization and fibril formation lead to neuritic plaques, formed by an amyloid central core, proteoglycans, ApoE4, and other proteins. Ais a protein formed by 39 to 41 aminoacids derived from the Amyloid Precursor Protein (APP), a large transmembrane protein, which is cleaved from b and g-secretases. The normal functional role of A is still not clear, while APP is known to have neurotrophic and neuroprotective properties. The amyloid core is surrounded by a halo composed by dystrophic and tau-immunoreactive neurites and activated microglia. NFTs are formed by silver-staining neuronal cytoplasmic fibrils composed by abnormally hyperphosphorilated tau protein (appearing as paired helical filaments). Tau binds to and stabilize microtubules, supporting axonal transport of several molecules (organelles, neurotransmitters, …). When phosphorylated, tau protein cannot bind microtubules and tends to invade the neural cytoplasm, compromising the functions of distal densrites.
At biochemical level, AD is associated with a decrease at the cortical level of several proteins and neurotransmitter, especially acetylcholine, its synthetic enzyme choline acetyltransferase, and nicotinic cholinergic receptors. The most important effect is that reduced achetilcholine induces degeneration of cholinergic neurons. Indeed, a typical feature of the AD is the deficit in the brain cholinergic neurotransmission, which has been related to cognitive, neuropsychiatric, and functional deficits in AD patients (Cummings and Back, 1998). As the human cerebral cortex does not contain local cholinergic neurons, the acetylcholine deficiencies are attributed typically to a dysfunction of the ascending cholinergic innervations from the basal nucleus of Meynert in the basal forebrain to the cerebral cortex (Arendt et al., 2015). This
12
nucleus includes approximately 80% of the cholinergic neurons in the brain and is severely atrophic in the advanced stages of the AD (Arendt et al., 2015).
Figure 2. Histopathology of AD senile plaques (arrow) and neurofibrillary tangles (arrowhead) are detected by silver staining of
a section of brain cortex (scale bar, 10 μM, Allsop and Mayes, 2014)
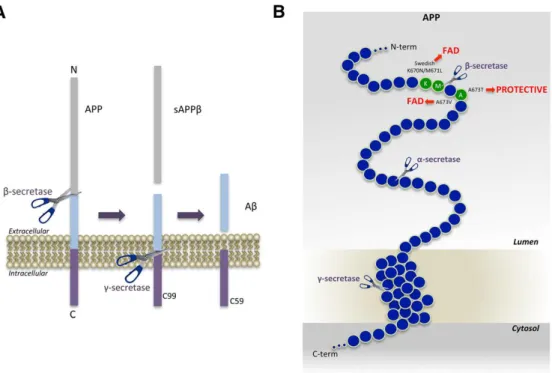
APP is catabolized by and secretases. As a first step, APP is cleaved by a and b secretases producing non-toxic molecules; after the cleavage by g secretases on the secretases product could lead to toxic (A42) or non-toxic (A40) peptide. The cleavage by secretases produces non-toxic P3 peptide. The accumulation of toxic A42 is a key initial step for cellular damage in AD. Thus, therapies have focussed on reducing this accumulation by inhibiting the activity of and secretases, or by promoting secretases, or clearing A2 with specific antibodies. Figure 3 schematically illustrates the action mechanism of andsecretase enzyme.
13
Figure 3. APP processing and Aβ generation and mutations that affect β-secretase cleavage. A. APP is a Type-I membrane
protein that is sequentially cleaved by two aspartic proteases to generate Aβ. First, the β-secretase enzyme cuts APP (1) to create the N-terminus of Aβ. Second, C99 is cleaved by the γ-secretase enzyme (2) to generate the C-terminus of Aβ. Aβ is then released into the lumen of the endosome and secreted into the extracellular medium. An intracellular domain, C59, is also produced. B. The amino acids in and around the Aβ domain of APP are represented as blue circles. Amino acids that affect β-secretase processing of APP in
humans are green circles, within which the wild-type residue is identified by the single-letter amino acid code. The K670N/M671L (Swedish) and A673V mutations cause FAD (Familiar AD) by increasing β-secretase cleavage and Aβ production, while the A673T
mutation protects against AD by doing the opposite. All three mutations occur at or within one amino acid of the β-secretase cleavage site. Scissors indicate cleavage sites of the various secretases (Vassar, 2014).
In 1% of patients, AD is a familial disorder resulting from the mutation in one of three functionally related membrane proteins: APP, presenilin 1 (PS1) and presenilin 2 (PS2). Onset of the disease typically happens between 30 and 60 years old. Down syndrome (trisonomy 21) patients develop AD early too, with a mean onset age of 50 years old, which is thought to be related with an extra copy of APP gene, located on chromosome 21. Although the cause of sporadic AD is still unknown, the gene defects in familial AD support possible roles for both APP (neurotrophic properties) and presenilins (involved in APP metabolism).
2.4 Diagnostic and Topographic biomarkers for AD
AD has traditionally been defined as a type of dementia, a notion brought into existence with the publication of criteria from the National Institute of Neurological and Communicative Disorders and Stroke–Alzheimer’s Disease and Related Disorders Association (NINCDS– ADRDA) in 1984 (McKhann et al., 1984). These criteria showed two major critical points, i.e. (i) the clinical diagnosis of AD could only be designated as “probable” while the patient was alive and could not be made definitively until AD pathology had been confirmed post mortem; and (ii) the clinical diagnosis of AD could be assigned only when the disease had advanced to the point of causing significant functional disability and met the threshold criterion of dementia. The absence at that time of clinical criteria for the other dementias and the lack of biomarkers resulted in a low
14
specificity in differentiation of AD from other dementias (Varma et al., 1999). In 2007, the International Working Group (IWG) for New Research Criteria for the Diagnosis of AD provided a new conceptual framework that moved AD from a clinicopathological to a clinicobiological entity (Dubois and Albert, 2004). These 2007 IWG criteria proposed that AD could be recognised in vivo and independently of dementia, in the presence of two requisite features. The first was a core clinical phenotypic criterion that required evidence of a specific episodic memory profile characterised by a low free recall that is not normalised by cueing.5 The
second criterion was the presence of biomarker evidence consistent with and supportive of AD on: (1) structural MRI; (2) molecular neuroimaging with PET (F-2-fluoro-2-deoxy-D-glucose PET, FDG PET, or C-labelled Pittsburgh compound B PET, PiB PET); or (3) CSF analysis of amyloid β (Aβ) or tau protein (total tau, T-tau, and phosphorylated tau, P-tau) concentrations. The most innovative aspect of the 2007 criteria was the first introduction of biomarkers into the core diagnostic framework.
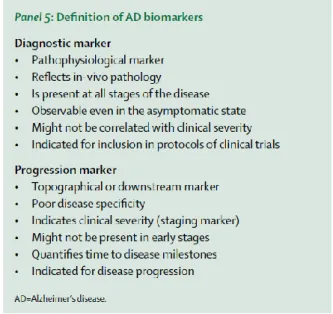
Another revision of diagnostic guidelines was published in 2014 proposing that pathophysiological biomarkers of AD pathology and downstream topographical markers of AD should be reconceptualised, whereby biomarkers of AD pathology are restricted to those indicating the specific presence of tau pathology (CSF or PET tau) and amyloid pathology (CSF or PET amyloid) These biomarkers have the necessary specificity for a diagnosis of AD at any point on the disease continuum.
Figure 4. Definition of AD biomarkers (Dubois et al., 2014)
Downstream topographical markers of brain regional structural and metabolic changes have insufficient pathological specificity and but can be used to measure disease progression, as able to reflect topographical evidence of brain damage (regional atrophy or hypometabolism). They include particularly hippocampal atrophy assessed by MRI, cortical hypometabolism measured by FDG PET, and the subsequent cognitive and behavioural changes lack pathological specificity for AD, and they might be particularly valuable for detection and quantification of disease progression. These changes might be good markers to monitor time to disease milestones—eg, dementia onset—or for determination of disease stages.
15
A further update of international guidelines consists in the clear distinction between AD and AD pathologic changes (Jack et al., 2018). The prototypical multidomain amnestic dementia phenotype used to define probable AD, as definded by McKhann et al., (1984) does not “rule in” AD pathologic change (which implies change from normal) at autopsy (Nelson et al., 2011, Serrano-Pozo et a., 2014, Barnes et al., 2015) and the absence of the syndrome does not “rule out” AD pathologic change. Thus, the multidomain amnestic dementia phenotype is not specific; it can be the product of other diseases as well as AD (Serrano-Pozo et a., 2014). Nonamnestic clinical presentations, that is, language, visuospatial, and executive disorders, may also be due to AD (Rabinovici et al., 2008, Dubois et al., 2010, Murray et al., 2011). In addition, AD neuropathologic changes are often present without signs or symptoms, especially in older persons. An individual with biomarker evidence of A deposition alone (abnormal amyloid PET scan or low CSF A42 or A42/A40 ratio) with a normal pathologic tau biomarker would be assigned the label “Alzheimer’s pathologic change”. The term “Alzheimer’s disease” would be applied if biomarker evidence of both A and pathologic tau was present.
Unfortunately, none of the mentioned CSF, MRI, and PET markers allows a clear-cut diagnosis or prediction of all clinical presentations of AD. Furthermore, they cannot be serially used along years for the evaluation of AD individuals before and after pharmacological and non-pharmacological interventions. Indeed, these biomarkers are invasive (e.g., lumbar puncture for CSF sampling; the injection of radioactive tracers in PET procedures) and/or expensive (e.g., PET, MRI) for serial recordings. Therefore, there is a quest for new cost-effective, largely available, and non-invasive biomarkers of AD to be used in serial recordings and suitable for application to elderly subjects with some cognitive impairment (i.e., not requiring the subject’s collaboration or prolonged states of complete immobilization).
Electroencephalographic (EEG) markers potentially fit the ideal features mentioned above. Its recording is non-invasive and costeffective. The high temporal resolution of EEG signals (e.g., milliseconds) is ideal for investigating emerging features of brain physiology, namely awake brain rhythms. In the condition of resting state eyes-closed, human brain produces dominant oscillations at about 8–13 Hz, the so-called alpha rhythms (Babiloni et al., 2010, 2011, 2013, 2016). Cognitive processes such as attention, perceptual binding, and working memory are typically related to a reduction in power of resting state alpha and beta (14–30 Hz) rhythms and to an increase in power of delta (1–4 Hz), theta (4–7 Hz), and gamma (30–70 Hz) rhythms (Babiloni et al., 2010, 2011, 2013, 2016). Markers of resting state EEG rhythms may probe the neurophysiological “reserve” in patients with dementing disorders; defined as the residual ability of the brain to ensure (1) the synchronization of neural activity at different spatial scales and frequencies from small cellular populations to large regions and (2) the coordination of this synchronization across subcortical and cortical neural networks (Babiloni et al., 2016).
2.5 Mouse models of AD
Animal models are crucial for translational research. They offer the possibility of applying pharmacological intervention invivo to study pharmacodynamic/pharmacokinetics properties, to evaluate drugs’ safety and
16
adverse effects and to assess its efficacy. The more the model can reproduce human system physiological functions and behaviour, the better is the model.
Several mouse models of AD have been developed, as this disease is characterized by well-recognized pathological hallmarks, consisting of senile plaques and NFTs, and features, including neuronal and synaptic loss, dystrophic neurites, reactive astrocytes, and activated microglia. Transgenic mice may be generated by introducing a genetic modification on top of the existing genetic makeup or by modifying selectively the homologous gene of interest in its normal chromosomal position (gene targeting; Elder et al., 2010).
2.5.1 Transgenic mice with overexpression of APP
Based on amyloid hypothesis (Hardy and Selkoe, 2002), attempts were made to overexpress wildtype APP in transgenic mice by pronuclear injection. Although a variety of promoters were tried, none of these efforts produced anything that resembled an amyloid plaque or any other recognizable AD-type pathology. The introduction of FAD (familial AD) mutations in APP had greater outcome: Games et al. (1995) reported the first successful application of this approach using a platelet derived growth factor-β (PDGF) promoter to drive a human APP transgene that contained an FAD associated mutation (V717F) in the so-called PDAPP mouse. These models were characterized by mutations only at the γ-secretase cleavage site, exhibiting age-dependent amyloid deposition in the brain along with thioflavin-S–positive plaques, including compact plaques with dense cores that were highly reminiscent of those seen in human AD. Dystrophic neurites, reactive astrocytes, and activated microglia were all found near plaques. The process was age-related, in that plaque deposition was minimal at 6 months of age but clear by 9 months, increasing dramatically by 12 to 15 months (Reilly et al., 2003). PDAPP mice were subsequently shown to develop agerelated learning defects (Chen et al., 2000) and synapse loss (Dodart et al., 2000).
Hsiao et al., (1996) overexpressed a human APP transgene containing the Swedish FAD mutation (K670N/M671L), affecting the β-secretase cleavage site. These mice, termed Tg2576 mice, expressed human APP at levels more than 5-fold above the levels of the endogenous mouse APP, and A40 and A42 levels increased with age. Like PDAPP mice, Tg2576 mice exhibited age-dependent amyloid deposition, which resulted in thioflavin-S–positive plaques like those found in AD, along with gliosis and dystrophic neurites. Plaque amyloid was first clearly seen by 11 to 13 months, eventually becoming widespread in cortical and limbic structures. Water maze learning, a test of spatial memory in mice, was normal in 3-month-old animals but impaired in 9- to 10-month-old mice. The Tg2576 mouse line has been made widely available and has been the most widely studied transgenic AD model.
2.5.2 Transgenic mice with Presenilin mutation
Mutations in Presenilin 1 (PS1, associated with a locus on chromosome 14) are the most commonly recognized causes of early-onset FAD, and to date more than 160 mutations in PS1 linked to FAD have been discovered (Elder et al., 2010). Mutations in a related gene on chromosome 1were soon linked to FAD as well
(Ertekin-17
Taner, 2007) and called Presenilin 2 (PS2). Singly transgenic PS1 or PS2 mice do not develop plaques, expressing increased Aβ42 levels with no effect on Aβ40 although when crossed with plaque-forming APP lines, the presenilin FAD mutations cause earlier and more extensive plaque formation.
TASTPM mice (Howlett et al., 2004, 2008) were produced by a double mutation in APP KM670/671NL (Swedish) and PS1 M146V. These models are characterized by amyloidosis beginning at 3-4 months in the cerebral cortex, with mature plaques forming by 6-8 months, and eventually severe Aβ plaque deposition by 10 months (Howlett et al., 20004, 2008). TASTPM mice show both age-related neuropathology and early and progressive cognitive impairment, thus reproducing features of the pathophysiological and clinical presentation of familial AD (Howlett et al., 20004, 2008).
2.5.3 Transgenic mice with tau mutation
Mouse models of AD neurofibrillary pathology have mostly relied on expressing transgenic human tau with mutations that cause frontotemporal dementia, even though tau mutations do not cause AD, and thus it is unclear that the mechanisms induced by tau mutations are involved in AD pathophysiology.
TAPP mice were hAPP/tau double transgenic mice produced by crossing the Tg2576 line of human APP transgenic mice and the JNPL3 line expressing P301L human tau (Lewis et al., 2001). Aβ deposition in TAPP mice is similar to the Tg2576 line, but tau pathology is more severe than the JNPL3 line, indicating that Aβ can accelerate the tau pathology (Bolmont be et al., 2001, Götz et al., 2007, Lewis et al., 2001).
3xTg line was produced combining mutant APP (hAPP Swedish mutation), PS1 (M146V mutation), and tau (P301L mutation) transgenes. These models develop extracellular Aβ plaques before tangle pathology, as in human AD (Oddo et al., 2003). However, the Aβ and tau pathologies in 3xTg mice appear to develop independently, without a causal link, since tau pathology was unaffected by crossing with BACE-deficient mice to eliminate Aβ production (Winton et al., 2011).
18
3 Electroencephalographic (EEG) rhythms
3.1 Electroencephalography
Electroencephalography (EEG) is the technique aiming at recording the electrical activity produced by brain cells. The first recording of the electric field of the human brain was made by the German psychiatrist Hans Berger in 1924 in Jena. He gave this recording the name electroencephalogram. This technique is typically a non-invasive invasive method to record the electrical activity of the brain along the scalp. On the contrary, stereoelectroencephalography records the electrical activity in deep structures of the brain. EEG measures voltage dynamical changes resulting from ionic current within the neurons of the brain (Niedermeyer and Lopes da Silva, 2004). In clinical contexts, EEG typically refers to the recording of the brain's spontaneous electrical activity from multiple electrodes placed on the scalp over a period.
The electric potential generated by an individual neuron is far too small to be picked up by electroencephalography (Nunez et al., 1981). Therefore, the activity captured by EEG is always produced by summation of the synchronous activity of thousands or millions of neurons with similar spatial orientation. If spatial orientation is different, cells’ ionic currents are not aligned and do not create enough electrical voltage to be detected. Pyramidal neurons of the cortex are thought to produce the most EEG signal because they are well-aligned and fire together. Because voltage fields fall off with the square of distance, activity from deep sources is more difficult to detect than currents near the skull (Klein and Thorne, 2006). Synchronization refers to a process wherein some linear and/or nonlinear oscillatory components of a system adjust a given property of their activity over time showing a collective behavior (Boccaletti et al., 2002). In the context of EEG rhythms, features of the “synchronization” class reflect the temporal dynamics of the synchronized activity in local cortical neural populations, showing a collective oscillatory behavior at a macroscopic spatial scale of a few centimeters. Distributed populations of those neurons in the cerebral cortex are considered as the main source of EEG rhythms recorded by scalp electrodes in both resting and task conditions. Peculiar frequency ranges and spatial distributions are associated with different states of brain functioning (e.g., waking and the various sleep stages). These oscillations represent synchronized activity over a network of neurons.
The EEG is typically described in terms of rhythmic activity, divided into bands by frequency, and transient. These frequency bands are mostly a matter of nomenclature, but these designations arose because rhythmic activity within a certain frequency range was noted to have a certain distribution over the scalp or a certain biological significance.
3.2 The EEG rhythms
Most of the cerebral signal observed in the scalp EEG falls in the range of 1–20 Hz (activity below or above this range is likely to be artifactual, under standard clinical recording techniques). Waveforms constituting
19
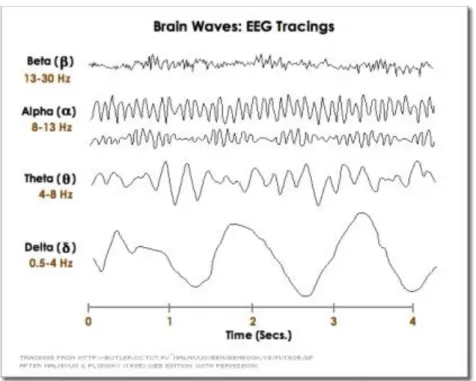
EEG signals are subdivided into frequency bands known as delta, theta, alpha, beta, and gamma as commonly defined in clinical practice (Figure 5).
▪ Delta is the frequency range up to 4 Hz. It tends to be the highest in amplitude and the slowest waves. It is seen normally in adults in slow wave sleep. It is also seen normally in babies. It may occur focally with subcortical lesions and in general distribution with diffuse lesions, metabolic encephalopathy hydrocephalus or deep midline lesions. It is usually most prominent frontally in adults (e.g. FIRDA - Frontal Intermittent Rhythmic Delta) and posteriorly in children (e.g. OIRDA - Occipital Intermittent Rhythmic Delta).
▪ Theta is the frequency range from 4 Hz to 7 Hz. Theta is seen normally in young children. It may be seen in drowsiness or arousal in older children and adults; it can also be seen in meditation. Excess theta for age represents abnormal activity. It is considered as a focal disturbance in focal sub-cortical lesions; it can be seen in generalized distribution in diffuse disorder or metabolic encephalopathy or deep midline disorders or some instances of hydrocephalus. On the contrary this range has been associated with reports of relaxed, meditative, and creative states.
▪ Alpha is the frequency range from 7 Hz to 13 Hz. Hans Berger named the first rhythmic EEG activity he saw as the "alpha wave". This was the "posterior basic rhythm" (also called the "posterior dominant rhythm" or the "posterior alpha rhythm"), seen in the posterior regions of the head on both sides, higher in amplitude on the dominant side. It emerges with closing of the eyes and with relaxation and attenuates with eye opening or mental exertion. The posterior basic rhythm is actually slower than 8 Hz in young children (therefore technically in the theta range).
▪ Beta is the frequency range from 14 Hz to about 30 Hz. It is seen usually on both sides in symmetrical distribution and is most evident frontally. Beta activity is closely linked to motor behavior and is generally attenuated during active movements. Low amplitude beta with multiple and varying frequencies is often associated with active, busy or anxious thinking and active concentration. Rhythmic beta with a dominant set of frequencies is associated with various pathologies and drug effects, especially benzodiazepines. It may be absent or reduced in areas of cortical damage. It is the dominant rhythm in patients who are alert or anxious or who have their eyes open.
▪ Gamma is the frequency range approximately 30–100 Hz. Gamma rhythms are thought to represent binding of different populations of neurons together into a network for the purpose of carrying out a certain cognitive or motor function.
20
Figure 5. Normal adult brain waves (they are referred to 1 s of duration): delta (< 4 Hz), theta (4-7 Hz), alpha (8-13 Hz), beta
(14-30 Hz), and gamma (30-100 Hz).
3.3 Paradigms of EEG data acquisition
Several guidelines (Jobert et al., 2012) have been produced to provide indications to allow reproducibility of EEG experiments, thus data acquired from a subject could be compared over time with data from the same subject or from other subjects.
3.3.1 Subject’s mental state
For clinical research, some important conditions should be considered. Firstly, a few days prior to the recording of rsEEG rhythms, subjects should be instructed to have regular sleep on the night before that recording. Subjects should also be instructed not to use psychoactive substances and medications (i.e., foods and drinks including nicotine, caffeine, alcohol, and other stimulants in any form in the morning of the experiment). In the same line, benzodiazepines, antidepressant, and/or antihypertensive drugs (when typically used by subjects) may have to be withdrawn for about 24h before the recording if the drug effects may interfere with interpretation of rsEEG rhythms.
Secondly, the preferred time for the recording of rsEEG rhythms is the morning. At that time, it is expected that the subject is not tired or sleepy and has had only a satisfying light breakfast.
Thirdly, a brief interview of the subjects should confirm if the above conditions are adequately met in the morning of the EEG recording. Ideally, the subjects’ quality of sleep during the night preceding the recording should not be different from usual. In the case of conditions incompatible with a recording of good quality, the event should be postponed to another date.
21 3.3.2 Environmental conditions
Ideal environment is achieved through the careful control of general conditions during the recording and specific instructions given to the subject, i.e. room lighting, acoustic noise, comfortability of armchair or bed during for the subjects, wall painting.
3.3.3 Instructions to subjects
Subject should be instructed clearly according to the peculiar experimental protocol adopted. Several paradigms and following analyses could be applied:
▪ Recording and processing of EEG at rest (resting state is defined as a mental state of quite vigilance) or during sleep stages;
▪ Recording and processing of EEG during mental tasks, sensory stimulation or motor acts;
▪ Recording and processing of EEG event-related, i.e. the short activation immediately following a specific task.
3.3.4 Montage of EEG electrodes
In conventional scalp EEG, the recording is obtained by placing electrodes on the scalp with a conductive gel or paste, usually after the preparation of the area by exercising a gentle abrasion to reduce impedance due to dead skin cells. Many systems typically use single-use electrodes, each with its own individual wire. Some systems use caps or nets into which electrodes are embedded; this is particularly common when high-density arrays of electrodes are needed (64 electrodes or higher).
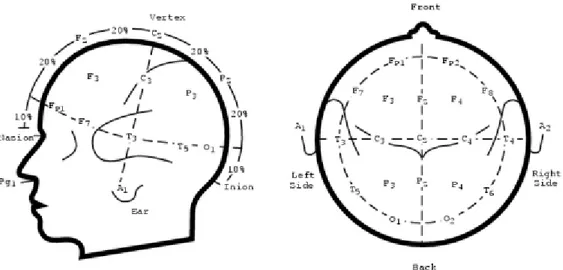
The 10–20 system or International 10–20 system is an internationally recognized method to standardize the location of scalp electrodes for EEG clinical acquisition or experiment. In this way, reproducibility is ensured, and data acquired from a subject could be compared over time with data from the same subject or from other subjects. This system is based on the relationship between the location of an electrode and the underlying area of cerebral cortex. The "10" and "20" refer to the fact that the actual distances between adjacent electrodes are either 10% or 20% of the total front–back or right–left distance of the skull. Each site has a letter to identify the lobe and a number to identify the hemisphere location. The letters F, T, C, P and O stand for frontal, temporal, central, parietal, and occipital lobes, respectively. The "C" letter is used only for identification purposes because there exists no central lobe; a "z" (zero) refers to electrodes placed on the midline. Even numbers (2, 4, 6, 8) refer to electrode positions on the right hemisphere, whereas odd numbers (1, 3, 5, 7) refer to those on the left hemisphere. In addition, the letter codes A, Pg and Fp identify the earlobes, nasopharyngeal and frontal polar sites respectively. Two anatomical landmarks are used for the essential positioning of the EEG electrodes: first, the nasion which is the distinctly depressed area between the eyes, just above the bridge of the nose; second, the inion, which is the lowest point of the skull from the back of the head and is normally indicated by a prominent bump (Figure 6).
22
Figure 6. Diagram of the international 10/20 system. Each electrode is assigned a nomenclature with a letter and a number.
The letters indicate the areas of the scalp: F (Frontal), C (Central), T (Temporal), P (Parietal) and O (Occipital); numbers are odd for the left side and even for the right side.
3.3.5 Montage of other sensors for the quality control of EEG recording
To control of eye movements (i.e., saccades) or blinking in clinical routine and research applications, vertical and horizontal electro-oculographic (EOG) potentials should be recorded from bipolar electrode pairs placed around the dominant eye. For specific clinical research purposes, other EOG montages as well as infrared or optical eye tracking can be used.
To control of the subject’s arousal, vital signs, and behavior, other electrodes can be mounted. These electrodes typically allow the recording of electrocardiographic (EKG) activity from Einthoven’s derivations (e.g., left vs. right wrist), skin conductance (previously “galvanic resistance”) from one or two hands, electromyographic (EMG) activity from neck or other relevant sites to monitor the subject’s behavior, and respiration from a sensor belt. Of note, EKG (e.g., heart rate variability), EMG, and skin galvanic resistance can provide independent measurements of the general level of brain arousal to be related to dominant posterior rsEEG rhythms supposed to reflect that arousal (Barry et al., 2011).
3.3.6 Setting of rsEEG recording parameters (sampling frequency, bandpass filter, amplification, etc…).
Standard setting when the interest of scalp rsEEG recordings is focused on frequency under 50 Hz includes a minimum sampling rate of 2502 samples per second (Hz) and 12/14-bit resolution per sample with a resolution
down to 0.5 μV. Indeed, analog filters of devices used for the recordings of rsEEG rhythms should be available with settings down to a cut-off frequency of 0.1 Hz for the high-passband filter and at least 60-70 Hz for the low-passband filter where the frequency sampling is set at 256 Hz, considering a minimum factor of 4 between the sampling frequency and the anti-aliasing filter to avoid aliasing. Analog 50 or 60 Hz notch-reject filter or high-pass filter set at 1 or 2 Hz should be set only when off-line digital filters are not available.
23
In devices used for the recording of scalp rsEEG rhythms in both clinical routine and research applications, the amplified signal for each electrode should be matched to reduce electrode-to-electrode variability to a maximum of 1% after computer-adjusted gains based on calibration pulses and bio-calibration comparisons. An even better agreement would be preferable. Calibration of devices used for recording and analysis of scalp EEG rhythms should carefully cover the whole extent of equipment used, from the electrode input box through the data processing and onto the final display.
3.4 EEG source estimation
Source estimation consists in localizing the different activated functional networks implicated in a given mental task or state. Positron emission topography (PET) and functional magnetic resonance imaging (fMRI) are not the most suitable for addressing the question of when during the mental task the different modules become active due to their low temporal resolution (> 1 s). In addition, they are not suitable to readily discriminate between sequential versus parallel activation, feedforward versus feedback processes, or how information is ‘bound’ together to form unified percepts (Michel et al., 2004). Electro- and magneto-encephalography (EEG, MEG) offer this possibility by measuring the electrical activity of neuronal cell assemblies on a submillisecond time scale. Unfortunately, these techniques face the problem that the signals measured on the scalp surface do not directly indicate the location of the active neurons in the brain due to the ambiguity of the underlying static electromagnetic inverse problem (Helmholtz, 1853).
From the distribution of electric potential on the scalp recorded by EEG, the aim is that of estimating the location and strengths of the current sources that generate the measured data. This problem of source localization is an ill-posed inverse problem. There are an infinite number of solutions that explain the measured data equally well because silent sources (i.e., sources that generate no measurable EEG signals) exist, and these can always be added to a solution without affecting the data fit. Because of this nonuniqueness, a priori information is needed to constrain the space of feasible solutions. Nonuniqueness is handled by making assumptions about the nature of the sources (e.g., number of sources, anatomical and neurophysiological constraints, prior probability density functions, norms, smoothness, correlation, covariance models, sparsity, diversity measures, spatial extent constraints, etc.). Thus, the accuracy and validity of the estimates depend to some extent on the biological correctness of the assumptions and priors adopted in our models. Therefore, priors should not only be informed by neurophysiology domain knowledge but should also be flexible and adaptive to data sets.
Several problems affect the source estimation with EEG data:
▪ Number of electrodes: the influence of the number of electrodes on source localization precision is not
linear, thus it is not true that higher number of electrodes means better localization;
▪ Volume conduction: it is possible that the EEG signal recorded in a specific site on the scalp is due to
24
▪ Common feeding: the correlated EEG signals recorded in two specific sites may be due to the activity
of a third common source and does not mean that also the source activities are dependent and thus functionally connected.
25
4 Study I: Two-year longitudinal monitoring of amnestic mild cognitive
impairment patients with prodromal Alzheimer’s disease using
topographical biomarkers derived from functional magnetic resonance
imaging and electroencephalographic activity
4.1 Introduction
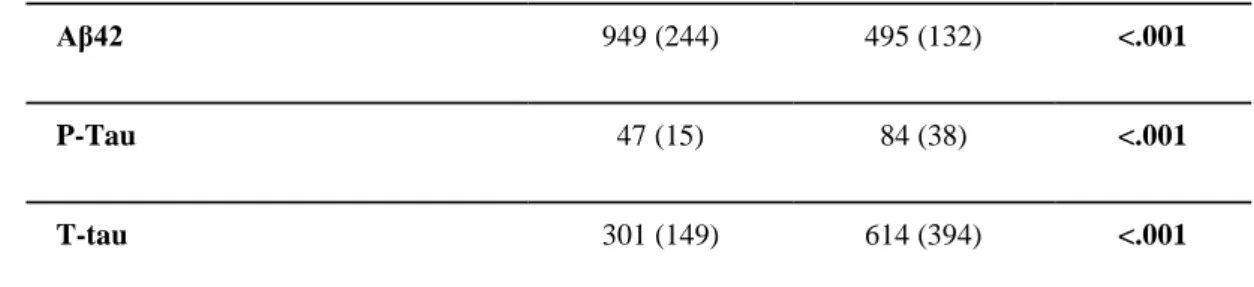
The International Working Group has recently made a useful distinction between diagnostic and topographical biomarkers of Alzheimer’s disease (AD) for research applications in patients with amnesic mild cognitive impairment (aMCI) due to the prodromal manifestation of the pathology (Dubois et al., 2014). Diagnostic biomarkers were defined as those measuring in-vivo intrinsic pathophysiological variables characterizing neurobiologically AD, namely amyloid deposition and neurofibrillary tangles in the brain. They are expected to be present at all stages of the disease, are observable even in the preclinical asymptomatic state, are not necessarily correlated with disease severity, and are indicated for inclusion of AD patients in clinical trial protocols. Diagnostic biomarkers include low doses of Aβ42 and high doses of total tau (T-tau) or phospho tau (P-tau) in cerebrospinal fluid (CSF) or evidence of significant amyloid deposition and tau aggregation in the brain in maps of positron emission tomography (PET) (Agosta et al., 2012).
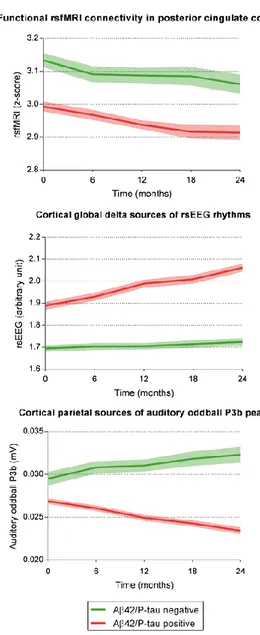
In contrast, topographic or progression biomarkers may not be specific of AD neuropathology or absent in early disease stages, but they can be very useful to monitor the progression of the disease in the brain and may be related to the kind and severity of cognitive deficits (Dubois et al., 2014). Progression markers include hippocampal atrophy or cortical thickness, assessed by structural MRI, and cortical hypometabolism in posterior cingulate, parietal, temporal, and hippocampal regions, measured by FDG-PET (Dubois et al., 2014). Of note, these topographic biomarkers are limited in the sense that they do not directly measure brain amyloid deposition and neurofibrillary tangles in AD patients, so they cannot be used as primary neuropathological endpoints in the evaluation of AD-modifying agents.
Promising candidates as topographic markers of AD are those reflecting functional aspects of brain neurotransmission and connectivity, as human cognition is the result of collective and coordinated behavior of brain networks. In this line, functional MRI accompanying resting state condition (rsfMRI) allows the computation of intrinsic hemodynamic low-frequency (< 1 Hz) statistical correlations of blood oxygenation level dependent (BOLD) signals between brain regions as a marker of brain functional connectivity (Biswal et al., 1995, Fox et al., 2005). The default mode network (DMN), which includes posterior and anterior cingulate areas, angular gyri, occipital, and parietotemporal regions, is a particularly relevant network to actively maintain resting state condition in low vigilance and self-awareness (Raichle, 2015). Several studies have shown a significant reduction of DMN brain connectivity in groups of patients with aMCI and AD dementia compared with control seniors with intact cognition (Agosta et al., 2014, Damoiseaux, 2012, Damoiseaux et
26
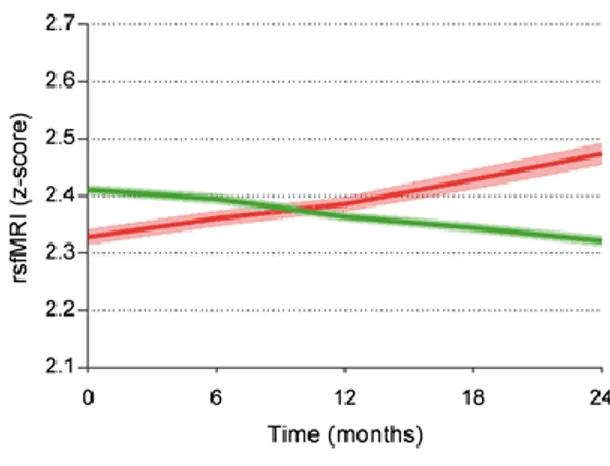
al., 2012, Teipel et al., 2016, Zhang et al., 2010, Zhou et al., 2017). As topographic biomarker of progression, these fMRI biomarkers pointed to a reduction of brain functional connectivity in DMN in aMCI and AD patients with dementia at about 1-year follow up (Damoiseaux, 2012, Damoiseaux et al., 2012, Binnewijzend et al., 2012, Dennis and Thompson, 2014) . Other candidate topographic biomarkers of AD derive from electroencephalographic (EEG) techniques, which are noninvasive, cost-effective, and can be repeated several times along disease progression without learning effects affecting paradigms using tasks. When compared to fMRI and FDG-PET, EEG techniques have a modest spatial resolution of some centimeters but a very high temporal resolution (milliseconds); that temporal resolution is ideal to investigate brain rhythms during resting state condition (i.e. resting state EEG, rsEEG) and quick brain dynamics in response to cognitive-motor events challenging attention and short episodic memory (i.e., event-related potentials, ERPs). Derived rsEEG/ERP biomarkers may reflect synchronization and connectivity between large populations of cortical pyramidal neurons in resting state conditions or during cognitive tasks [Babiloni et al., 2016]. Previous studies have shown that compared to control seniors, patients with aMCI and dementia due to AD were characterized by increased rsEEG power density at delta (< 4 Hz) and theta (4-7 Hz) frequency bands in widespread cortical regions as well as decreased rsEEG power density at alpha (8-13 Hz) and beta (14-30 Hz) frequency bands in central and posterior cortical regions (Agosta et al., 2012, Babiloni et al., 2016, Babiloni et al., 2006, Babiloni et al., 2007, Babiloni et al., 2014, Babiloni et al., 2013, Babiloni et al., 2013, Babiloni et al., 2011, Huang et al., 2000, Jelic et al., 2000, Koenig et al., 2005). Furthermore, these patients were also characterized by latency increase and amplitude decrease in late positive parietal ERPs (i.e., P3b) peaking at about 300-400 ms from the onset of a rare (20-30% of probability to occur in a sequence with frequent auditory stimuli to be ignored) auditory or visual stimulus triggering hand motor responses or mental stimulus counting (Jervis et al., 2010, Papaliagkas et al., 2008, Papaliagkas et al., 2010, Papaliagkas et al., 2011, Polich and Corey-Bloom, 2005, Tsolaki et al., 2017). As topographic biomarkers of progression, these EEG/ERP readouts pointed to increased abnormalities in delta/alpha rhythms and P3b peak in aMCI and AD patients with dementia at about 1-year follow up (Babiloni et al., 2014, 2013, Papaliagkas et al., 2008, 2011). These effects were typically discussed in relationship to death of cortical neurons, axonal pathology, and cholinergic neurotransmission deficits (Babiloni et al., 2013, Babiloni et al., 2015, 2016, 2006, 2009, Czigler et al., 2008, Jelles et al., 2008
Jeong, 2004).
The mentioned findings motivate the evaluation of rsfMRI and rsEEG/P3b as topographic biomarkers sensitive to prodromal (MCI) and dementia stages of AD. This process needs to overcome the following methodological limitations of typical multi-centric longitudinal studies: (1) retrospective nature, (2) the use of few recording sessions over time (mostly a baseline and a 1-year follow up) subjected to the confounding effect of disease onset and trajectories in aMCI patients, (3) the lack of a careful characterization of aMCI due to AD as cognitive profile (only one test of episodic memory) and positivity to standard diagnostic biomarkers of AD, and (4) the absence of a control group of aMCI patients not due to AD with expected different disease evolution over time. The European, prospective, multi-centric study entitled “PharmaCog - E-ADNI” (
http://www.pharmacog.org
) addressed such limitations. In the PharmaCog study, 147 aMCI patients were27
screened as APOE genotyping and AD diagnostic markers of CSF and followed longitudinally with clinical, neuropsychological, MRI, rsEEG/ERP, and blood markers for 24 months. The aMCI patients were separated into two sub-groups, namely those “positive” (i.e. prodromal AD) and “negative” to CSF diagnostic markers of AD (i.e. statistical thresholds for Aβ42/P-tau ratio based on APOEε4 carrier status, Marizzoni et al., 2017). Preparatory PharmaCog studies described the successful multisite MRI harmonization efforts (Albi et al., 2017, Jovicich et al., 2013, 2014 2016, Marchitelli et al., 2016, Marizzoni et al., 2015) and the characterization of the “positive” and “negative” aMCI subjects as neuropsychological, MRI (i.e., hippocampal atrophy, morphometry, and diffusion), and rsEEG/ERP at the baseline stage (Agosta et al., 2014, Galluzzi et al., 2016, Nathan et al., 2017).
This article is part of a Mini Forum on PharmaCog matrix of biomarkers of prodromal AD in patients with aMCI, which is based on four papers published in Journal of Alzheimer’s disease. The specific aim of this article is to evaluate longitudinal functional topographical biomarkers derived from rsfMRI and rsEEG/ERP data in a population of aMCI enrolled in the PharmaCog project and test if these markers can differentiate the group of the “positive” aMCI patients with prodromal AD from the “negative” aMCI subgroup during a time window of 24 months with 5 serial recordings 6 months apart. A linear mixed model adjusted by nuisance covariates was used to investigate those functional biomarkers in terms of Group (“positive” vs “negative” differences regardless of time), Time (temporal effects regardless of Group effects), and Time x Group fixed effects (differential progression between the two subgroups). In the experimental design, the observation time (i.e., 24 months) was expected to account for possible different disease stages in the “positive” and “negative” aMCI patients, while the “negative” aMCI patients were used as a control subgroup. This allowed dissociating, at least in part, cognitive impairment and functional biomarker differences between prodromal and non-prodromal AD in the aMCI subgroups. For sample homogeneity, the statistical design included aMCI data only until conversion to dementia.
4.2 Materials and Methods
4.2.1 Participants, clinical exams, and neuropsychological tests
Participants’ demographics, clinical, and neuropsychological data have been described in recent PharmaCog studies (Marizzoni et al., 2015, 2017, Galluzzi et al., 2016). Briefly, 147 aMCI patients were enrolled in 13 European memory clinics of the Innovative Medicine Initiative (IMI) PharmaCog project (
http://www.pharmacog.org
). Follow-up examinations were performed every 6 months for at least 2 years or until patient progressed to clinical dementia. The main inclusion/exclusion criteria were (1) age between 55 and 90 years; (2) complaints of memory loss by the patient, confirmed by a family relative; (3) Mini-Mental State Examination (MMSE) score of 24 and higher; (4) overall Clinical Dementia Rating score of 0.5; (5) score on the logical memory test lower than 1 standard deviation from the age-adjusted mean; (6) 15-item Geriatric28
Depression Scale score of 5 or lower; and (7) absence of significant other neurologic, systemic or psychiatric illness.
4.2.2 Functional MRI data
The multi-site 3T rsfMRI acquisition and analysis protocols have been described in recent studies from the PharmaCog project, also demonstrating high test-retest reproducibility across the Consortium with the use of harmonized MRI acquisition protocols (Jovicich et al., 2013, 2016). Briefly, 13 European clinical sites equipped with 3.0T scanners used a harmonized MRI acquisition protocol that included structural 3D T1 images (Jovicich et al., 2013) and resting state echo-planar imaging (EPI) sessions using manufacturer-provided sequence (Jovicich et al., 2016). This resulted in a sample of 882 rsfMRI datasets (147 subjects, 6 sessions per subject).
Standard brain data preprocessing was performed using SPM8 (http://www.fil.ion.ucl.ac.uk/spm) running under Matlab R2012a (The MathWorks, Inc., Natick MA, USA) and code developed in-house (Jovicich et al., 2016). The main focus of the analysis of rsfMRI data was the functional connectivity within the nodes of DMN, which is expected to be reduced in the early stages of AD (Agosta et al., 2014, Damoiseaux, 2012, Damoiseaux et al., 2012, Binnewijzend et al., 2012, Dennis and Thompson, 2014). In this line, DMN nodes of interest for this study were the following: medial prefrontal cortex (MFC), bilateral precuneus and posterior cingulate cortex (PCC), and inferior left and right parietal cortex (LPC and RPC, respectively). We also included the left attention frontal-parietal (LFP) network given its potential role in memory cognitive reserve (Agosta et al., 2014, Franzmeier et al., 2017). The anatomical characteristics of the DMN and LFP regions and the data analysis procedure are reported in previous methodological study of the Consortium (Jovicich et al., 2016). In brief, Group Independent component analysis (ICA) was performed using 10 spatial components on the concatenated data from each MRI site followed by back-reconstruction (Calhoun et al., 2001) to derive the single session DMN and attention LFP network from each subject (Jovicich et al., 2016). DMN regions-of-interest (ROIs) for functional connectivity measurements were obtained by thresholding at z > 4 the aggregate DMN site component (Jovicich et al., 2016). For each participant and session, this analysis yielded the average connectivity z-score within the whole DMN, LFP, and also considering separately each one of the separate nodes within the DMN (PCC, LPC, RPC, and MFC, Jovicich et al., 2016). These z-scores were used as functional connectivity measures and were the rsfMRI dependent variables in the statistical analyses.
The statistical analyses considered also two MRI-related nuisance regressors for each session, the white matter temporal signal-to-noise ratio (tSNR), given its high variability across sites mostly driven by hardware differences (Jovicich et al., 2016), and the median head movement.