2020-12-04T15:28:38Z
Acceptance in OA@INAF
AGB subpopulations in the nearby globular cluster NGC 6397
Title
MacLean, B. T.; Campbell, S. W.; De Silva, G. M.; Lattanzio, J.; D'ORAZI,
VALENTINA; et al.
Authors
10.1093/mnras/stx3217
DOI
http://hdl.handle.net/20.500.12386/28716
Handle
MONTHLY NOTICES OF THE ROYAL ASTRONOMICAL SOCIETY
Journal
475
Number
arXiv:1712.03340v1 [astro-ph.SR] 9 Dec 2017
MNRAS 000,1–10(2018) Preprint 16 October 2018 Compiled using MNRAS LATEX style file v3.0
AGB subpopulations in the nearby globular cluster
NGC 6397
B. T. MacLean
1⋆, S. W. Campbell
1,2, G. M. De Silva
3,4, J. Lattanzio
1,
V. D’Orazi
7,5,6, P. L. Cottrell
1,8, Y. Momany
7and L. Casagrande
9 1Monash Centre for Astrophysics, School of Physics and Astronomy, Monash University, Victoria 3800, Australia
2
Max-Planck-Institut f¨ur Astrophysik (MPA), Karl-Schwarzschild-Strasse 1, 85748 Garching, Germany
3
Australian Astronomical Observatory, 105 Delhi Rd, North Ryde, NSW 2113, Australia
4
Sydney Institute for Astronomy, School of Physics, The University of Sydney, NSW 2006, Australia
5
Research Centre for Astronomy, Astrophysics & Astrophotonics (MQAAAstro), Macquarie University, Sydney, NSW 2109, Australia
6
Department of Physics and Astronomy, Macquarie University, North Ryde, NSW 2109, Australia
7INAF Osservatorio Astronomico di Padova, vicolo dell’Osservatorio 5, I-35122, Padova, Italy
8School of Physical and Chemical Sciences, University of Canterbury, Private Bag 4800, Christchurch 8140, New Zealand 9Research School of Astronomy and Astrophysics, Australian National University, Canberra, ACT 2611, Australia
Accepted TBC. Received TBC; in original form TBC
ABSTRACT
It has been well established that Galactic Globular clusters (GCs) harbour more than one stellar population, distinguishable by the anti-correlations of light element abun-dances (C-N, Na-O, and Mg-Al). These studies have been extended recently to the asymptotic giant branch (AGB). Here we investigate the AGB of NGC 6397 for the first time. We have performed an abundance analysis of high-resolution spectra of 47 RGB and 8 AGB stars, deriving Fe, Na, O, Mg and Al abundances. We find that NGC 6397 shows no evidence of a deficit in Na-rich AGB stars, as reported for some other GCs – the subpopulation ratios of the AGB and RGB in NGC 6397 are identical, within uncertainties. This agrees with expectations from stellar theory. This GC acts as a control for our earlier work on the AGB of M 4 (with contrasting results), since the same tools and methods were used.
Key words: Galaxy: formation – Galaxy: abundances – Galaxy: globular clusters: general – stars: abundances – stars: AGB and post-AGB.
1 INTRODUCTION
It is well known that Galactic globular clusters (GCs) show star-to-star spreads in the abundances of proton-capture el-ements (primarily He, C, N, O and Na), while most GCs re-main homogeneous in the iron peak species (Carretta et al. 2009b). This spread often presents as multi-modal (as in the early low-resolution cyanogen (CN) studies of Norris 1981;
Cottrell & Da Costa 1981), with two or more distinct sub-populations being identified. One of these subsub-populations is always chemically similar to Galactic halo stars of the same metallicity – designated here as SP1 and which is inferred to contain primordial He abundances – with one or more further subpopulations found to have higher N and Na (and lower C and O) abundances – here designated collectively as SP2 (seeGratton et al. 2012, for an extensive review). These are the ubiquitous C-N and Na-O (and Mg-Al in some GCs) anti-correlations (Carretta et al. 2009a). This spread in light
⋆
E-mail: [email protected]
elemental abundance can also be inferred from narrow and intermediate band photometric data, seen as multiple red-or sub-giant branches, red-or multiple main sequences in a GC’s colour-magnitude diagram (e.g.,Milone et al. 2008,2014).
The peculiar abundance signature of SP2 stars has been observed in both evolved and unevolved stars in many clus-ters (Gratton et al. 2001), indicating that this pattern is likely to have been inherited at birth. Furthermore, the pat-tern is generally not observed elsewhere, such as the (less massive) open clusters of the Galaxy (De Silva et al. 2009;
MacLean et al. 2015); however very recently it has been sug-gested that the Galactic bulge may contain SP2-like stars (Schiavon et al. 2017). The most common explanation for this light-elemental inhomogeneity is the self-pollution hy-pothesis where the ejecta of more massive SP1 stars mixed with an early dense interstellar medium, from which SP2 stars were formed (Cannon et al. 1998;Gratton et al. 2004). Importantly, the relative fractions of each subpopula-tion remain the same through all these phases of evolusubpopula-tion, as expected from stellar evolutionary theory. However,
un-c
til recently there were no systematic surveys of asymptotic giant branch (AGB) stars. Some early (e.g., Norris et al. 1981) and more recent (Campbell et al. 2010, 2013) low-resolution spectroscopic studies of GCs found that the dis-tribution of cyanogen band strengths varies greatly between the RGB and AGB of several GCs. In particular, they found no CN-strong (i.e., SP2) AGB stars in NGC 6752, which has an extended blue horizontal branch (HB). These results hinted at differences in evolution between stars of different light elemental abundances, which are not fully predicted in standard stellar evolution theory – only stars with extreme He abundances are expected to avoid the AGB phase due to smaller envelopes in the HB phase (Dorman et al. 1993;
Campbell et al. 2013;Cassisi et al. 2014).
In this paper we use the prescription as described in
MacLean et al. (2016, hereafter ML16), where the percent-ages of RGB and AGB stars in a GC that are found to be members of SP2 are written as RRGB and RAGB, respec-tively (typical RRGB values are ∼50-70%; Carretta et al. 2010); and the SP2 AGB deficit is given by
F = (1 −RAGB RRGB
)·100%, (1)
where a value of 100% indicates that no SP2 stars reach the AGB – as reported for NGC 6752 and M 62 by
Campbell et al. (2013) and Lapenna et al. (2015), respec-tively. For clusters with extended HBs (where the bluest stars reach Teff over 15,000 K; e.g., NGC 6752, NGC 2808), an F value of up to ∼30% may be expected due to the well-established existence of AGB-manqu´e stars (which evolve directly from the HB to the white dwarf phase, avoid-ing the AGB;Greggio & Renzini 1990;Dorman et al. 1993;
Cassisi et al. 2014). Clusters whose HBs do not extend into this regime (e.g., M 4, NGC 6397) are expected to have an F value of zero per cent, with all stars in the cluster ascending the AGB.
There has been much debate as to the level and ex-istence of GC SP2 AGB deficits in recent years as more evidence has been gathered, but a definitive conclusion has yet to be reached. In fact, contradictory evidence has been presented for both NGC 6752 and M 4. For example, in Campbell et al. (2013) we found that the measured Na abundances in all NGC 6752 AGB stars were consistent with SP1, indicating F ∼ 100%.Lapenna et al.(2016) conducted an independent study of the same GC, and found that with [Na i/Fe i] abundances, F dropped to the predicted value of ∼30%. The assumption that dividing by Fe i is more accurate has recently been disputed by (Campbell et al. 2017, here-after C17). Recent studies of AGB stars in other GCs such as
Johnson et al. (2015), Garc´ıa-Hern´andez et al. (2015), and
Wang et al. (2016) have found varying values of F – see Table 4 of ML16 for a summary of F values as of July 2016. Attempts to theoretically explain SP2 AGB deficits have been outpaced by the numerous observational stud-ies that have painted a complex picture, both technically (e.g., the treatment of non-LTE) and empirically (e.g., con-tradictory results). If high SP2 AGB deficits are real, rather than being an artefact of the spectroscopic analysis (see §5
for discussion), then the most likely explanation comes from the He-enrichment of SP2 stars. This results in smaller en-velope masses on the HB (Gratton et al. 2010;Cassisi et al. 2014;Charbonnel & Chantereau 2016a,b) and such stars are
known to evolve directly to the white dwarf phase (AGB-manqu´e stars). SP2 AGB deficits above F ≃ 30% suggest that the location along the HB where this alternative evolu-tionary path begins to occur may be incorrectly predicted by theory, and/or dependent on more factors than previously thought.
Similar to the debate on AGB abundances in NGC 6752, recent studies on the archetypal GC M 4 have presented starkly different conclusions on the nature of its AGB. ML16 presented [Na/Fe] and [O/Fe] abundances for both AGB and RGB stars in M 4, reaching the conclusion that all AGB stars are consistent with being SP1 stars (i.e., F ≃ 100%). In con-trast, Lardo et al.(2017) and Marino et al.(2017) – using photometric indices and spectroscopic analysis, respectively – concluded that the spread of light elemental abundances in the AGB of M 4 is similar to the RGB (however, both studies found that their AGB samples were offset toward SP1-like abundances). If true, this is consistent with the theoretical prediction of F = 0%. However, the very re-cent study ofWang et al.(2017) showed that the spread in Na abundances of M 4’s AGB is significantly narrower than the RGB, qualitatively similar to the findings of ML16, but not as extreme. It is clear that further study of this GC is required.
If high SP2 AGB deficits are reliably demonstrated, this may impose new and important restrictions on low-mass, low-metallicity stellar evolution and/or atmospheric models; impacting the field of globular clusters, stellar evolution, and Galactic formation and archaeology.
In the current study we aim to derive AGB subpop-ulation ratios for the GC NGC 6397 for the first time. NGC 6397 is an old and metal-poor GC with a well doc-umented Na-O anti-correlation on the RGB, the range of which is smaller than many other clusters (no ‘extreme pop-ulation’ in the classification ofCarretta et al. 2009b, which is associated with high He abundance). NGC 6397 also dis-plays a Mg-Al anti-correlation (Lind et al. 2011a, hereafter L11). The short (but blue) HB of NGC 6397 extends between 8000K < Teff <10, 500K, suggesting that no stars in the cluster should evolve into AGB-manqu´e stars (Lovisi et al. 2012). In order to determine if this is the case, we have per-formed an analysis of spectra from a sample of AGB and RGB stars in NGC 6397. For each star we have derived ra-dial velocities, stellar parameters, and abundances of Fe, Na, O, Mg and Al.
2 SAMPLE SELECTION, OBSERVATIONS AND MEMBERSHIP
Our stellar targets were selected from the NGC 6397 pho-tometric dataset of Momany et al. (2003, UBVI from the ESO/MPG WFI, see Table 1). For the bright stars con-sidered here the photometric completeness is 100%, for all colours. The photometry covers the entire cluster out to at least 9 arcmin from the cluster centre (in some directions reaching to ∼ 22 arcmin). This compares with the cluster’s half-light radius of 2.9 arcmin (Harris 1996). To avoid crowd-ing problems in the core with multi-object fibre placement the sample was limited to stars outside ∼ 0.5 arcmin of the cluster centre.
AGB stars in NGC 6397
3
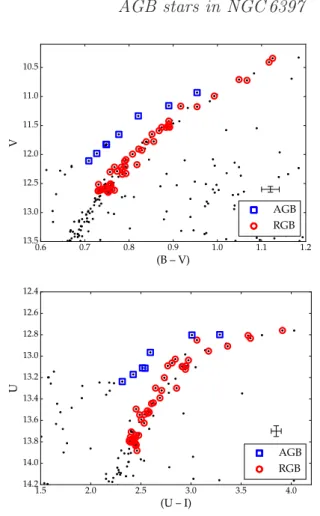
U−(U−I) space (Figure 1). AGB stars were conservatively selected – only early-AGB stars were included so as to avoid the mislabelling of stars since the AGB and RGB colours be-come similar at brighter magnitudes. We then cross-matched our selection with the 2MASS database to take advantage of the high quality astrometry and JHK photometry. 2MASS IDs and JHK photometric magnitudes for the whole sample are included in Table 1. In total our initial target sample included 9 AGB stars and 64 RGB stars. Importantly for the science goal of this study the RGB and AGB samples are spatially coincident.
High-resolution spectra were collected in July 2015 using 2dF+HERMES on the Anglo-Australian Telescope which provides R = 28, 000 spectra in four narrow win-dows; blue (4715 - 4900˚A), green (5649 - 5873˚A), red (6478 -6737˚A), and infrared (7585 - 7887˚A) (for more details on the HERMES instrument, seeDe Silva et al. 2015;Sheinis et al. 2015). Due to restrictions on 2dF fibre positioning, we were able to collect spectra for only 60 of the 73 targets. This down-sampling is random, except that priority was given to obtaining the largest possible sample of AGB stars, since the number of AGB stars is inherently low compared to RGB stars (see Fig 1, black dots). In total we collected spectra for 8 of the 9 identified AGB stars, and 52 RGB stars.
The spectra had an average signal-to-noise ratio of 70. The software package 2dfdr (AAO Software Team 2015, v6.5) was used to reduce the data for analysis. Radial veloci-ties were measured with the iraf fxcor package (Tody 1986), using a solar reference template. The mean radial velocity for NGC 6397 after non-member elimination was found to be <v> = 19.30 ± 0.48 km/s (σ = 3.71km/s), consistent with
Lind et al. (2009), who report <v> = 18.59 ± 0.16 km/s (σ = 3.61 km/s). Individual stellar radial velocities are listed in Table 1. Iterative 3-σ clipping of radial velocities and metallicities (discussed in §3.2) reduced the final RGB sam-ple to 47 stars. All of the 8 observed AGB stars were found to be members.
Apart from not sampling the inner core of the cluster we do not identify any sample bias. Moreover we have collected spectra for almost all of the AGB stars in the very wide field of view of the source photometry. The 47 RGB stars offer a solid basis for comparison. The final observed samples can be seen visually in the colour-magnitude diagrams of Figure1, over-plotted against the full photometry sample.
3 METHOD
3.1 Atmospheric parameters
For this study we have used several photometric relations to determine effective temperatures for all stars.
Typically with spectroscopic studies (such as ML16), stellar parameters are determined by requiring the exci-tation and ionisation balance of abundances from neutral and singly-ionised iron (Fe i & Fe ii, respectively) absorp-tion lines (e.g.,Sousa 2014). While a significant strength of this method is that the parameters are unaffected by pho-tometric reddening, there are also many weaknesses. Many solutions can be found for a single star, largely depending on the choice of initial parameter estimates (see C17). Ad-ditional spectroscopic uncertainties such as EW
measure-0.6 0.7 0.8 0.9 1.0 1.1 1.2 (B – V) 10.5 11.0 11.5 12.0 12.5 13.0 13.5 V AGB RGB 1.5 2.0 2.5 3.0 3.5 4.0 (U – I) 12.4 12.6 12.8 13.0 13.2 13.4 13.6 13.8 14.0 14.2 U AGB RGB
Figure 1.V−(B−V) and U−(U−I) colour-magnitude diagrams of the observed NGC 6397 RGB and AGB stars (open circles and squares, respectively), displayed over the full photometric sample ofMomany et al.(2003, black points). In the top panel, a con-stant reddening correction value of (B−V) = −0.19 was applied to all photometric data. No reddening correction was applied to the (U−I) photometry (bottom panel). We note that there are only 7 AGB stars in the U−(U−I) diagram because one star (AGB 80621) does not have a reliable U-band magnitude and was se-lected based only on its B- and V-band magnitudes.
ments, choice of atmospheric model, atomic line data, and parameter interdependence can compound this problem.
To further complicate the picture,Lapenna et al.(2014,
2016) have provided evidence that the Fe i lines of AGB stars may experience a higher degree of non-LTE effects than RGB stars at the same metallicity and effective tempera-ture. If true, then assuming ionisation balance may artifi-cially and preferentially lower the derived surface gravity of AGB stars (Lind et al. 2012). In C17 we suggested that this so-called ‘AGB iron over-ionisation problem’ does not exist (at least in NGC 6752), but may be the result of systematic offsets in photometrically-derived Teff. Regardless, Fe i lines are well known to experience some non-LTE effects (on both the RGB and AGB, and especially at low metallicities, see
Bergemann et al. 2012), so forcing ionisation balance prior to the correction of non-LTE effects may result in system-atically incorrect gravities and metallicities in all stars.
We have used the B−V and V−K re-lations from Ram´ırez & Mel´endez (2005),
Gonz´alez Hern´andez & Bonifacio (2009) and
Casagrande et al. (2010) to determine Teff estimates.
Table 1. NGC 6397 target details including data from Momany et al. (2003, UBVI photometry and target IDs) and 2MASS (Skrutskie et al. 2006, JHK photometry – gaps in data represent targets with low quality flags), radial velocities (km/s), andLind et al.
(2011a, L11) IDs. Full table available online.
ID Type 2MASS ID L11 ID V Mag B Mag U Mag I Mag J Mag H Mag K Mag RV (km/s)
56897 AGB 17400665-5335001 - 11.83 12.76 10.59 13.11 9.76 9.25 9.13 17.17 60609 AGB 17402547-5347570 - 11.65 12.62 10.37 12.97 - - - 20.68 70509 AGB 17405254-5341049 - 11.98 12.90 10.75 13.17 9.95 9.48 9.31 19.38 70522 AGB 17404076-5341046 - 11.16 12.24 9.79 12.80 8.94 8.37 8.26 18.93 73216 AGB 17403510-5339572 - 11.83 12.76 10.57 13.11 - - - 16.00 . .. ... ... ... ... ... ... ... ... ... ... ...
Table 2.Average differences in Teff between the adopted value
and each photometric estimate. Uncertainties are the 1σ standard deviations of the cluster samples. The average σ value in the last row is indicative of the spread of Teff estimates for each star.
Method ∆Teff (K) Ram (B−V)1 94 ± 45 Gonz (B−V)2 −17 ± 42 Casa (B−V)3 22 ± 98 Ram (V−K)1 69 ± 35 Gonz (V−K)2 −34 ± 34 Casa (V−K)3 −33 ± 32 IRFM −108 ± 47 Average σ ±48
1Ram´ırez & Mel´endez(2005)
2Gonz´alez Hern´andez & Bonifacio(2009) 3Casagrande et al.(2010)
Additionally, we have calculated Teff without relying on colour calibrations, by implementing the infrared flux method (IRFM) at an estimated log g of each AGB and RGB star, as described in Casagrande et al. (2010, 2014) using BVI and 2MASS JHK photometry. Thus we have seven Teff estimates for each star. These methods are depen-dent on metallicity, for which a value of [Fe/H] = −2.00 was assumed for NGC 6397. To account for interstellar extinc-tion we applied a constant correcextinc-tion of E(B − V ) = −0.19 to all stars (Gratton et al. 2003). NGC 6397 does not suffer from significant differential reddening (Milone et al. 2012).
Four stars were flagged for low quality and/or contam-ination in the 2MASS database so only the B−V relations were used to determine Teff for these stars. For all other stars, the mean of the seven Teff estimates was adopted. Table 2shows the variation between the final adopted Teff values and those of the photometric relations and IRFM. Surface gravities (log g) and micro-turbulences (vt) were determined using the empirical relations fromAlonso et al.
(1999) andGratton et al.(1996), respectively, and assuming a mass of 0.8 M⊙and 0.7 M⊙ for the RGB and AGB, re-spectively (Lovisi et al. 2012;Miglio et al. 2016). We adopt a 1σ uncertainty of ±50K for Teff (see Table2), ±0.1 dex for log g, and ±0.2 km/s for vt. Final stellar parameters for each star are included in Table5and represented visually in Figure2. 4000 4200 4400 4600 4800 5000 5200 Teff(K) 0.5 1.0 1.5 2.0 2.5 lo g g AGB RGB
Figure 2.Final stellar parameters of NGC 6397, determined from photometric relations. The method of parameter determination is described in the text. Typical uncertainties are indicated, and are the same as in Table6.
3.2 Chemical abundance determination
Chemical abundances were determined for Fe (using Fe i and Fe ii), Na (Na i), O (O i), Mg (Mg i), and Al (Al i) using the equivalent width (EW) method. EWs of absorption lines were measured using a combination of the ares (Sousa et al. 2015, v2) and iraf onedspec packages, while one-dimensional LTE abundances were determined using the moog code (Sneden 1973, June 2014 release) and model atmospheres that were interpolated from the Castelli & Kurucz (2004) grid. The line list and atomic data used for this analysis are specified in Table3. The LTE assumption has been known for many years to be an inaccurate approximation for the abundances of many elemental species. In fact, all elements determined in this work are affected by non-LTE effects which must be accounted for if the abundances are to be reliable. Fortunately, grids of non-LTE corrections now ex-ist for all of these elements in the parameter space occupied by our stellar sample.
Iron abundances determined from neutral absorption lines are known to be systematically lower than those deter-mined using singly-ionised lines (for which LTE is a realistic approximation;Lind et al. 2012). However, due to the large number of Fe lines in a stellar spectrum, it can prove dif-ficult to perform a complete line-by-line non-LTE analysis using published grids. For this reason, we performed a test to gauge the magnitude of the offsets on a subset of stars and
AGB stars in NGC 6397
5
lines. For our test, we selected a representative sub-sample of three RGB and three AGB stars from NGC 6397, and interpolated corrections from Amarsi et al.(2016b) for five Fe i lines1
and two Fe ii lines2
. The results of this test are summarised the first two rows of Table4. We did not apply these average corrections, but compare them to our LTE Fe results in Section4.
Non-LTE corrections were applied to all Na, O, Mg and Al abundances line-by-line using the most recent grids. As in ML16, Na abundances were determined using the 568 nm doublet and corrected for non-LTE effects as described in
Lind et al. (2011b) by using the web-based inspect inter-face3
, and adopting the provided ∆[Na/Fe]nlte corrections. The oxygen 777 nm triplet was measured and non-LTE cor-rections were determined by the interpolation of the recent
Amarsi et al.(2016a) grid of corrections. For Mg, the mea-sured EWs of the 571 nm and 769 nm lines were used for non-LTE determinations as described inOsorio & Barklem
(2016), using the inspect interface. The average of these two values was then used to correct the 473 nm Mg line. Finally, both the 669 nm and 783 nm doublets were used to deter-mine Al abundances, while non-LTE adjustments were inter-polated from the new results ofNordlander & Lind(2017). Average non-LTE corrections, and associated spreads are listed in Table4.
4 ABUNDANCE RESULTS & ANALYSIS Final elemental abundances are presented in Table5. Uncer-tainties cited in the table are based only on the line-to-line scatter of each abundance and do not consider additional sources of error. Using our estimated 1σ uncertainties of each stellar parameter (±50K in Teff, ±0.1 in log g, ±0.2 km/s in vt), an atmospheric sensitivity analysis was performed on a representative sub-sample and results are summarised in Table6. Finally, in Table7we present a summary of all iden-tified sources of uncertainties and adopted total abundance uncertainties.
A comparison of our results was made with that of
Lind et al. (2011b, L11) and Carretta et al. (2009a, C09), with which we had a total of 5 and 21 RGB stars in com-mon, respectively. The results of the detailed comparison of all stellar parameters and abundances are presented in Ta-ble8, which shows good agreement in all stellar parameters and slight to moderate offsets in abundance results (0.03 to 0.18 dex) between the studies. These offsets arise from different methods in analysis.
In the cases of assumed stellar mass, atmospheric model parameters, adopted non-LTE corrections, and adopted so-lar abundances, we were able to quantify the effects since the previous studies published their values for these inputs. These sources of uncertainty combine to total possible off-sets of up to +0.10 dex in each abundance. Other sources of uncertainty which we could not quantify (because we do not have the relevant information from the related studies)
1 4788.8˚A, 4839.5˚A, 5701.6˚A, 5753.1˚A and 7748.3˚A 2 6516.1˚A and 7711.7˚A
3
http://inspect-stars.net
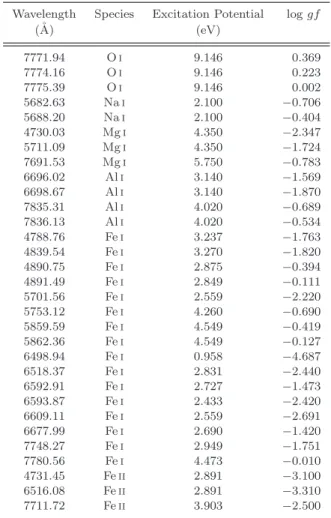
Table 3.Adopted line list used for EW measurements. Based on the line list of the GALAH collaboration (De Silva et al. 2015).
Wavelength Species Excitation Potential log gf
(˚A) (eV) 7771.94 O i 9.146 0.369 7774.16 O i 9.146 0.223 7775.39 O i 9.146 0.002 5682.63 Na i 2.100 −0.706 5688.20 Na i 2.100 −0.404 4730.03 Mg i 4.350 −2.347 5711.09 Mg i 4.350 −1.724 7691.53 Mg i 5.750 −0.783 6696.02 Al i 3.140 −1.569 6698.67 Al i 3.140 −1.870 7835.31 Al i 4.020 −0.689 7836.13 Al i 4.020 −0.534 4788.76 Fe i 3.237 −1.763 4839.54 Fe i 3.270 −1.820 4890.75 Fe i 2.875 −0.394 4891.49 Fe i 2.849 −0.111 5701.56 Fe i 2.559 −2.220 5753.12 Fe i 4.260 −0.690 5859.59 Fe i 4.549 −0.419 5862.36 Fe i 4.549 −0.127 6498.94 Fe i 0.958 −4.687 6518.37 Fe i 2.831 −2.440 6592.91 Fe i 2.727 −1.473 6593.87 Fe i 2.433 −2.420 6609.11 Fe i 2.559 −2.691 6677.99 Fe i 2.690 −1.420 7748.27 Fe i 2.949 −1.751 7780.56 Fe i 4.473 −0.010 4731.45 Fe ii 2.891 −3.100 6516.08 Fe ii 2.891 −3.310 7711.72 Fe ii 3.903 −2.500
Table 4.Summary of average non-LTE corrections for each ele-ment, with 1σ standard deviations over the stellar sample.
Species Average non-LTE Correction
RGB AGB Fe i +0.08 ± 0.04 +0.08 ± 0.03 Fe ii <0.01 <0.01 O −0.05 ± 0.01 −0.06 ± 0.01 Na −0.06 ± 0.02 −0.06 ± 0.01 Mg +0.02 ± 0.01 +0.02 ± 0.01 Al −0.06 ± 0.03 −0.05 ± 0.05
– for example different line lists, EW measurements and in-strumentation differences – most likely explain the remain-ing offsets. We note that the scatter around these offsets is typically considered a better indication of the agreement be-tween abundance analysis studies, and is consistent with the uncertainties quoted in this work. We find very good agree-ment between our study and that of L11. A curiosity here is the lack of agreement on micro-turbulence values with C09. While we adopted photometric vt (and therefore had a rel-atively small spread in values, ranging from 1.52 km/s to 1.71 km/s), C09 determined micro-turbulence spectroscopi-cally and had a very large spread in vt values (ranging from 0.11 km/s to 2.73 km/s in the overlapping sample). This
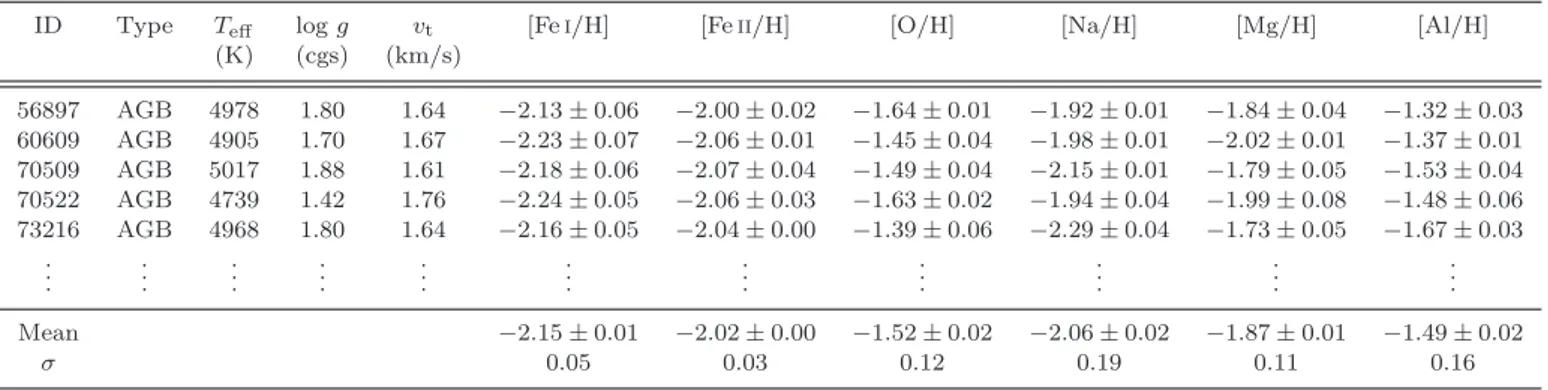
Table 5.Stellar parameters, and derived chemical abundances for each star in NGC 6397. Abundance uncertainties reflect line-to-line scatter (1σ), and do not take atmospheric sensitivities into account (see Table6, and text for discussion). The last two rows are the cluster average abundances with error on the mean, and standard deviation to indicate observed scatter. We adopt theAsplund et al.
(2009) solar abundance values. The full table is available online.
ID Type Teff log g vt [Fe i/H] [Fe ii/H] [O/H] [Na/H] [Mg/H] [Al/H]
(K) (cgs) (km/s) 56897 AGB 4978 1.80 1.64 −2.13 ± 0.06 −2.00 ± 0.02 −1.64 ± 0.01 −1.92 ± 0.01 −1.84 ± 0.04 −1.32 ± 0.03 60609 AGB 4905 1.70 1.67 −2.23 ± 0.07 −2.06 ± 0.01 −1.45 ± 0.04 −1.98 ± 0.01 −2.02 ± 0.01 −1.37 ± 0.01 70509 AGB 5017 1.88 1.61 −2.18 ± 0.06 −2.07 ± 0.04 −1.49 ± 0.04 −2.15 ± 0.01 −1.79 ± 0.05 −1.53 ± 0.04 70522 AGB 4739 1.42 1.76 −2.24 ± 0.05 −2.06 ± 0.03 −1.63 ± 0.02 −1.94 ± 0.04 −1.99 ± 0.08 −1.48 ± 0.06 73216 AGB 4968 1.80 1.64 −2.16 ± 0.05 −2.04 ± 0.00 −1.39 ± 0.06 −2.29 ± 0.04 −1.73 ± 0.05 −1.67 ± 0.03 . .. ... ... ... ... ... ... ... ... ... ... Mean −2.15 ± 0.01 −2.02 ± 0.00 −1.52 ± 0.02 −2.06 ± 0.02 −1.87 ± 0.01 −1.49 ± 0.02 σ 0.05 0.03 0.12 0.19 0.11 0.16
Table 6.Typical abundance uncertainties due to the (1σ) atmo-spheric sensitivities of a representative sub-sample of three RGB and two AGB stars in our NGC 6397 data set. Parameter vari-ations (in parentheses) are the expected uncertainties in the re-spective parameters.
∆Teff ∆log g ∆vt Total
(±50 K) (±0.1 dex) (±0.2 km/s) [Fe i/H] ±0.06 ∓0.01 ∓0.04 ±0.04 [Fe ii/H] ∓0.01 ±0.04 ∓0.01 ±0.04 [O/H] ∓0.06 ±0.04 ±0.00 ±0.07 [Na/H] ±0.03 ∓0.01 ±0.00 ±0.03 [Mg/H] ±0.03 ∓0.00 ±0.00 ±0.03 [Al/H] ±0.03 ±0.00 ±0.00 ±0.03
Table 7.Summary of typical abundance uncertainties (1σ) from each source identified in the text, and the total uncertainties (added in quadrature). The first column are the average line-to-line uncertainties of all stars, values in the second column are the total uncertainties from atmospheric sensitivities (Table 6), and the third column represents the typical uncertainties quoted in each non-LTE source (see §3.2 for citations). Note that indi-vidual Fe abundances were not corrected for non-LTE (see text for details).
Species Line-to-Line Atmospheric non-LTE Total
Fe i ±0.07 ±0.04 - ±0.08 Fe ii ±0.03 ±0.04 - ±0.05 O ±0.03 ±0.07 ±0.05 ±0.09 Na ±0.04 ±0.03 ±0.04 ±0.06 Mg ±0.04 ±0.03 ±0.03 ±0.06 Al ±0.04 ±0.03 ±0.06 ±0.08
may explain the increased offsets and scatter between C09 and our study.
The difference between our mean LTE [Fe i/H] and [Fe ii/H] abundances4
(from Table5) across our sample is <δFe>= −0.14 ± 0.01 (σ = 0.05). This is 0.06 dex lower lower than value predicted by non-LTE theory (−0.08 ± 0.05
4
δFe = [Fe i/H] − [Fe ii/H]
Table 8.The average differences in parameters and abundances between this work and that of Lind et al. (2011a, L11) and
Carretta et al.(2009a, C09). Uncertainties are standard devia-tions, and indicate the scatter around the offsets. While signifi-cant offsets exist between our work and the works of L11 and C09, the scatter around the offsets are consistent with the uncertainties quoted in this work (see text for discussion).
Parameter This study − L11 This study − C09
∆Teff −4.3 ± 20.9 19.5 ± 29.9 ∆log g 0.08 ± 0.01 0.07 ± 0.02 ∆vt 0.04 ± 0.03 0.21 ± 0.64 ∆[Fe i/H] −0.08 ± 0.03 −0.13 ± 0.05 ∆[Fe ii/H] 0.12 ± 0.03 0.05 ± 0.05 ∆[O/H] 0.06 ± 0.08 0.18 ± 0.14 ∆[Na/H] −0.03 ± 0.06 −0.17 ± 0.14 ∆[Mg/H] −0.09 ± 0.03 -∆[Al/H] 0.17 ± 0.12
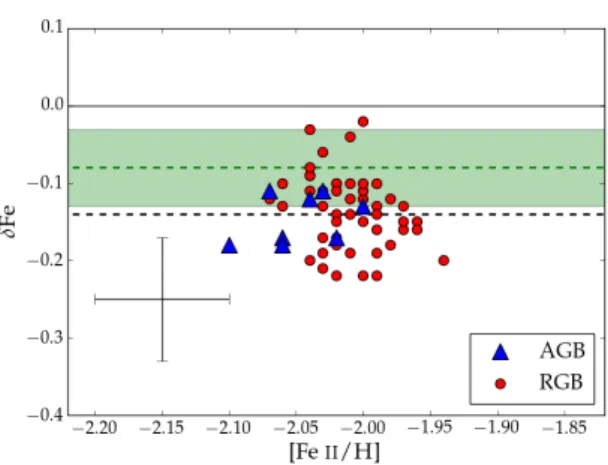
-dex, see §3.2 and Fig 3). While this could indicate slight systematics in either our Teff estimates or the non-LTE cor-rections, the uncertainty range of our <δFe> value overlaps with that of the the non-LTE predicted δFe value, indicating broad agreement. Our Fe abundances are consistent with lit-erature values (<[Fe/H]>L11= −2.08 ± 0.02). Furthermore, the difference between the average RGB and AGB δFe values is less than 0.015 dex for NGC 6397, indicating that there are no significant offsets in δFe between the two giant branches, as has been disputed for NGC 6752 (Lapenna et al. 2016;
Campbell et al. 2017). This is presented visually in Figure3, where the overall homogeneity of Fe abundances can be seen, especially between the AGB and RGB.
Abundances of elements other than iron are presented in Figures 4, 5, and 6. NGC 6397 was shown by L11 to have both Na-O and Mg-Al anti-correlations, which we find on both the RGB and AGB, along with a Na-Al correla-tion (Fig6). The abundance distributions of the two giant branches in NGC 6397 are remarkably similar – we find that RRGB ≃ RAGB ≃ 60% (compared with RRGB ≃75% in L11), indicating no SP2 AGB deficit, i.e.; F ≃ 0%. This is in agreement with current stellar evolutionary theory, which predicts that there should be no AGB-manqu´e stars in
AGB stars in NGC 6397
7
Figure 3.LTE Fe abundances for our NGC 6397 sample. Here, δFe ([Fe i/H] − [Fe ii/H]) is plotted against [Fe ii/H] abundance to highlight departures from LTE in Fe i, and the similarity be-tween the Fe abundances of the AGB and RGB. The error bars indicate typical 1σ total uncertainties on individual abundances (see Table7), while the black dashed line represents the sample average δFe value of −0.14 dex. The green dashed line represents the expected δFe value (−0.08 dex) from our non-LTE test (see §3.2) and the shaded region indicates the non-LTE uncertainties quoted inAmarsi et al.(2016b, ±0.05 dex).
−2.0 −1.9 −1.8 −1.7 −1.6 −1.5 −1.4 −1.3 −1.2 −1.1 [O/H] −2.4 −2.2 −2.0 −1.8 [N a / H ] AGB RGB
Figure 4.Na and O abundances for our NGC 6397 sample. The error bars indicate typical 1σ total uncertainties on individual abundances (see Table7).
NGC 6397, due to a HB that only extends to Teff≃10, 500 K (Greggio & Renzini 1990; Dorman et al. 1993; Lovisi et al. 2012).
Finally, in Figure7, we present Gaussian kernel density estimations (KDEs) of our AGB and RGB samples. We also plot KDEs of the RGB samples from L11 and C09 for com-parison. Constant corrections of −0.03 dex and −0.17 dex, respectively, were applied to the data of these studies based on the systematic [Na/H] offsets determined (Table8). Fig-ure7shows excellent agreement between the [Na/H] abun-dances of our current RGB and AGB samples, as well as between our RGB results and the RGB results of L11 and C09. −2.2 −2.1 −2.0 −1.9 −1.8 −1.7 −1.6 [Mg/H] −1.8 −1.7 −1.6 −1.5 −1.4 −1.3 −1.2 [A l/ H ] AGB RGB
Figure 5.Same as Figure4, but for Mg and Al.
−1.8 −1.7 −1.6 −1.5 −1.4 −1.3 −1.2 [Al/H] −2.4 −2.2 −2.0 −1.8 −1.6 [N a / H ] AGB RGB
Figure 6.Same as Figure4, but for Na and Al.
Figure 7.Gaussian kernel density estimations (KDEs) of our NGC 6397 [Na/H] abundances, along with those of Lind et al.
(2011a, L11) and Carretta et al.(2009a, C09), with systematic offsets removed (see text for details). A smoothing bandwidth of 0.06 dex (total Na uncertainty, see Table7) was applied to each of our RGB and AGB data sets, while for C09 we used a band-width of 0.11 dex, matching their total error calculations (see C09, Appendix A). L11 did not quote total abundance uncertain-ties, however their average measurement uncertainty in Na was the same as in our sample (0.04 dex), therefore we applied an identical bandwidth of 0.06 dex. The discrepancy between the relative heights of the two peaks in the L11 sample, compared to those of the other samples, may be due to the low number of stars observed in L11 (21 RGB stars).
5 DISCUSSION AND CONCLUSIONS
The primary goal of this study was to determine the proportion of SP2 stars in NGC 6397 that evolve through to the AGB phase. Since the work of Campbell et al.
(2013), the nature of AGB stars in GCs has been debated in the literature, with eight high-resolution spectroscopic studies (Johnson et al. 2015;Garc´ıa-Hern´andez et al. 2015;
Lapenna et al. 2015; MacLean et al. 2016; Lapenna et al. 2016; Wang et al. 2016; Marino et al. 2017; Wang et al. 2017) and five photometric studies (Monelli et al. 2013;
Milone et al. 2015a,b; Lardo et al. 2017; Gruyters et al. 2017) targeting the AGB directly, along with five the-oretical studies seeking to explain the anomalous ob-servations (Charbonnel et al. 2013; Cassisi et al. 2014;
Charbonnel et al. 2014; Charbonnel & Chantereau 2016a,b).
Since only HB stars with effective temperatures above ∼15,000 K are predicted to evolve directly to the white dwarf phase, the AGBs of clusters that lack an extended blue HB are expected to contain distributions in Na, O, Mg and Al abundances that are statistically indistinguish-able from those of the RGB – all cluster stars should evolve through both giant branches (i.e., F ≃ 0%). Only in clus-ters with extended blue HBs should the distribution be dif-ferent, and only with the ∼30 per cent most extreme (Na-rich/O-poor/Al-rich) AGB stars missing (i.e., F ≃ 30%
Dorman et al. 1993;Cassisi et al. 2014).
Despite a rapidly expanding literature sample of GC AGB studies, the picture is still far from clear. To date, eleven GCs have had their AGB systematically probed with high-resolution spectrographs5
, with mixed results in F values (see ML16, Table 4). However, only three clus-ters have been reported to have F ≃ 100%: NGC 6752 (Campbell et al. 2013, C17), M 62 (Lapenna et al. 2015) and M 4 (ML16). Of these, only M 62 has not been disputed by subsequent studies, but we note that this GC has not yet been studied a second time.
Lapenna et al.(2016) reported that the Fe i abundances of AGB stars in NGC 6752 are lower than predicted by stan-dard non-LTE theory. If extrapolated to Na abundance, (i.e., if Na is assumed to follow this trend), the AGB [Nai/Fei] abundance distribution moves to be in line with stellar the-ory (F ≃ 30%, as expected in GCs with an extended blue HB), contradicting the conclusions ofCampbell et al.(2013) who claimed F ≃ 100%. However, in a detailed re-analysis of their data, C17 reported that there was no iron abun-dance discrepancy in NGC 6752 when more reliable Teff scales were used, therefore concluding that the original Na results ofCampbell et al.(2013) are reliable. Furthermore, for NGC 6397 we have found no significant δFe offset be-tween the AGB and RGB, and that the Fe abundances are internally homogeneous (at the level of our uncertainties). This allows [X/H] abundances to be used for the elemental distribution analyses of the giant branches, because using [X/Fe] would introduce additional scatter (through measure-ment uncertainties), but no new information.
The abundances of NGC 6397 (Figs4-7) contain no evi-dence of a SP2 AGB deficit, with the relative distributions of
5
NGC 2808, NGC 6397, NGC 6752, 47 Tucanae, M 2, M 3, M 4, M 5, M 13, M 55 & M 62
the RGB and AGB being identical in all abundance planes (F ≃ 0%).
It is interesting to compare this result with that of M 4 by ML16, since the methods and tools we have used are al-most identical. The only difference between the NGC 6397 analysis performed in this study and that of ML16 is the method of determining atmospheric parameters. In ML16, Teff, log g and vt values were determined spectroscopically by requiring excitation and ionisation balance (as perSousa 2014), whereas for NGC 6397 these parameters were esti-mated through photometric relations. As shown in C17, Nai abundances are quite robust, that is they are not as sensitive to systematic shifts in Teff as Fei abundances. We have also shown that our Fe results are consistent with non-LTE the-ory, and show homogeneous abundances in both ionisation states, indicating that our Teff scale is accurate. For these reasons, we consider that the different method of parame-ter deparame-termination between our two studies should have little consequence on the reliability of our [Na/H] abundances.
Thus our NGC 6397 result further strengthens the con-clusions of ML16 whose analysis was almost identical, but whose results are in contradistinction. We therefore suggest that our original M 4 conclusions (F ≃ 100, but with some uncertainty) are sound, and that our NGC 6397 results show – by providing a control sample – that our method of analysis does not artificially shift AGB abundances toward SP1-like distributions.
As stated in ML16, our M 4 result (F ≃ 100) is in clear contradiction with stellar theory – we can think of no reason why SP2 stars in M 4 should avoid the AGB phase, since the maximum Teff of its HB is ∼9000 K (Marino et al. 2011). This is especially true in light of our result for NGC 6397 – which has a bluer HB than M 4, but F ≃ 0%. In the search for a possible explanation of our results, and those of
Campbell et al.(2013,2017, NGC 6752) andLapenna et al.
(2015, M 62), we consider three possible causes of the low-Na signature of AGB stars in M 4, NGC 6752 & M 62:
(i) The low-Na signature is intrinsic – HB stars are be-coming AGB-manqu´e stars at a much lower HB Teff than predicted. This is the most commonly cited explanation in the literature.
(ii) The atmospheric models of some AGB stars are in-correctly determined, but only in particular sections of the GC AGB parameter space. This would result in incorrectly predicted absorption line profiles, and represent a significant ‘blind spot’ in the standard spectroscopic method.
(iii) All Na-rich stars in these three GCs are undergoing an unknown burning or mixing process, between the HB and AGB, that acts to deplete Na in the envelope and leave only a low-Na signature by the early AGB phase.
Investigating these hypotheses is beyond the scope of the present work. However, we note that (iii) is almost cer-tainly impossible since there is no known mechanism that can destroy Na, while simultaneously creating O, in the in-terior conditions found in these stars.
More generally we note that, of the GCs which have been analysed for SP2 AGB deficits, not a single deficit (or lack thereof) claim has been confirmed by a different working group, or with independently selected targets. This suggests that the methods that are used require detailed investigation and checking, such as performed in C17. This is especially
AGB stars in NGC 6397
9
pertinent for M 4, for which the three existing studies all give different values of F . We will aim to resolve this issue in a forthcoming study. Finally, we suggest another potential next step in investigating this problem could be a controlled spectroscopic study of an ‘HB second parameter’ pair or trio of clusters with similar metallicity and age, but different HB-morphology (such as NGC 288, NGC 362, and NGC 1851), in an attempt to disentangle the effect of global GC parameters on apparent AGB deficits.
ACKNOWLEDGEMENTS
Based in part on data acquired through the AAO, via pro-gram 15A/21 (PI Campbell). Part of this work was sup-ported by the DAAD (PPP project 57219117) with funds from the German Federal Ministry of Education and Re-search (BMBF). BTM acknowledges the financial support of his Australian Postgraduate Award scholarship. SWC ac-knowledges federal funding from the Australian Research Council though the Future Fellowship grant entitled “Where are the Convective Boundaries in Stars?” (FT160100046). VD acknowledges support from the AAO distinguished vis-itor program 2016. LC gratefully acknowledges support from the Australian Research Council (grants DP150100250, FT160100402). We thank Anish Amarsi and Thomas Nord-lander for providing non-LTE corrections, and Michael Brown, Alexander Heger, and the referee for useful conver-sations, comments, and advice.
REFERENCES
AAO Software Team 2015, 2dfdr: Data reduction software, As-trophysics Source Code Library (ascl:1505.015)
Alonso A., Arribas S., Mart´ınez-Roger C., 1999,A&AS,140, 261
Amarsi A. M., Asplund M., Collet R., Leenaarts J., 2016a,
MNRAS,455, 3735
Amarsi A. M., Lind K., Asplund M., Barklem P. S., Collet R., 2016b,MNRAS,463, 1518
Asplund M., Grevesse N., Sauval A. J., Scott P., 2009,ARA&A,
47, 481
Bergemann M., Lind K., Collet R., Magic Z., Asplund M., 2012,
MNRAS,427, 27
Campbell S. W., Yong D., Wylie-de Boer E. C., Stancliffe R. J., Lattanzio J. C., Angelou G. C., Grundahl F., Sneden C., 2010, MmSAI,81, 1004
Campbell S. W., et al., 2013,Nature,498, 198
Campbell S. W., MacLean B. T., D’Orazi V., Casagrande L., de Silva G. M., Yong D., Cottrell P. L., Lattanzio J. C., 2017,
A&A,605, A98
Cannon R. D., Croke B. F. W., Bell R. A., Hesser J. E., Stathakis R. A., 1998,MNRAS,298, 601
Carretta E., et al., 2009a,A&A,505, 117
Carretta E., Bragaglia A., Gratton R., D’Orazi V., Lucatello S., 2009b,A&A,508, 695
Carretta E., Bragaglia A., Gratton R. G., Recio-Blanco A., Lu-catello S., D’Orazi V., Cassisi S., 2010,A&A,516, A55
Casagrande L., Ram´ırez I., Mel´endez J., Bessell M., Asplund M., 2010,A&A,512, A54
Casagrande L., et al., 2014,MNRAS,439, 2060
Cassisi S., Salaris M., Pietrinferni A., Vink J. S., Monelli M., 2014,A&A,571, A81
Castelli F., Kurucz R. L., 2004, ArXiv Astrophysics e-prints (astro-ph/0405087),
Charbonnel C., Chantereau W., 2016a,A&A,586, A21
Charbonnel C., Chantereau W., 2016b,A&A,586, A21
Charbonnel C., Chantereau W., Decressin T., Meynet G., Schaerer D., 2013,A&A,557, L17
Charbonnel C., Chantereau W., Krause M., Primas F., Wang Y., 2014,A&A,569, L6
Cottrell P. L., Da Costa G. S., 1981,ApJL,245, L79
De Silva G. M., Gibson B. K., Lattanzio J., Asplund M., 2009,
A&A,500, L25
De Silva G. M., et al., 2015,MNRAS,449, 2604
Dorman B., Rood R. T., O’Connell R. W., 1993,ApJ,419, 596
Garc´ıa-Hern´andez D. A., M´esz´aros S., Monelli M., Cassisi S., Stet-son P. B., Zamora O., Shetrone M., Lucatello S., 2015,ApJL,
815, L4
Gonz´alez Hern´andez J. I., Bonifacio P., 2009,A&A,497, 497
Gratton R. G., Carretta E., Castelli F., 1996, A&A,314, 191
Gratton R. G., et al., 2001,A&A,369, 87
Gratton R. G., Bragaglia A., Carretta E., Clementini G., Desidera S., Grundahl F., Lucatello S., 2003,A&A,408, 529
Gratton R., Sneden C., Carretta E., 2004,ARA&A,42, 385
Gratton R. G., D’Orazi V., Bragaglia A., Carretta E., Lucatello S., 2010,A&A,522, A77
Gratton R. G., Carretta E., Bragaglia A., 2012,A&A˜Rev.,20, 50
Greggio L., Renzini A., 1990,ApJ,364, 35
Gruyters P., Casagrande L., Milone A. P., Hodgkin S. T., Serenelli A., Feltzing S., 2017,A&A,603, A37
Harris W. E., 1996,AJ,112, 1487
Johnson C. I., et al., 2015,AJ,149, 71
Lapenna E., Mucciarelli A., Lanzoni B., Ferraro F. R., Dalessan-dro E., Origlia L., Massari D., 2014,ApJ,797, 124
Lapenna E., Mucciarelli A., Ferraro F. R., Origlia L., Lanzoni B., Massari D., Dalessandro E., 2015,ApJ,813, 97
Lapenna E., et al., 2016,ApJL,826, L1
Lardo C., Salaris M., Savino A., Donati P., Stetson P. B., Cassisi S., 2017,MNRAS,466, 3507
Lind K., Primas F., Charbonnel C., Grundahl F., Asplund M., 2009,A&A,503, 545
Lind K., Charbonnel C., Decressin T., Primas F., Grundahl F., Asplund M., 2011a,A&A,527, A148
Lind K., Asplund M., Barklem P. S., Belyaev A. K., 2011b,A&A,
528, A103
Lind K., Bergemann M., Asplund M., 2012,MNRAS,427, 50
Lovisi L., Mucciarelli A., Lanzoni B., Ferraro F. R., Gratton R., Dalessandro E., Contreras Ramos R., 2012,ApJ,754, 91
MacLean B. T., De Silva G. M., Lattanzio J., 2015, MNRAS,
446, 3556
MacLean B. T., Campbell S. W., De Silva G. M., Lattanzio J., D’Orazi V., Simpson J. D., Momany Y., 2016, MNRAS,
460, L69
Marino A. F., Villanova S., Milone A. P., Piotto G., Lind K., Geisler D., Stetson P. B., 2011,ApJL,730, L16
Marino A. F., et al., 2017,ApJ,843, 66
Miglio A., et al., 2016,MNRAS,461, 760
Milone A. P., et al., 2008,ApJ,673, 241
Milone A. P., Marino A. F., Piotto G., Bedin L. R., Anderson J., Aparicio A., Cassisi S., Rich R. M., 2012,ApJ,745, 27
Milone A. P., et al., 2014,MNRAS,439, 1588
Milone A. P., et al., 2015a,MNRAS,447, 927
Milone A. P., et al., 2015b,ApJ,808, 51
Momany Y., Cassisi S., Piotto G., Bedin L. R., Ortolani S., Castelli F., Recio-Blanco A., 2003,A&A,407, 303
Monelli M., et al., 2013,MNRAS,431, 2126
Nordlander T., Lind K., 2017, preprint, (arXiv:1708.01949)
Norris J., 1981,ApJ,248, 177
Norris J., Cottrell P. L., Freeman K. C., Da Costa G. S., 1981,
ApJ,244, 205
Osorio Y., Barklem P. S., 2016,A&A,586, A120
Ram´ırez I., Mel´endez J., 2005,ApJ,626, 465
Schiavon R. P., et al., 2017,MNRAS,465, 501
Sheinis A., et al., 2015,Journal of Astronomical Telescopes, Instruments, and Systems,
1, 035002
Skrutskie M. F., et al., 2006,AJ,131, 1163
Sneden C. A., 1973, PhD thesis, The University of Texas at Austin Sousa S. G., 2014, preprint, (arXiv:1407.5817)
Sousa S. G., Santos N. C., Adibekyan V., Delgado-Mena E., Is-raelian G., 2015,A&A,577, A67
Tody D., 1986, in Crawford D. L., ed., Proc. SPIE Vol. 627, In-strumentation in Astronomy VI. p. 733
Wang Y., Primas F., Charbonnel C., Van der Swaelmen M., Bono G., Chantereau W., Zhao G., 2016,A&A,592, A66
Wang Y., Primas F., Charbonnel C., Van der Swaelmen M., Bono G., Chantereau W., Zhao G., 2017, preprint, (arXiv:1708.07634)