*Corresponding author. E-mail address: [email protected]
INTRODUCTION
Wood mice of the genus Apodemus Kaup, 1829 are widespread in temperate areas of the Palaearctic region. Traditionally, the genus has been subdivided according to Zimmermann (1962) into three subgen-era: Apodemus, known from central Europe to eastern Asia, western Palaearctic Sylvaemus, and Eastern Palaearctic Alsomys (see Musser & Carleton, 1993 for a general review). Recently, however, Musser et al. (1996), focusing on the Apodemus–Sylvaemus sys-tematic problem, have separated wood mice into three groups: Sylvaemus (A. sylvaticus, A. flavicollis, A.
uralensis, A. mystacinus, A. fulvipectus, A. hermonen-sis, A. alpicola, A. arianus, A. hyrcanicus, A. ponticus, A. rusiges, A. wardi), Apodemus (A. agrarius, A. chevrieri, A. speciosus, A. peninsulae, A. latronum, A. draco, A. semotus, A. gurkha), and Argenteus (A. argenteus). Serizawa et al. (2000), on the basis of DNA
sequences of nuclear (the first exon of the IRBP gene) as well as mitochondrial (cytochrome b) markers, con-firmed this classification, but replaced the term
‘Syl-vaemus group’ with ‘Sylvaticus group’ and introduced
a fourth group for the Asiatic species A. gurkha (‘Gurkha group’).
In the last three decades, the attention of zoologists has mainly been focused on the European species, A.
sylvaticus Linnaeus 1758, and A. flavicollis Melchior
1834, characterized by widely overlapping ranges and
Genetic variation and evolution in the genus
Apodemus (Muridae: Rodentia)
MARIA GRAZIA FILIPPUCCI
1, MILO ˇS MACHOLÁN
2* and JOHAN R. MICHAUX
3 1Department of Biology, University of Rome ‘Tor Vergata’, Via della Ricerca Scientifica,
I-00133 Rome, Italy
2
Institute of Animal Physiology and Genetics, Academy of Sciences of the Czech Republic,
Veveˇrí 97, CZ-60200 Brno, Czech Republic
3
Laboratory of Palaeontology, Institut des Sciences de l’Evolution de Montpellier (UMR 5554),
University of Montpellier II, Place E. Bataillon, F-34095 Montpellier Cedex 05, France
Received June 2001; accepted for publication November 2001Genetic variation was studied using protein electrophoresis of 28–38 gene loci in 1347 specimens of Apodemus
agrar-ius, A. peninsulae, A. flavicollis, A. sylvaticus, A. alpicola, A. uralensis, A. cf. hyrcanicus, A. hermonensis, A. m. mystacinus and A. m. epimelas, representing 121 populations from Europe, the Middle East, and North Africa. Mean
values of heterozygosity per locus for each species ranged from 0.02 to 0.04. Mean values of Nei’s genetic distance (D) between the taxa ranged from 0.06 (between A. flavicollis and A. alpicola) to 1.34 (between A. uralensis and A.
agrarius). The highest values of D were found between A. agrarius and other Apodemus species (0.62–1.34). These
values correspond to those generally observed between genera in small mammals. Our data show that A. agrarius and A. peninsulae are sister species, well-differentiated from other taxa. High genetic distance between A. m.
mystac-inus and A. m. epimelas leads us to consider them distinct species and sister taxa to other Western Palaearctic
species of the subgenus Sylvaemus. The data also suggest a recent separation of members of the latter group from a common ancestor, and subsequent rapid radiation, making it difficult to infer phylogenetic relationships. Some taxonomic implications of the results are discussed further. © 2002 The Linnean Society of London, Biological
Journal of the Linnean Society, 2002, 75, 395–419.
ADDITIONAL KEYWORDS: electrophoresis – genetic differentiation – Palaearctic region – phylogeny –
by morphological convergence in the southern parts of their ranges. According to several authors (Engländer & Amtmann, 1963; Witte, 1964; Amtmann, 1965), this convergence is the consequence of introgressive hybridization. However, this possibility was excluded by Niethammer (1969) on morphological evidence, and by numerous authors after allozyme studies (Engel et al., 1973; Debrot & Mermod, 1977; Benmehdi
et al., 1980; Csaikl et al., 1980; Nascetti et al., 1980;
Gemmeke & Niethammer, 1981; Fraguedakis-Tsolis
et al., 1983; Nascetti & Filippucci, 1984; Gebczy ´nski et al., 1986), mtDNA restriction and species-specific
PCR amplification patterns (Michaux et al., 1998a,b, 2001; Libois et al., 2001), and sequence studies (Che-lomina et al., 1998; Serizawa et al., 2000; Suzuki, Tsuchiya & Takezaki, 2000).
In Europe, the subgenus Sylvaemus is represented by five species: A. flavicollis, A. sylvaticus, A. alpicola Heinrich 1952, A. microps Kratochvíl & Rosick ´y, 1952, and A. mystacinus Danford & Alston 1877 (Fig. 1).
Apodemus alpicola, originally described as a high
alti-tude subspecies of A. flavicollis, was shown to be a morphologically (Storch & Lütt, 1989) and genetically (Vogel et al., 1991; Filippucci, 1992) well-defined species. The taxon microps has recently been syn-onymized with A. uralensis (Pallas 1811) (Vorontsov
et al., 1992; Filippucci et al., 1996; Mezhzherin, 1996;
Bellinvia et al., 1999; Macholán et al., 2001a).
Apodemus mystacinus, occurring on the Balkan
Peninsula and the Middle East, is clearly morpholog-ically distinguishable from other Sylvaemus species and therefore was separated into the subgenus
Karsto-mys Martino 1939 by some authors (Rietschel &
Storch, 1974; Storch, 1975). However, the validity of
Karstomys has not been generally accepted (Corbet,
1978; Niethammer, 1978; Musser et al., 1996). Accord-ing to Felten et al. (1973), two subspecies should be recognized for the species: epimelas, distributed on the Balkan Peninsula, and nominal mystacinus of the Middle East (Fig. 1). Storch (1977) hypothesized a spe-cific status for the two taxa, based on differences in the first upper molar found in the Recent as well as in Pleistocene populations. No direct genetic comparison between populations of A. mystacinus from different geographical areas has hitherto been carried out.
In North Africa only A. sylvaticus is present, in the Maghreb region. Saint Girons & Van Bree, 1963), investigating morphological traits, suggested three different subspecies to be present in North Africa: A.
s. hayi (Waterhouse, 1837), inhabiting the
Mediter-ranean regions of the Maghreb; A. s. rufescens Saint Girons & van Bree, 1963, inhabiting the Hauts Plateau in Algeria and arid forests in Morocco; and A. s. ifranensis, which has a range covering the Middle Atlas from the east of Khénifra to the region of Oulmes and to Ifrane (Saint Girons & van Bree, 1963; Saint
Girons, 1972). However, Kock & Felten (1979) found no differences between A. s. rufescens and A. s. hayi and according to Kowalski & Rzebik-Kowalska (1991) and to Filippucci (1992), there are no differences among the North African populations of A. sylvaticus. Libois et al. (2001), on the basis of mtDNA RFLPs, did not find any genetic difference between the three North African subspecies and suggested combining A.
s. rufescens and A. s. ifranensis within A. s. hayi.
Recently, zoologists have focused on south-eastern Europe and the Middle East, where several taxa, pre-viously assigned to A. sylvaticus, have been recognized as distinct species. In Israel, a new species, A.
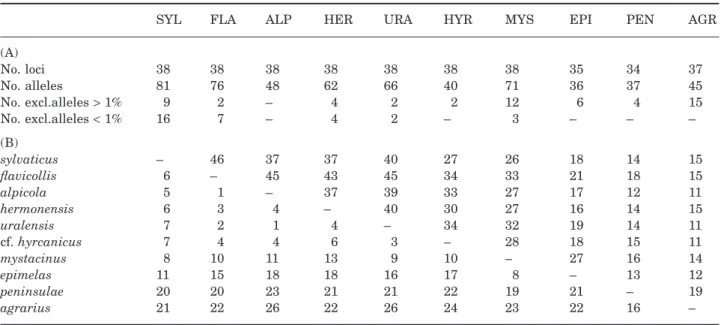
hermo-nensis Filippucci, Simson & Nevo, 1989, was identified Figure 1. A schematic depiction of the geographical distri-bution of (top) A. uralensis, A. peninsulae and A. agrarius in Eurasia; and (bottom) A. flavicollis, A. sylvaticus, A. alpi-cola, A. ponticus, A. fulvipectus, A. hermonensis, A. uralen-sis, A. hyrcanicus, A. mystacinus epimelas and A. m. mystacinus in Europe and the Middle East, A. uralensis is indicated with a solid line A. fulvipectus and A. hermonen-sis (both indicated with a dashed line) are most probably conspecific. Compiled from Corbet (1978), Musser & Carleton (1993), Mezhzherin (1997b), Zagorodnyuk et al. (1997), Mitchell-Jones et al. (1999), and Macholán et al. (2001a).
by biometric and protein electrophoretic analyses. Filippucci et al. (1989) found A. flavicollis (apart from
A. mystacinus) to be the most common species in
Israel, instead of A. sylvaticus as then commonly believed.
Several subspecies of A. sylvaticus (uralensis of the southern Ural, charkovensis of Ukraine, mosquensis of the Moscow region, ciscaucasicus of the northern Caucasus, and tscherga of the Altai) appeared to be geographical forms of another species, A. uralensis, according to allozyme data (Mezhzherin & Mikhailenko, 1991). (Recently, the taxa mosquensis and ciscaucasicus have been asserted to deserve the specific status within the superspecies A. uralensis by Orlov et al. (1996), mostly on the basis of cytogenetic studies.) A new species was also described from Ukraine, originally named A. falzfeini (Mezhzherin & Zagorodnyuk, 1989), and later synonymized with A.
fulvipectus Ognev, 1924 from the Caucasus (Vorontsov et al., 1992). Vorontsov et al. (1992) used
morpho-logical, chromosomal and allozyme data to investigate the systematics of the Sylavemus group in the Cau-casus and TranscauCau-casus. They proposed that four species inhabited those regions (Fig. 1): A. ponticus Sviridenko 1936, previously considered subspecies of A. flavicollis (Mezhzherin, 1991), A. hyrcanicus Vorontsov, Boyeskorov & Mezhezherin 1992, A.
uralensis, and A. fulvipectus Mezhzherin, Boyeskorov
& Vorontsov 1992 (Vorontsov et al., 1992).
In western Anatolia, four Sylvaemus species were suggested by electrophoretic and morphological analy-ses (Filippucci et al., 1996). Apodemus sylvaticus, pre-viously considered widely distributed in Asian Turkey, was shown to be an extremely rare species there, restricted to a small area near the coast of the Black Sea. On the contrary, A. flavicollis, previously consid-ered to be from the Caucasus and eastern Anatolia only, appeared to be widely distributed throughout the area studied, as also did A. hermonensis, previously known only from Mt. Hermon in Israel. Finally, A.
uralensis was found to be confined to the humid
moun-tainous areas of northern Asia Minor. These results were subsequently confirmed by Macholán et al. (2001a) who extended the study to eastern Turkey, Armenia, and to the western, northern and southern parts of Iran.
Nevertheless, our knowledge of the systematics of wood mice from Iran is still incomplete and the data from eastern parts of Iran and Nepal as well are rather fragmentary. Being previously attributed to A.
sylvaticus according to external morphological
charac-ters, populations from this area displayed a higher genetic affinity to A. flavicollis than to A. sylvaticus, although differentiated from both of them (Darviche
et al., 1979; Gemmeke & Niethammer, 1982).
Recently, Musser & Carleton (1993), in their synopsis
of mammal species of the world, suggested A. arianus (Blanford 1881) inhabited Iran, and A. wardi (Wroughton 1908) inhabited Nepal, Kashmir, Pak-istan, AfghanPak-istan, and north-western Iran. According to these authors, A. fulvipectus (in the north), and A.
ponticus (in the north-west) probably also occur in
Iran. More recently, Mezhzherin (1997b) and Zagorod-nyuk et al. (1997) have suggested A. arianus to be an older synonym of the taxa falzfeini, chorassanicus,
fulvipectus, and hermonensis.
Genetic differentiation and/or phylogenetic rela-tionships among species of the genus Apodemus have been studied by many authors using both biochemical and molecular methods (see Michaux et al., 2002 and references therein). Because of the high genetic dif-ferentiation between A. agrarius and all other species from the western Palaearctic region, several authors (Bonhomme et al., 1985; Britton-Davidian et al., 1991; Filippucci, 1992; Filippucci et al., 1996; Mezhzherin, 1997b) have proposed Sylvaemus to be a distinct genus. Hartl et al. (1992), studying allozyme differen-tiation at 36 loci in four Apodemus species (A.
sylvati-cus, A. flavicollis, A. microps, and A. agrarius), Mus,
and Rattus, and using Microtus, Clethrionomys, and
Cricetus as outgroups, found A. agrarius to be more
distant to other Apodemus species than were Mus and
Rattus on a UPGMA phenogram, however, cladistic
analysis of the same data showed monophyly of all the
Apodemus taxa. Hartl et al. (1992) concluded that the
results of electrophoretic studies had been greatly biased because of the unequal rates of genic evolution among the taxa and suggested using a cladistic approach for the inference of phylogenetic relation-ships within the genus. More recently, monophyly of the genus Apodemus has been corroborated by molec-ular studies (Chelomina et al., 1998; Serizawa et al., 2000; Michaux et al., 2002). Musser et al. (1996) rec-ommended retention of the generic name Apodemus pending the systematic revision of the entire complex of species.
Notwithstanding conflicting results of different studies regarding phylogenetic relationships both within and among subgenera of the genus Apodemus, recent morphological, biochemical and molecular analyses seem to agree in that there are 3–4 phy-logenetic lineages within the genus (Sylvaemus/
Sylvaticus, Apodemus, Argenteus, Gurkha), however,
elevating these lineages to separate genera is not sub-stantiated. Although A. mystacinus and all Sylvaemus species most probably form a monophyletic group, relationships within the latter group remain unclear and also evidence supporting inclusion of A.
mystaci-nus within a separate gemystaci-nus Karstomys (Martin et al.
2000) is inconclusive (Michaux et al., 2002).
The purpose of the present study is to extend the analysis carried out by Filippucci (1992) on allozyme
variation at 28–33 loci in 615 specimens representing 51 populations of seven Apodemus species (A.
sylvati-cus, A. flavicollis, A. alpicola, A. microps [uralensis], A. hermonensis, A. mystacinus, and A. agrarius),
increasing the number of taxa and more than doubling the number of specimens and populations investi-gated. Data are presented on allozyme variation at 28–38 loci in the following taxa: A. sylvaticus, A.
flav-icollis, A. alpicola, A. hermonensis, A. uralensis, A. mystacinus epimelas, A. m. mystacinus, A. peninsulae, A. agrarius, and an unknown taxon from northern
Iran we provisionally call A. cf. hyrcanicus (see Macholán et al., 2001a for details). Genetic differenti-ation and the phylogenetic reldifferenti-ationships within and among species of the genus Apodemus are discussed.
MATERIAL AND METHODS
Electrophoretic analysis was carried out on 1347 spec-imens representing 121 populations of ten taxa of
Apodemus from Europe, the Middle East and North
Africa. Collecting sites, their abbreviations, and numbers of specimens examined for each population are presented in Appendix 1.
Tissues of each specimen were preserved at -80°C until processed. Homogenates for electrophoresis were obtained from portions of muscle or kidney tissue crushed in distilled water. Genic variation was assessed using standard horizontal gel electro-phoresis. Homogenates obtained from muscle were processed for the following enzymatic systems: a-glycerophosphate dehydrogenase (E.C. 1.1.1.8; aGpdh), sorbitol dehydrogenase (E.C. 1.1.1.14; Sdh). lactate dehydrogenase (E.C. 1.1.1.27; Ldh-1, Ldh-2), malate dehydrogenase (E.C. 1.1.1.37; Mdh-1, Mdh-2), malic enzyme (E.C. 1.1.1.40; Me-1, Me-2), isocitrate dehydrogenase (E.C. 1.1.1.42; Idh-1, Idh-2), phosphogluconate dehydrogenase (E.C. 1.1.1.44;
6-Pgdh), glucose-6-phosphate dehydrogenase (E.C.
1.1.1.49; G6pdh), glyceraldehyde-3-phosphate dehy-drogenase (E.C. 1.2.1.12; G3pdh), indophenol oxidase (E.C. 1.15.1.1; Ipo-, Ipo-2), nucleoside phosphorylase (E.C. 2.4.2.1; Np), glutamate-oxalacetate transami-nase (E.C. 2.6.2.1; Got-1, Got-2), hexokitransami-nase (E.C. 2.7.1.1; Hk-1, Hk-2), creatine kinase (E.C. 2.7.3.2; Ck), adenylate kinase (E.C. 2.7.4.3; Adk), phosphogluco-mutase (E.C. 2.5.7.1; Pgm-1, Pgm-2), esterases (E.C. 3.1.1.1; Est-1, Est-2, Est-3), leucyl aminopeptidase (E.C. 3.4.11; Lap), peptidases (E.C. 3.4.11; 1,
Pep-2, Pep-3), acid phosphatase (E.C. 3.1.3.2; Acph),
adeno-sine deaminase (E.C. 3.5.4.4; Ada), aldolase (E.C. 4.1.2.13; Aldo), fumarase (E.C. 4.2.1.2; Fum), mannose phosphate isomerase (E.C. 5.3.1.8; Mpi), and glucose phosphate isomerase (E.C. 5.3.1.9; Gpi). Homogenates obtained from kidney were processed for alcohol dehy-drogenase (E.C. 1.1.1.1; Adh). The electrophoretic
pro-cedures used were those described by Filippucci et al., 1988).
Isozymes were numbered in order of decreasing mobility from the most anodal one. Allozymes were numbered according to their mobility, relative to the most common allele (designed 100) in the reference population of A. sylvaticus from Burano (SBUR). Allozyme data were analysed using allele frequencies as input. Intrapopulation genetic variation was esti-mated as the mean number of alleles per locus (A), pro-portion of polymorphic loci in the population (P1%),
mean observed heterozygosity per locus (Ho), and
mean expected heterozygosity per locus (genetic diver-sity, He; Nei, 1978). Genetic structure within and
among conspecific populations was estimated by means of F-statistics (Wright, 1965). The amount of genetic divergence between populations was esti-mated with the indices of Nei’s standard and unbiased genetic distance (Nei, 1972, 1978) and with chord dis-tance introduced by Cavalli-Sforza & Edwards (1967; see Macholán et al., 2001b for the rationale behind using these indices; see also Swofford et al., 1996 for statistical details). BIOSYS-1 (Swofford & Selander, 1981) was used for all these procedures. Matrices of Nei’s (1978) genetic distances were compared to geo-graphical distances with the NTSYS-pc program (Rohlf, 1997) by comparing the observed with ‘random’ values of the Mantel Z statistic as obtained from 5000 permutations (Mantel, 1967). Matrices of geographical distances (rounded to 5 km, seas bypassed) were created using Microsoft„Encarta„World Atlas (1998
edition).
In total, 38 gene loci were studied, however, indices of genetic variation and distance were calculated on a lower number of loci, because for some of the species data were missing at a few loci. The present study includes new as well as previously reported data (Nascetti & Filippucci, 1984; Filippucci et al., 1989; Filippucci, 1992; Filippucci et al., 1996; Michaux et al., 1996a; Macholán et al., 2001a). Interspecific diver-gence was calculated on 34 shared loci, whereas intraspecific differentiation was evaluated on 28 loci in A. flavicollis, 29 loci in A. sylvaticus, 32 loci in A.
mystacinus, 34 loci in A. alpicola, A. agrarius and A. peninsulae, and 36 loci in A. hermonensis, A. uralen-sis and A. cf. hyrcanicus.
Two loci (Adh and Acph) studied in Filippucci (1992) and Filippucci et al. (1996) were not included in the evaluation of genetic distances, because for some taxa (A. peninsulae, A. cf. hyrcanicus, and A. m. epimelas) data at these loci were missing. However, four new loci (Est-1, Est-2, Pep-1, and Pep-2) not included in Filip-pucci (1992) were considered for the analysis of inter-specific differentiation.
Dendrograms of genetic relationships among popu-lations within individual species were obtained using
the neighbour-joining method (Saitou & Nei, 1987) based both on Nei’s (1978) and Cavalli-Sforza & Edwards’ (1967) distances. In order to reveal phyloge-netic relationships among the Apodemus species studied, we employed four different methods of phylo-genetic inference which are based on different assumptions: maximum-likelihood (Felsenstein, 1981); Fitch–Margoliash procedure; Wagner parsi-mony based on mutation coding scheme proposed by Murphy (1993) and Murphy & Doyle (1998); and a method of constructing phylogenetic trees by applying the criterion of parsimony directly to allele frequency data as implemented in the program FREQPARS (Swofford & Berlocher, 1987). (This program tries to find the tree on which the frequency of each allele undergoes the least possible amount of change, while ensuring that allele frequencies in hypothetical ances-tors add to one.)
Nei’s (1972) standard distance was used for dis-tance-based phylogenetic methods since (unlike Cavalli-Sforza & Edwards’ procedure) it takes into account new mutations, more likely an explanation than mere drift for allelic differences between wood mouse species. In order to estimate reliability of phy-logenetic inference at each node, the bootstrap method of Felsenstein (1985) with 1000 pseudoreplications was used for all phylogenies except those estimated by FREQPARS. The PHYLIP program package (Felsen-stein, 1995) was used for all the procedures except when stated otherwise.
RESULTS
PATTERN OF VARIATION
Overall, 190 alleles were scored. Thirty-five of them were rare and present with a frequency lower than 1% in at least one species. The highest number of alleles were found at Ada (12), aGpdh (11), and Me-1 (11). Only a single locus, Lap, out of the 38 analysed loci was monomorphic and fixed for the same allele in all species examined. Three other loci showed alleles with frequencies lower than 1% in individual species:
Mdh-2 (with the allele Mdh-Mdh-292 present with 2% frequency only in the population of A. sylvaticus from the Lepini Mountains), Ck (with two rare alleles, 105 and 95, present only in Israeli populations of A. m.
mystaci-nus), Adk (with two rare alleles, 90 and 94, present in
populations of A. sylvaticus from the Lepini Moun-tains and Corsica).
Allele frequencies of the polymorphic and/or dis-criminant loci in the species analysed are given in Appendix 2. Only alleles with a frequency of at least 1% within all species were considered for interspecific comparisons. In Table 1, total numbers of alleles observed in each species are given, as well as the number of alleles in common and loci discriminating between pairs of species. Apodemus flavicollis dis-played the highest number of alleles in common with other Sylvaemus species, ranging from 34 (with A. cf.
hyrcanicus) to 46 (with A. sylvaticus). In contrast, A. agrarius displayed the lowest number of alleles in
Table 1. (A) Total number of loci studied, total number of alleles observed, and number of exclusive alleles with frequency higher or lower than 1% in each species. (B) Number of alleles in common (above diagonal) and number of discriminant loci (below diagonal) between species
SYL FLA ALP HER URA HYR MYS EPI PEN AGR
(A) No. loci 38 38 38 38 38 38 38 35 34 37 No. alleles 81 76 48 62 66 40 71 36 37 45 No. excl.alleles > 1% 9 2 – 4 2 2 12 6 4 15 No. excl.alleles < 1% 16 7 – 4 2 – 3 – – – (B) sylvaticus – 46 37 37 40 27 26 18 14 15 flavicollis 6 – 45 43 45 34 33 21 18 15 alpicola 5 1 – 37 39 33 27 17 12 11 hermonensis 6 3 4 – 40 30 27 16 14 15 uralensis 7 2 1 4 – 34 32 19 14 11 cf. hyrcanicus 7 4 4 6 3 – 28 18 15 11 mystacinus 8 10 11 13 9 10 – 27 16 14 epimelas 11 15 18 18 16 17 8 – 13 12 peninsulae 20 20 23 21 21 22 19 21 – 19 agrarius 21 22 26 22 26 24 23 22 16 –
common with other Apodemus species, ranging from 11 (with A. alpicola, A. uralensis, and A. cf.
hyrcani-cus) to 19 (with A. peninsulae). A. sylvaticus
Eighty-one alleles were observed at 38 loci, 25 of them being exclusive to this species (Table 1). Intraspecific analysis was carried out on 29 loci. Twenty loci were polymorphic in the 42 populations analysed, whereas nine loci were monomorphic (Sdh, Idh-2, G6pdh,
G3pdh, Ipo-2, Hk-1, Ck, Acph, Lap). Additional loci
were included into interspecific comparisons: two of them (Adh, Pgm-1) were polymorphic and seven
(Hk-2, Est-1, Est-(Hk-2, Pep-1, Pep-(Hk-2, Pep-3, Acph) were
monomorphic. One exclusive allele was found in North Africa (aGpdh104), whereas Me-2115 was found in Algeria and the Iberian Peninsula. Other alleles exclu-sive to Spain were found at Mdh-1 (110) and at Me-2 (92). Several alleles at numerous loci were exclusive to populations from peninsular Italy: Mdh-292, Me-294, Me-288, 6Pgdh92, Ipo-182, Got-190 (found also in Sar-dinia), Adk94, Pgm-296, Ada90, Ada85, Ada80, and Aldo105. Concerning insular populations, Corsica was charac-terized by four exclusive alleles Ldh-292, Np95, Adk90, and Fum96. At a fifth locus, an allele Got-292was exclu-sive to Corsica and Elba. The Sardinian population was characterized by the presence of an exclusive allele Got-190, observed in the mainland population from Penne. Populations from the Balkan Peninsula were characterized by the alleles Got-1110and Ipo-1110. A. flavicollis
Seventy-six alleles were observed at 38 loci and nine of them were exclusive to this species (Table 1). Intraspecific analysis was carried out on 28 loci. Four-teen loci were polymorphic in 30 populations, whereas 14 loci were monomorphic (Sdh, Ldh-2, Mdh-2, Idh-2,
Ipo-1, Ipo-2, Np, G6pdh, Got-2, Ck, Adk, Lap, Aldo, Fum). Another five monomorphic loci (Adh, Hk-2, Est-1, Acph, Pep-2) and five polymorphic loci (Me-Est-1, Pgm-1, Est-2, Pep-Pgm-1, Pep-3) were added for interspecific
comparisons. Several loci showed alleles exclusive to peninsular Italy: aGpdh104, Ldh-192, Mdh-190, Idh-190, Adk94, Pgm-296, Est-3107, Ada85, and Mpi95. Two loci, 6Pgdh and Est-3, contributed to a partial
discrimina-tion of peninsular populadiscrimina-tions from those sampled in Europe and the Middle East: whereas the allele
6Pgdh92 reached a mean frequency of 0.68 on the peninsula, it was only 0.19 in other populations. Like-wise, the frequency of Est-395 was as high as 0.99 in peninsular populations, whereas in other parts of Europe the frequency was much lower (0.25) and in the Middle East the allele was absent and replaced by
Est-3105. Alleles aGpdh106 and Hk-1104 were present only in populations from Israel. At several loci, numer-ous alleles were found only in European populations:
Ada95, Pgi90 (the Balkans and Sweden), Pgi104 (Germany), Me-280(Sweden), and Ldh-1108(the Alpine populations from Tarvisio and Vorarlberg). Idh-1100, typical of A. sylvaticus, was found occasionally in European populations of A. flavicollis.
A. hermonensis
In total, 62 alleles were observed at 38 loci, eight of them being species-specific (Table 1). Intraspecific analysis was carried out on 36 loci in 20 populations; 19 loci were monomorphic (Sdh, Ldh-1, 1,
Mdh-2, Idh-Mdh-2, G6pdh, G3pdh, Ipo-Mdh-2, Np, Got-Mdh-2, Hk-1, Hk-Mdh-2, Adk, Pgm-2, Ap-3, Lap, Aldo, Fum, Mpi). Two
addi-tional loci were considered for interspecific compar-isons: Acph (monomorphic), and Adh (polymorphic). Three alleles were exclusive to Iranian populations:
Ldh-297, Idh-1113, and Ck95. Two alleles were charac-teristic of Israeli populations: Est-395and Ada115, and Turkish populations were characterized by aGpdh93, 6Pgdh112, Ipo-170, Pgm-195, Ap-290, Est-3103, and Pgi104. A. alpicola
Of 48 alleles observed at 38 loci, no allele was exclu-sive to this species (Table 1). Intraspecific analysis was carried out on 34 loci in two samples. See Filippucci (1992) for allelic frequencies in individual populations. Six loci were polymorphic in the two Italian popula-tions (Appendix 2).
A. uralensis
Sixty-six alleles were observed at 38 loci, four of them being species-specific (Table 1). Intraspecific analysis was carried out on 36 loci in 15 populations. Seven-teen loci were monomorphic (Sdh, Ldh-1, Ldh-2,
Mdh-1, Mdh-2, Idh-Mdh-1, Idh-2, Ipo-Mdh-1, Ipo-2, Got-2, Hk-Mdh-1, Hk-2, Ck, Adk, Lap, Aldo, Fum). Additional loci were
con-sidered for interspecific comparisons: one of them (Acph) was monomorphic and one (Adh) was polymor-phic. No allele was exclusive to Europe or Asia Minor.
A. cf. hyrcanicus
Of 40 alleles observed at 36 loci, two were exclusive to this taxon (Table 1). Intraspecific analysis was carried out on 36 loci in two population samples. Three loci were polymorphic (Me-1, Ada, Est-3).
A. mystacinus
In total, 71 alleles were observed at 38 loci in popula-tions from the Middle East (A. m. mystacinus), 19 of them being exclusive (Table 1). In the single Balkan specimen from Galicˇica (A. m. epimelas), 36 alleles at 35 loci were observed, six of them being exclusive. Intraspecific analysis was carried out on 32 loci in seven populations. See Filippucci et al. (1989) for allelic frequencies in individual populations from Israel and Appendix 2 for mean allele frequencies in
the species. Fifteen loci were found to be monomorphic (aGpdh, Sdh, Mdh-1, Mdh-2, Idh-2, G3pdh, 1,
Ipo-2, Got-Ipo-2, Hk-Ipo-2, Adk, Lap, Aldo, Fum, Pgi). Of the extra
loci included in interspecific comparisons, two were monomorphic (Adh, Pep-3) and four were polymorphic (Pgm-1, Acph, Pep-1, Pep-2). Eight loci (Ldh-1, Ldh-2,
Me-2, Idh-1, G6pdh, Pep-1, Pep-2, Mpi) were
discrim-inant and four loci (Me-1, 6Pgdh, Est-1, Est-2) were partially discriminant between the Balkan A. m.
epimelas and Anatolian/Israeli populations of A. m. mystacinus.
A. agrarius
Forty-five alleles were observed at 37 loci in this species; 15 of them were species-specific (Table 1). Intraspecific analysis was carried out on 34 loci in two populations. Six loci were polymorphic (see Appendix 2). Filippucci (1992) describes allele frequencies in populations of this species.
A. peninsulae
Out of 35 alleles observed at 34 loci, four were exclu-sive (Table 1). The two specimens analysed showed polymorphism only at Mpi.
GENETIC SUMMARY
Mean values of genetic variation at the species level are given in Table 2. Values of genetic variation in
A. peninsulae are only tentative, because of the small
sample size. The overall mean number of alleles per locus ranged from 1.029 in A. peninsulae to 1.333 in
A. mystacinus. The overall mean proportion of
poly-morphic loci (P1%) ranged from 0.029 in A. peninsulae
to 0.306 in A. m. mystacinus. Mean observed het-erozygosity was about 0.02 in A. sylvaticus and A.
peninsulae up to about 0.04 in A. flavicollis, A. uralen-sis, A. hermonenuralen-sis, A. m. mystacinus, and A. agrar-ius.
The highest mean values of genetic diversity were observed in A. mystacinus (He = 0.059, range
0.035–0.080) and in A. flavicollis (He = 0.045, range
0.000–0.094). Within populations of the latter species, the lowest diversity was found in those from central and southern Italy (He= 0.038, range 0.020–0.054) and
from Asia Minor, Iran and Israel (He = 0.034, range
0.000–0.087). Alpine, northern-European and Balkan populations displayed higher mean values (He= 0.067,
range 0.043–0.094).
In A. hermonensis, the highest mean values of genetic diversity were observed in populations from southern Iran (He = 0.069, range 0.028–0.089),
whereas a much lower mean value (He= 0.03, range
0.000–0.059) was found in Turkey and Israel. In A.
uralensis, observed heterozygosity averaged 0.04 in
both European and Turkish populations. Except for A.
peninsulae (He= 0.011), which was under-represented
in the material under study (see Appendix 1), the lowest mean values of Hewere observed in A.
sylvati-cus (He= 0.020, range 0.000–0.069). In this species, the
lowest diversity (He= 0.016, range 0.000–0.041) was
found in populations from North Africa, the Iberian Peninsula and central Europe, whereas values nearly twice as high were apparent in Italian (both insular and peninsular populations, He = 0.029, range
0.011–0.052) and Balkan populations (He = 0.037,
range 0.017–0.069).
Estimates of Wright’s F-statistics are given in Table 3. Only samples of N ≥ 7 individuals were con-sidered for calculations. A slight deficiency of het-erozygotes due to inbreeding within conspecific populations was found in A. sylvaticus and A.
flavi-collis (FIS= 0.135 and 0.155, respectively) whereas vir-tually no inbreeding was apparent in A. uralensis (FIS = 0.077) and A. hermonensis (FIS = –0.008). The highest value of FISwas observed in A. m. mystacinus (FIS= 0.337). The mean value of FITranged from 0.228 in A. uralensis to 0.432 in A. flavicollis and 0.435 in
Table 2. Values of some indices of genetic variation (A, mean number of alleles per locus; P1%, proportion of polymorphic
loci under 1% criterion; Ho, mean observed heterozygosity; He, mean expected heterozygosity) and mean intraspecific values
of Nei (1978) genetic distance within Apodemus species (D)
Species No. loci No. populations No. individuals Ho He P1% A D
A. sylvaticus 29 42 584 0.020 0.023 0.113 1.138 0.007 A. flavicollis 28 30 377 0.037 0.045 0.165 1.167 0.020 A. alpicola 33 2 18 0.031 0.033 0.136 1.166 0.015 A. hermonensis 36 20 98 0.037 0.040 0.107 1.100 0.019 A. uralensis 36 14 105 0.042 0.045 0.146 1.160 0.007 A. cf. hyrcanicus 36 2 8 0.028 0.027 0.069 1.070 0.000 A. m. mystacinus 32 6 146 0.038 0.059 0.306 1.333 0.011 A. peninsulae 34 1 2 0.015 0.011 0.029 1.029 – A. agrarius 33 2 9 0.040 0.035 0.121 1.121 0.027
A. m. mystacinus. In the latter species, however, the
high value of FIT is largely due to intrapopulation inbreeding since the value of the fixation index is rel-atively low (FST = 0.148, the lowest value among the species studied) when compared with A. flavicollis (FST= 0.328, the highest value). Rather high values of FST observed in A. flavicollis (0.328), A. sylvaticus (0.297), and A. hermonensis (0.258) indicate that as much as about 26–33% of genetic variation in these species is due to differentiation among populations, thus indicating extensive interdemic genic differenti-ation within the species.
INTRASPECIFIC DIFFERENTIATION
Indices of genetic distance were calculated from allelic frequencies at 28 loci in A. flavicollis, 29 loci in A.
syl-vaticus, 32 loci in A. mystacinus, 33 loci in A. alpicola
and A. agrarius, and 36 loci in A. hermonensis, A.
uralensis and A. cf. hyrcanicus. Data for A. alpicola, A. agrarius, A. hermonensis, A. uralensis, and A. cf. hyrcanicus are the same as those published previously
(Filippucci, 1992; Filippucci et al., 1996; Macholán
et al., 2001a). Mean intraspecific values of genetic
dis-tance for each species are available upon request from one of the authors (MGF). Although, in general, Cavalli-Sforza & Edwards’ (1967) chord distances per-formed better than Nei’s genetic distances (both stan-dard and unbiased) as revealed by higher cophenetic correlation coefficients (not shown here), Nei’s (1978) distance will be presented in the following text since these are by far the most widely quoted, and our results thus can be more easily compared to those pub-lished elsewhere.
A. sylvaticus
The mean value of genetic distance among 42 popula-tions of this species was 0.007, ranging from 0.000 to 0.049. The highest genetic distances were found between North African and European populations
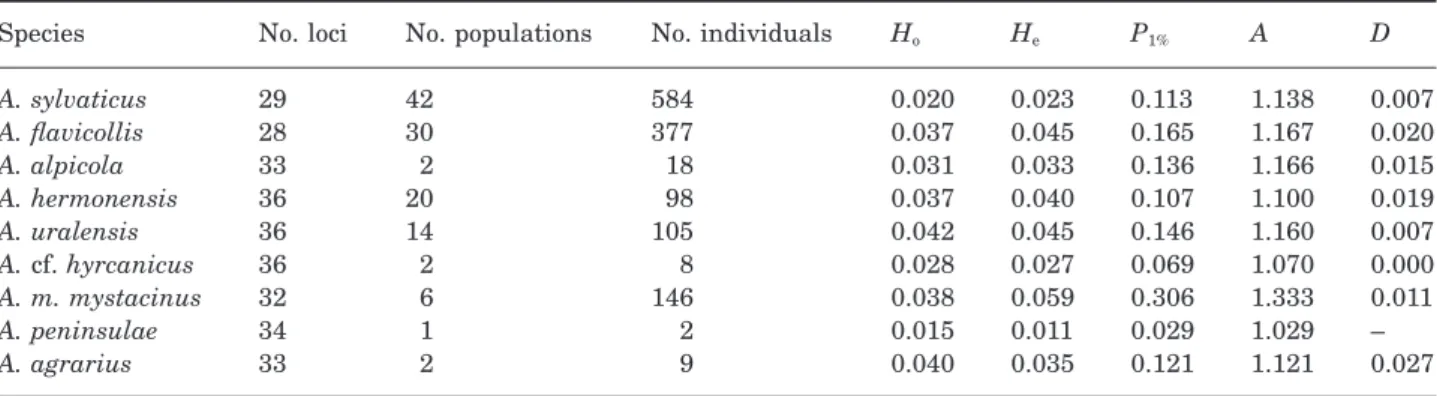
(D = 0.036, 0.017–0.049), while the lowest values were found within the Italian samples (mean D = 0.002, 0.000–0.007). Genetic distances within North Africa and within Europe, were relatively low (0.000–0.015). Low distance values were also observed between insular Italian (Sicily, Corsica, Sardinia and Elba) and peninsular Italian populations (D = 0.003, ranging from 0.000 to 0.007). Genetic relationships among the popu-lations sampled are shown in Fig. 2. There are two main groups in the tree, consisting of the African and Euro-pean populations, respectively. These groups are genet-ically homogenous with the branching pattern within them being apparently random. The slightly distinct position of the Bistra population may be caused by the small sample size.
Table 3. Mean values of coefficients of Wright’s F-statistics and estimates of the number of migrants exchanged between population samples under assumption of island model (Nm was approximated by the formula Nm ª (1/FST – 1)/4; Wright, 1943). Only samples of N ≥ 7
were considered Species FIS FIT FST Nm A. sylvaticus 0.135 0.392 0.297 0.652 A. flavicollis 0.155 0.432 0.328 0.444 A. hermonensis -0.008 0.252 0.258 0.394 A. uralensis 0.077 0.228 0.164 0.606 A. m. mystacinus 0.337 0.435 0.148 1.439
Figure 2. Neighbour-joining tree based on Nei (1978) unbiased distances between A. sylvaticus populations using 29 presumptive enzymatic loci. Note: the tree was con-structed as unrooted but for convenience, it is shown as mid-rooted here.
A. flavicollis
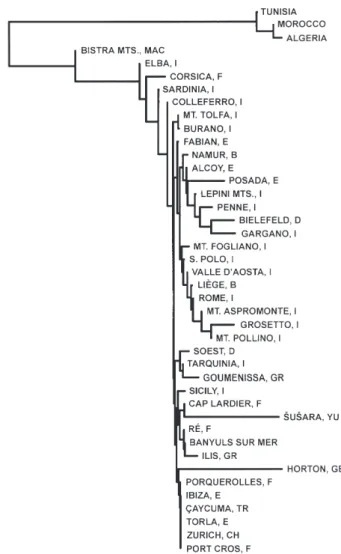
Among 30 populations of this species, the mean value of genetic distance was 0.020, ranging from 0.000 to 0.070. Low genetic differentiation was observed among populations from northern and central Europe, the Balkan Peninsula, Asia Minor, Iran and Israel (0.000–0.025). The highest value of genetic distance was observed between the Austrian population from Vorarlberg and the Israeli population from Tel Dan (D = 0.025). High homogeneity was also observed among Italian peninsular populations (D = 0.002). The northern Italian sample from Tarvisio displayed a mean value of genetic distance of 0.009 in comparison with peninsular populations. The highest values of genetic distance in A. flavicollis were found between peninsular populations from Italy and those from other European countries and the Middle East (D = 0.043). This is clearly illustrated in Fig. 3, where all the Italian populations appear to constitute a single clade, with the population from Tarvisio some-what distinct from others as an apparent genetic tran-sition between the Italian peninsula and the rest of Europe and the Middle East. The latter group (i.e. the Middle East and Europe except Italy) is rather homogenous except the ‘northern’ populations from Germany and Sweden.
A. uralensis
The mean value of genetic distance among 14 popula-tions of this species was low (D = 0.019, ranging from 0.000 to 0.098). The Mantel test revealed slight yet sig-nificant correlation between genetic distances and geo-graphical distances (r = 0.433, Pr[Zrand≥ Zobs] = 0.068).
It is not clear if the distinct position of the Yugosla-vian population (Fig. 4) is real or an artefact of small sample size (cf. Appendix 1). More importantly, the population of ‘A. microps’ from southern Moravia (Czech Republic) appears a sister group of the Turkish clade.
A. hermonensis
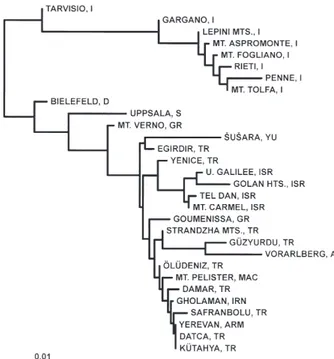
The mean value of genetic distance among 20 popula-tions of this species was 0.019, ranging from 0.000 to 0.059. Great heterogeneity in the rate of genetic change was revealed by the neighbour-joining tree (Fig. 5). As in A. uralensis, there is low coincidence between genetic and geographical distances in this Figure 3. Unrooted neighbour-joining tree depicting
interpopulation relationships in A. flavicollis, based on 28 loci. As in all following neigbor-joining trees, a matrix of Nei (1978) distances was used as input. The tree is shown as mid-rooted.
Figure 4. Neighbour-joining tree of A. uralensis popula-tions, based on 36 enzymatic loci. The tree was mid-rooted for convenience.
Figure 5. Mid-rooted neighbour-joining tree of A. hermo-nensis populations, based on 36 loci.
species (Mantel statistics: r = 0.081, Pr[Zrand ≥ Zobs] =
0.165).
A. alpicola
Only two populations of this species were studied (Col-lardente and Entreves, both in Italy) and the value of genetic distance between them was 0.015 (see Filip-pucci, 1992).
A. cf. hyrcanicus
The genetic distance between the two populations from northern Iran (Asalem and Now Kandeh) was 0.000 (Macholán et al., 2001a).
A. mystacinus
High values of genetic distance were observed between the two subspecies, European A. m. epimelas and A. m.
mystacinus from Turkey and Israel (mean D = 0.359).
Distances between Turkish and Israeli populations were much lower (mean D = 0.028, ranging from 0.026 to 0.031) (Fig. 6). There was strong correspondence between genetic and geographical distances in A. m.
mystacinus (Mantel statistics: r = 0.981, Pr[Zrand≥ Zobs]
= 0.106).
A. agrarius
A relatively low value of genetic distance (D = 0.027) was observed among the two populations studied.
INTERSPECIFIC DIFFERENTIATION AND PHYLOGENETIC RELATIONSHIPS
Several loci, showing fixation for alternative alleles, contributed to the discrimination of the species (Table 1). The lowest number of discriminant loci was found between A. alpicola and A. flavicollis (one, Adh, discriminant, and other three partially discriminant:
Me-1, Idh-1, and Np) and A. uralensis (Pep-1
discrim-inant and aGpdh, Me-1, Np, and Est-2 partially
dis-criminant). Between A. flavicollis and A. uralensis, two loci were discriminant (Adh, Pep-1) and another three (aGpdh, Idh-1, Est-2) partially discriminant.
Apodemus cf. hyrcanicus and A. uralensis were
dis-criminated by three loci (Np, Est-2, Ada), with Me-1 partially discriminant. Between A. flavicollis and A.
hermonensis, three loci were discriminant (Ipo-2, Np,
and Pep-2) and one locus was partially discriminant (Pep-1). A larger number of discriminant loci were found between A. sylvaticus and other Sylvaemus species: five in comparison with A. alpicola (aGpdh,
Ldh-1, Me-2, Ipo-1, Pep-1); six in comparison with A. flavicollis (Adh, aGpdh, Ldh-1, Me-2, Ipo-1, Np); seven
with A. hermonensis (Adh, aGpdh, Ldh-1, Me-2,
1, 2, Pep-2), A. uralensis (aGpdh, Ldh-1, Me-2, Ipo-1, Np, Est-2, Pep-1), and A.cf. hyrcanicus (aGpdh, Ldh-1, Me-2, Ipo-1, Np, Pep-1, Ada).
The discrimination of Karstomys and Sylvaemus species is based on eight loci (between A. m.
mystaci-nus and A. sylvaticus) up to 18 loci (between A. m. epimelas and both A. alpicola and A. hermonensis).
Finally, the highest numbers of discriminant loci (19–26) were found comparing A. agrarius and A.
peninsulae with Sylvaemus (20–26 loci) and Karsto-mys (19–24 loci) species.
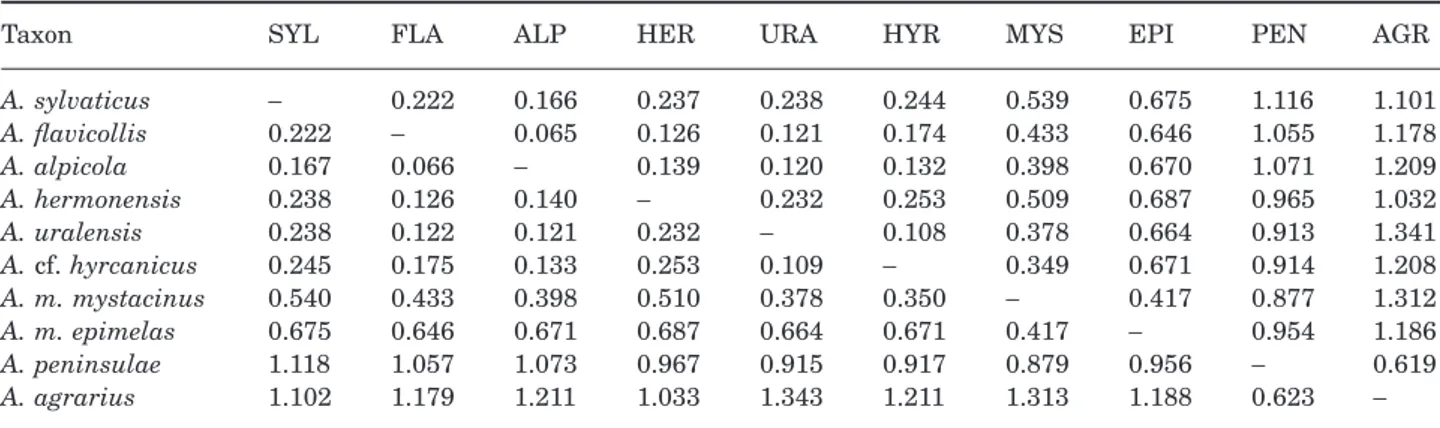
Values of Nei’s genetic distance (Nei, 1972, 1978), based on allele frequencies at 34 loci, are shown in Table 4. The lowest values of interspecific genetic dis-tance were observed between A. alpicola and A.
flavi-Figure 6. Mid-rooted neighbour-joining tree of popula-tions of A. mystacinus, based on 32 enzymatic loci.
Table 4. Values of Nei (1972) standard genetic distance (below diagonal) and Nei (1978) unbiased genetic distance (above diagonal) among species of the genus Apodemus, based on 34 loci
Taxon SYL FLA ALP HER URA HYR MYS EPI PEN AGR
A. sylvaticus - 0.222 0.166 0.237 0.238 0.244 0.539 0.675 1.116 1.101 A. flavicollis 0.222 - 0.065 0.126 0.121 0.174 0.433 0.646 1.055 1.178 A. alpicola 0.167 0.066 - 0.139 0.120 0.132 0.398 0.670 1.071 1.209 A. hermonensis 0.238 0.126 0.140 - 0.232 0.253 0.509 0.687 0.965 1.032 A. uralensis 0.238 0.122 0.121 0.232 - 0.108 0.378 0.664 0.913 1.341 A. cf. hyrcanicus 0.245 0.175 0.133 0.253 0.109 - 0.349 0.671 0.914 1.208 A. m. mystacinus 0.540 0.433 0.398 0.510 0.378 0.350 - 0.417 0.877 1.312 A. m. epimelas 0.675 0.646 0.671 0.687 0.664 0.671 0.417 - 0.954 1.186 A. peninsulae 1.118 1.057 1.073 0.967 0.915 0.917 0.879 0.956 - 0.619 A. agrarius 1.102 1.179 1.211 1.033 1.343 1.211 1.313 1.188 0.623
-collis (Nei’s unbiased distance D = 0.065) and between A. uralensis and A. cf. hyrcanicus (D = 0.108). The
mean distance value between Karstomys and
Sylvae-mus was 0.552, ranging from 0.349 (A. m. mystacinus
– A. uralensis) to 0.687 (A. m. epimelas – A.
her-monensis). Apodemus peninsulae was genetically
closest to A. agrarius (D = 0.619) while the mean genetic distance between these two species and
Sylvaemys–Karstomys was 1.089, with A. peninsulae
being closer to Karstomys (D = 0.915) than to
Sylvae-mus (D = 1.006). ApodeSylvae-mus agrarius always displayed
distances greater than 1.1 in comparison with all other species.
There was general disagreement in the branching pattern of phylogenetic trees revealed by the four dif-ferent methods employed. This is illustrated by low bootstrap support for most of the nodes (Fig. 7). Nevertheless, there were a few branching patterns common to all or the majority of trees. First, A.
agrar-ius and A. peninsulae formed a well-defined clade,
dis-tinct from other species. Second, A. m. epimelas and
A. m. mystacinus appeared highly differentiated from
each other, and indeed these taxa did not even form a monophyletic group in half of the trees. Third, the two
Karstomys taxa were sister species to the Sylvaemus
group sensu stricto. And finally, A. cf. hyrcanicus and
A. uralensis appeared to be sister species to the A. syl-vaticus–flavicollis–alpicola–hermonensis. It is also of
some interest that the rates of allozyme evolution appeared quite uneven among lineages, and A.
agrar-ius, A. sylvaticus and A. hermonensis showed the
highest rates in all three phylogenetic methods taking this parameter into account (i.e. maximum-likelihood, Fitch-Margoliash, and FREQPARS parsimony; see the ML tree in Fig. 7). A majority-rule consensus tree constructed from the four trees is shown in Fig. 8. Numbers in parentheses indicate how many times each clade appeared in individual trees. Again, well-supported clades are formed by A. agrarius–A.
penin-sulae and Sylvaemus with A. mystacinus/epimelas as
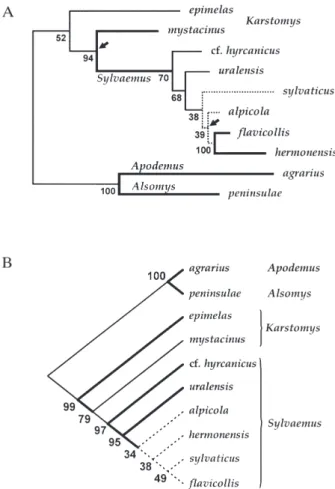
Figure 7. (A) Maximum-likelihood tree showing phyloge-netic relationships between the Apodemus species studied. Bootstrap values at each node indicate percentage out of 1000 pseudoreplicated trees. Branches with strong support (bootstrap values ≥ 90) are in bold, branches with very weak support (bootstrap values £ 50) are shown as dotted lines. The tree is shown as mid-rooted. Arrows indicate branches that are not significantly different from zero. (B) Wagner parsimony tree based on ‘mutation coding scheme’ of Murphy (1993) and Murphy & Doyle (1998). Numbers indicate bootstrap support after 1000 pseudoreplications.
Figure 8. Majority-rule consensus tree based on phyloge-nies inferred by four different methods (maximum-likelihood; Fitch–Margoliash procedure on Nei (1972) stan-dard distances; character-based Wagner parsimony; and Swofford & Berlocher’s method). Numbers in parenthesses indicate how many times respective nodes appeared in the four trees; bootstrap values are shown above them, indi-cating percentage out of 3000 trees (three data sets, each consisting of 1000 pseudoreplicated trees, were pooled, excluding Swofford & Berlocher’s parsimony method). Branches with strong support (bootstrap values ≥ 90) are in bold, branches with very weak support (bootstrap values £ 50) are shown as dotted lines. Note: since not all methods were used for bootstrapping, the numbers can be biased.
a sister group to A. cf. hyrcanicus, uralensis,
sylvati-cus, alpicola, hermonensis, flavicollis.
DISCUSSION
The values of genetic variation observed in Apodemus are within the range generally reported for this genus (e.g. Gemmeke, 1980; Mezhzherin, 1990; Britton-Davidian et al., 1991), and for other rodents in general (Nevo et al., 1990). According to Selander (1976), mar-ginal populations may display lower values of genetic variation, as a consequence both of founder effect and genetic drift. This may be the case for populations of
A. flavicollis from Italy, representing the southern
border of the European distribution, and from Iran and Israel, representing the south-eastern border of the species distribution. Moreover, in peninsular Italy the populations of this species are stenotopic, localized and sometimes isolated, mostly inhabiting coniferous and broadleaf deciduous forests.
We attempted to compensate for small sample size by analysing a large number of loci. Values of het-erozygosity (and genetic distance) are therefore reli-able with a reasonreli-able margin of precision according to Nei (1978), Gorman & Renzi (1979), and Sage et al. (1986) (but see Archie et al., 1989 for a different opinion).
According to Wright’s (1978) suggestions (see also Hartl & Clark, 1997), moderate to very high genetic differentiation among populations within Apodemus species was indicated by FST values (range 0.148–0.328). Estimates of the number of migrants exchanged between populations per generation (Nm), can be approximated by the formula FSTª 1/(4Nm + 1) (Wright, 1943), and these ranged from an average of 0.394 in A. hermonensis, 0.444 in A. flavicollis, 0.606 in A. uralensis, 0.652 in A. sylvaticus, to 1.439 in A.
mystacinus. These values suggest lower levels of gene
flow in some species, with about one migrant every second generation exchanged in A. sylvaticus and A.
flavicollis, whereas more than one migrant every
gen-eration is exchanged in A. mystacinus (cf. Table 3, right column). It should be noted, however, that the above equation is based on the island model of migra-tion, and it is not clear to what extent the results based on this simple model can be considered reliable. The mean values of genetic distance among popula-tions are within the range generally observed in other rodent species (Zimmermann et al., 1978; Graf, 1982). Low values observed among European populations of
A. sylvaticus (D = 0.003; range 0.000–0.015) may be
due to the eurytopic niche of this species, favouring gene flow between contiguous populations. Insular populations (Sicily, Corsica, Sardinia and Elba) appeared genetically close to those from the peninsula (Fig. 2). However, mtDNA studies suggested that A.
sylvaticus is divided into three well-differentiated
groups, the first comprising all western European pop-ulations from Spain to Scandinavia, the second con-sisting of those from Italian and Tyrrhenian islands, and the third group consisting of animals from Sicily (Michaux et al., 1998a,b; Libois et al., 2001). This dis-cordance may be a result of different evolutionary rates between mitochondrial and nuclear markers. Under the assumption of neutrality, the expected time for lineage sorting in two idealized and isolated popu-lations is four times longer for nuclear markers than for mitochondrial ones (Avise, 2000). Moreover, in small mammals, it is usually males who are charac-terized by higher dispersal rates in comparison to more philopatric females. Thus certain mtDNA genes may reflect, with higher fidelity, deeper evolutionary relationships, while biparentally inherited allozymes may reflect recent gene flow among wood mouse pop-ulations. Finally, reduced sensitivity of protein elec-trophoresis at the intraspecific level cannot be ruled out, although in other cases it has proven to be suit-able in distinguishing phylogroups within species (e.g. African vs. other populations of A. sylvaticus; Italian vs. other populations of A. flavicollis; cf. Figs 1, 2).
The population of A. sylvaticus endemic to Elba, being morphologically well-differentiated and charac-terized by increased body size (Kahmann & Nietham-mer, 1971; Filippucci et al., 1984), appeared to be genetically close to mainland populations. The mor-phological differentiation may be due to selective pres-sures rather than to founder effect and/or genetic drift (Michaux et al., 1996a). The low genetic distance between Sardinia and Corsica on the one hand, and mainland populations on the other is in agreement with the recent origin of insular populations of A.
syl-vaticus. According to Vigne (1990), this species, as well
as other small mammals, appeared in Sardinia and Corsica during the late Neolithic period. Because of the preclusion of land passage between these two islands and the mainland during the Holocene, the presence of these species is probably due to the inten-sity of shipping since the Neolithic. Analysis of mtDNA restriction patterns (Michaux et al., 1996a) confirmed the anthropogenic origin of wood mice from Sardinia, Corsica and Elba islands. Whereas Sardinia was probably invaded directly from Italy, our results suggest that the Corsican populations originated from Etruria through Elba, as indicated by the presence of allele Got-292on the latter two islands.
Although genic and morphologic evolution are gen-erally thought to be independent in mammals (Schnell & Selander, 1981), the comparison of mean values of genetic distance displayed by populations of A.
syl-vaticus with those observed among subspecies in other
rodents (D = 0.052, Zimmermann et al., 1978; D = 0.064, Graf, 1982) should lead to a critical revision
of the subspecific division of this species. However, as stated above, allozyme analysis may not be sensi-tive enough to clarify the taxonomy of A. sylvaticus. According to RFLP studies by Michaux et al. (1996a, 1998a), populations from Spain to north-western Europe belong to the same subspecies, A. s. sylvaticus. The origin of these populations on the Iberian Penin-sula was also hypothesized by Gemmeke et al. (1987). According to these authors, A. sylvaticus disappeared from south-central Europe during the Upper Pleis-tocene glacial periods and recolonized this area and northern Europe during the Holocene. Populations on Tyrrhenian islands and peninsular Italy (subspecies
A. s. milleri) have a common origin and differ from the
north-western subspecies, suggesting that the Alps may act as a biogeographical barrier (Michaux et al., 1996b). Finally, the populations from Sicily are dis-tinctive from the rest of Europe and can be considered a separate subspecies, A. s. dichrurus (Michaux et al., 1998b).
An open question remains about the affinity of Balkan populations. According to Duli´c & Tvrtkovi´c (1974) there is considerable confusion concerning the status of A. sylvaticus in this area. High morphologi-cal variation was observed in this species and several taxa were described for this region. Therefore, a detailed analysis of Balkan populations is needed.
Between North African populations, low values of genetic distance were observed (0.000 < D < 0.001), supporting the opinion of Kowalski & Rzebik-Kowal-ska (1991) that there are no differences among the populations, which are attributed to the subspecies
A. s. hayi. The distance between this taxon and
Euro-pean populations (D = 0.036; 0.017–0.049) corresponds to distances generally observed among subspecies in other rodents. This genetic homogeneity has also been reflected in a mtDNA restriction pattern study (Libois
et al., 2001) and confirms the presence of only a single
subspecies in North Africa. According to Gemmeke
et al. (1987), the Tunisian wood mice probably
origi-nated from south-western Europe, and this hypothe-sis was supported by Filippucci (1992) and Michaux
et al. (1996b, 1998b).
Populations of A. flavicollis, which as a species appears more stenotopic than A. sylvaticus, are slightly more differentiated. Reduced gene flow between populations (especially within peninsular Italy, where the populations are mostly limited to the Apennine region) results in an increased degree of morphological and biochemical differentiation (Filippucci et al., 1984; Nascetti & Filippucci, 1984). The highest values of genetic distance were observed between Italian populations from the Apennine Penin-sula ascribed to the subspecies A. f. geminae, and those from the rest of Europe and the Middle East (D = 0.043, 0.006–0.066). Two loci (6Pgdh, Est-3)
contributed to the differentiation of the peninsular populations, displaying substantial differences in allelic frequencies. The genetic affinity between Middle Eastern and Balkan populations is in agree-ment with Tchernov’s opinion that the genus
Apode-mus has probably invaded the Middle East from
southern Europe relatively recently (Tchernov, 1979). Relatively high differentiation (D = 0.417) was found between A. m. epimelas from the Balkans and from
A. m. mystacinus of the Middle East. Although our
analysis is based on a single specimen of epimelas from Galiˇcica, the high value of genetic distance observed and the large number of new alleles at several loci suggest the two taxa could represent two distinct species. This result corroborates the hypothe-sis of an ancient separation between epimelas and
mystacinus, dating to the Pleistocene (Storch, 1977).
In interspecific comparisons, the lowest genetic dis-tances were found between A. flavicollis, A. alpicola, and A. hermonensis (0.060 < D < 0.139), and between
A. uralensis and A. cf. hyrcanicus from northern Iran
(D = 0.108; the mean value between these two groups was 0.172). The allozyme data suggest a recent radia-tion of species within Sylvaemus (in the narrow sense, i.e. excluding A. mystacinus).
As discussed in Macholán et al. (2001a), the taxo-nomic position of south-eastern taxa is problematic and should be further investigated. A. hermonensis was described from Mt. Hermon in Israel, yet it appears to be a common species in both Asia Minor and Iran (Filippucci et al., 1996; Macholán et al., 2001a). According to the analysis of morphological characters, A. hermonensis is probably a junior synonym of A. fulvipectus (Filippucci et al., 1996). Pop-ulations of this species from the Middle East morpho-logically and ecomorpho-logically correspond to the taxon
chorassanicus, recently included in A. fulvipectus by
Musser & Carleton (1993), and this is further corrob-orated by comparison of present data with those of Mezhzherin, 1990) and Lavrenchenko & Likhnova (1995). Diagnostic biochemical characters for A.
ful-vipectus are the presence of discriminant alleles at Sdh, Sod-2 (Mezhzherin, 1990), Hb and Np (Lavrenchenko & Likhnova, 1995). According to our data, Np and Ipo-2 (= Sod-2) discriminate A.
hermo-nensis from A. flavicollis, A. uralensis, A. cf. hyrcani-cus, and A. alpicola.
Populations from Nepal and Iran, previously attrib-uted to A. sylvaticus using morphological characters, displayed a higher affinity with A. flavicollis than with A. sylvaticus when studied electrophoretically, although they were differentiated from both of them (Darviche et al., 1979; Gemmeke & Niethammer, 1982). Recently, Macholán et al. (2001a), documented the presence of three species in Iran (A. hermonensis,
hermo-nensis was the most widespread. Mezhzherin (1997b)
and Zagorodnyuk et al. (1997) synonymized the taxa falzfeini, chorassanicus, fulvipectus, and
hermo-nensis with Iranian arianus, the latter taxon being
the oldest known synonym. Recently, Kryˇstufek & Vohralík (2001) and Kryˇstufek (2002), on morphol-ogical criteria, have asserted Apodemus iconicus Heptner, 1948 to be a valid older synonym of A.
her-monensis. Nonetheless, the relationship of the Middle
Eastern A. flavicollis to the Caucasian A. ponticus, the affinity of Apodemus sp. (provisionally named A. cf.
hyrcanicus in Macholán et al. (2001a) and in this
paper) to A. hyrcanicus described from Talysh (Mezhzherin et al., 1992; Vorontsov et al., 1992), and the systematic status of A. arianus and A. wardi remain unclear.
The mean value of genetic distance between A.
syl-vaticus and other Sylvaemus species was 0.22,
indi-cating that the separation from a common ancestor occurred approximately one million years ago (accord-ing to Nei’s (1975) formula, T = 5 ¥ 106D). This
esti-mate is in agreement with fossil records (Michaux & Pasquier, 1974), as well as with the results of rDNA analysis by Suzuki et al. (1990), although it is about four times higher than the allozyme-based estimate of Gebczyn´ski et al. (1986). Conversely, this is two to four times lower than estimates of Serizawa et al. (2000) based on nucleotide sequence data.
Within Sylvaemus (excluding mystacinus and
epimelas), the phylogenetic relationships are
unre-solvable by protein electrophoresis, partly owing to rapid adaptive radiation of the group and partly because of limitations of the method. The branching patterns presented in this paper differ from those pub-lished previously (e.g. Mezhzherin, 1990; Filippucci, 1992; Filippucci et al., 1996; cf. Fig. 8) mainly in the placement of A. sylvaticus, which has usually been outside other species. However, previous allozyme studies almost exclusively used the UPGMA for depicting genetic relationships among species of
Apodemus, yet it has been shown that the method is
inappropriate when there are deviations from ultra-metricity (i.e. when the assumption of a molecular clock is violated; see Swofford et al., 1996 for details). It is also known that taxa with presumed higher rates of genic change tend to appear most distant in UPGMA phenograms, as do, for example, A.
sylvati-cus, A. hermonensis and A. agrarius in this paper
(UPGMA trees not shown here).
The genetic differentiation between A.
mystaci-nus/epimelas and Sylvaemus corresponds to that
generally observed between morphologically well-differentiated species of small mammals. Although the former pair of species have appeared genetically diversified from the latter group (e.g. Britton-Davidian et al., 1991; Filippucci, 1992;
Mezhzherin, 1997a; this paper), the validity of
Karsto-mys remains unclear.
Apodemus peninsulae appeared closer to A. agrar-ius than to A. mystacinus/epimelas and other Sylvae-mus species. This corresponds to Mezhzherin & Zykov
(1991), Bellinvia et al. (1999), and Serizawa et al. (2000) (but see Suzuki et al., 1990). Musser et al.’s (1996) decision of including A. agrarius and A.
penin-sulae in the same Apodemus-group thus seems
appro-priate. High genetic distances between A. agrarius/A.
peninsulae and other species (D = 1.10–1.32) are
similar to those generally observed among different genera of rodents. For instance, Graf (1982) found an average value of D = 0.75 within Arvicolidae, Honey-cutt & Williams (1982) found D = 1.01 in Geomyinae, and Filippucci & Kotsakis (1995) reported D = 1.69 in Myoxidae. High values of genetic distance between A.
agrarius and other European species of Apodemus
have been reported in the majority of papers investi-gating allozyme variation in these species. Moreover, the subgenus Apodemus did not appear to be more closely related to Sylvaemus than to Mus and/or
Rattus (Bonhomme et al., 1985; Mezhzherin, 1997a).
However, here we are faced with the same problem as discussed in the case of A. sylvaticus (see above) of allozyme evolution within lineages, as was suggested by Hartl et al. (1992). According to these authors para-phyly of the genus Apodemus, although supported by the UPGMA clustering method based on the results of allozyme studies, is not substantiated when the par-simony method is applied to the data. Unfortunately as no outgroup was used in this study we cannot resolve this problem even though appropriate methods of phylogenetic inference, including two parsimony approaches, were used. Including more Apodemus taxa from south-eastern Asia and the Far East as well would be desirable.
CONCLUSIONS
From the results obtained from the electrophoretic analysis of 1347 specimens of ten wood mice taxa from Europe, the Middle East and North Africa, we con-clude that:
1 Of 38 loci scored, a single locus, Lap, was found to
be monomorphic and fixed for the same allele, while rare (private) alleles appeared at three other loci,
Mdh-2, Ck and Adk, at frequencies less than 1%. The
taxa investigated had from 11 (between A. agrarius and A. uralensis, A. cf. hyrcanicus, A. alpicola) to 46 (between A. sylvaticus and A. flavicollis) common alleles.
2 The mean number of alleles (A) per locus ranged
from 1.029 to 1.333; high variation was found in the mean proportion of polymorphic loci (P1% =
0.029–0.306). Mean observed heterozygosity (Ho)
ranged from about 2% (A. sylvaticus, A. peninsulae) to about 4% (A. flavicollis, A. uralensis, A. hermonensis,
A. m. mystacinus, A. agrarius). The highest values
of genetic diversity were found in A. mystacinus (He= 0.059) and A. flavicollis (He= 0.045).
3 Estimates of Wright’s F-statistics, measured in
samples of N ≥ 7 only, ranged from FIS = –0.008 (A.
hermonensis) to FIS= 0.155 (A. flavicollis), FIT= 0.228
(A. uralensis) to FIT = 0.435 (A. m. mystacinus),
and FST= 0.148 (A. m. mystacinus) to FST= 0.328 (A.
flavicollis).
4 Genetic distances were generally low between
pop-ulations within individual species, the only exception being the distance between the two subspecies of A.
mystacinus, European epimelas and mystacinus from
the Middle East (Nei’s D = 0.359), leading us to suggest the specific status for these taxa. Regardless of a rather random genetic pattern within species, several apparent discontinuities were revealed by neighbour-joining analyses in some species. First, pop-ulations of A. sylvaticus from North Africa constitute a separate lineage, clearly distinct from Europe. Second, Italian populations of A. flavicollis are distin-guished from those of the rest of Europe and the Middle East, with the population from Tarvisio being intermediate between the two clades. Conversely, even though the southern Moravian population of ‘A.
microps’ appeared somewhat differentiated from those
of A. uralensis from Asia Minor, their inclusion within the same species seems well substantiated.
5 Apodemus agrarius and A. peninsulae are sister
taxa and should be included in the same group of species, as already suggested by Musser et al. (1996).
6 Apodemus mystacinus and A. epimelas appear sister
taxa to other species of the Sylvaemus group, in agree-ment with conslusions of Musser et al. (1996) and Ser-izawa et al. (2000), although validity of the subgeneric name Karstomys for the former two taxa remains unclear.
7 Within the Sylvaemus group in the narrow sense
(i.e. excluding A. mystacinus and A. epimelas), the phylogenetic relationships between species are unclear as the four different phylogenetic methods yielded incongruent results. However, A. cf.
hyrcani-cus and A. uralensis appeared outside the group A. syl-vaticus–A. flavicollis–A. alpicola–A. hermonensis in
the majority of trees.
To resolve the last point, more data (and possibly nucleotide sequences) are needed. However, even addi-tional molecular data and genealogies may not resolve the Sylvaemus phylogeny since a mosaic neutral char-acter evolution may result from rapid speciation events and radiation of the wood mice species. Further investigation is necessary for A. hyrcanicus, A.
ful-vipectus, A. arianus, A. wardi and A. ponticus from
type localities, as well as other species from central Asia (such as A. rusiges, endemic to north India: Musser & Carleton, 1993), and from south-eastern European taxa vohlynensis, mosquensis, and
ciscau-casicus (Orlov et al., 1996). A comparison between
European and Asiatic species (especially with A.
argenteus, presently included in a separate group of
species) with an appropriate outgroup will be neces-sary for correct inference of the evolutionary relation-ships within the genus and to test the alternative hypotheses of whether Apodemus is monophyletic or polyphyletic.
ACKNOWLEDGEMENTS
The authors are grateful to P. Benda, S. Ciarlantini, M. Coppola, M. Cristaldi, V. Fadda, D. Frynta, I. Horáˇcek, B. Kryˇstufek, H. Meinig, G. Reggiani, J. Sádlová, S. Simson, A. Tondina, V. Vohralík, and J. Zima for kindly providing material and/or help in the field. Heidi C. Hauffe and an anonymous referee are acknowledged for language revision and useful com-ments on earlier versions of the paper.
REFERENCES
Amtmann E. 1965. Biometrische Untersuchungen zur intro-gressiven Hybridisation der Waldmaus (Apodemus sylvati-cus Linné, 1758) und der Gelbhalsmaus (Apodemus taurisylvati-cus Pallas, 1811). Zeitschrift für Zoologische Systematik und Evolutionsforschung 3: 103–156.
Archie JW, Simon C, Martin A. 1989. Small sample size does decrease the stability of dendrograms calculated from allozyme-frequency data. Evolution 43: 678–683.
Avise JC. 2000. Phylogeography. The history and formation of species. Cambridge, Massachusetts: Harvard University Press.
Bellinvia E, Munclinger P, Flegr J. 1999. Application of the RAPD technique for a study of the phylogenetic relationships among eight species of the Genus Apodemus. Folia Zoolog-ica 48: 241–248.
Benmehdi F, Britton-Davidian J, Thaler L. 1980. Premier apport de la génétique biochimique des population à la sys-tematique des mulots de France continentale et de Corse. Biochemical Systematics and Ecology 8: 309–315.
Bonhomme F, Iskandar D, Thaler L, Petter F. 1985. Elec-tromorphs and phylogeny in muroid rodents. In: Luckett WP, Hartenberger JL, eds. Evolutionary relationships among rodents. London: Plenum Press, 671–683.
Britton-Davidian J, Vahdati M, Benmehdi F, Gros P, Nancé V, Croset H, Guerassimov S, Triantaphyllidis C. 1991. Genetic differentiation in four species of Apodemus from Southern Europe: A. sylvaticus, A. flavicollis, A. agrar-ius and A. mystacinus (Muridae, Rodentia). Zeitschrift für Säugetierkunde 56: 25–33.