Corporate Social Responsibility and corporate performance:
evidence from a panel of US listed companies
Leonardo Becchetti, Stefania Di Giacomo, Damiano Pinnacchio
CEIS Tor Vergata - Research Paper Series, Vol.
26, No. 78, December 2005
This paper can be downloaded without charge from the
Social Science Research Network Electronic Paper Collection:
http://papers.ssrn.com
/abstract=871402
CEIS Tor Vergata
R
ESEARCH
P
APER
S
ERIES
Corporate Social Responsibility and corporate performance: evidence from a panel of US
listed companies
1Leonardo Becchetti
University of Rome Tor Vergata
Stefania Di Giacomo
University of Rome Tor Vergata
Damiano Pinnacchio
University of Rome Tor Vergata
Abstract
We investigate whether inclusion and permanence in the Domini social index affects corporate performance on a sample of around 1,000 firms in a 13-year interval by controlling for size, industry, business cycle and time invariant firm idiosyncratic characteristics. Our results find partial support to the hypothesis that corporate social responsibility is a move from the shareholders wealth to a multi-stakeholders welfare target. On the one side, permanence into the Domini index is shown to increase (reduce) significantly total sales per employee (returns on equity but not when large and R&D investing firms are excluded from the sample). On the other side, lower returns on equity for Domini firms seem nonetheless to be accompanied by relatively lower conditional volatility and lower reaction to extreme shocks with respect to the control sample.
An explanation for these findings, suggested by the inspection of Domini criteria, is that social responsibility implies, on the one side, decisions leading to higher cost of labour and of intermediate output, but may, on the other side, enhance involvement, motivation and identification of the workforce with company goals with positive effects on productivity.
Key words: social responsibility, stakeholders, corporate performance.
JEL classification codes: M14, L21.
1 Paper presented ad the XIII Tor Vergata Financial Conference. Support from the Veritatis Splendor Research Project
on Social responsibility is acknowledged. The authors thank Helen Alford, Michele Bagella, Laura Boccardelli, Saverio De Santo, Iftekhar Hasan, James Lothian, Ferruccio Marzano, Francesco Nucci, Alberto Pozzolo for useful comments and suggestions and Osea Giuntella for his precious research assistance. The usual disclaimer applies.
1. Introduction
A first minimal definition of social responsibility is generally related to the corporate choice of not
breaching laws and regulations when pursuing shareholders’ wealth maximisation goals. A second
approach considers that CSR is more than just following the law (McWilliams & Siegel, 2001), as it
also involves actions which are expected to affect positively an identifiable social stakeholder’s
welfare. Our analysis is aimed at measuring the impact of this second definition of CSR on
corporate performance.
The debate on the relevance and effects of this second type of corporate social responsibility is
polarised around two opposite perspectives. A first one considers CSR as a violation of manager’s
mandatory duties, when it materialises into arbitrary management of "free cash flow" and higher
expenditures which reduce shareholders’ wealth (Friedman, 1962).
2The reasoning of Friedman
(1962) implies an efficient balance of powers between profit maximizing firms and social welfare
maximizing institutions, which is far from the reality of our economic systems. Asymmetric
information, agency costs and conflicts of interests are so widespread in our imperfect economic
environment and institutions are distant from the benevolent planners depicted by theoretical
models of some decades ago. All this considered, an important argument for the relevance of CSR
comes from the observation that, in a society riddled by conflicts of interests and informational
asymmetries, with weak institutions and incomplete contracts, the tenet of shareholders wealth
maximization may be socially and environmentally untenable if corporate power is not offset by
proper checks and balances from institutional action.
In the current “three-pillar” (institutions, corporations and the civil society) system what we
observe are stakeholders creating bottom-up pressures on corporations in order to compensate
institutional weaknesses in designing rules which should align firm behaviour to the goal of socially
2 “Few trends could so thoroughly undermine the very foundations of our free society as the acceptance by the corporate officials of a social responsibility other than to make as much money for their shareholders as possible”.
and environmentally sustainable development (Adriani and Becchetti, 2004). This pressure induces
corporations to signal their social responsibility in order to minimize attrition with stakeholders. In
this framework, CSR often originates not from an autonomous decision of managers, but from
external pressures from consumers or institutions.
Well aware of these linkages between corporations, institutions and consumers, a different and
broader view on CSR considers the social role of corporations and their relationship not just with
shareholders, but with the larger set of firm stakeholders. In this perspective Freeman (1984)
emphasizes that, if stakeholders have voice, the socially responsible behaviour of corporations may
be a rational strategy to minimize conflicts and optimize synergies in their complex network of
relationships with various stakeholders (local communities, consumers, environmentalist
associations, subcontractors, etc.).
On this line Tirole (2001) argues that the concept of stakeholder value recognizes that corporate
activity may create negative externalities which need to be counterbalanced, either by institutional
rules or by corporations themselves. In such case, creating shareholders value is not enough to
maximize total welfare and management should aim at “maximizing the sum of various stakeholder
surpluses.” He is though sceptical on the possibility of creating incentives which can induce
managers to behave in a socially responsible way. First, he observes that the difficulty of measuring
SR fosters managerial opportunistic behaviour. Second, he argues that a SR company, by definition,
should shifts its focus from the maximisation of shareholders’ wealth to a multi-stakeholders
welfare approach. The consequence of this move may be a relatively lower return on equity which
may make her object of a takeover from a profit maximising raider.
A first reply to Tirole (2001) is that several social labelling organisations have born to overcome
informational asymmetries in this field. Hence, a corporation is nowadays considered as being
socially responsible not just when it claims to be as such, but only if it complies with a set of
externally fixed behavioural criteria. Opportunistic behaviour is obviously always a temptation but
external monitoring and reputational costs from being caught cheating on SR may be a strong
deterrent. The second Tirole's objection (takeover risk) is an interesting one and is somewhat related
to our empirical research aimed at verifying whether SR firms create relatively more or less
shareholder value than the rest of the economy.
Overall, an interesting issue in the above mentioned debate on CSR is that CSR may definitely be a
superior corporate behaviour in terms of social welfare if the expected reduction of negative
externalities is accompanied by a creation of aggregate economic value (and not merely shareholder
return) equal or superior to that of non socially responsible firms. If this is true, a powerful
incentive for corporations to adopt a SR attitude, beyond enlightened altruism, exists. This is why
the evaluation of the effects of SR on corporate performance is a relevant topic in the current
literature on CSR.
Our paper focuses on this issue and is divided into seven sections (including introduction and
conclusions). The second section discusses the expected costs and benefits arising from the
adoption of a SR behaviour The third section briefly surveys the empirical literature on the effects
of SR on corporate performance. The fourth section analyses SR criteria of a widely acknowledged
standard (the Domini index which will be the benchmark of our empirically analysis) focusing in
particular on their potentially cost increasing and productivity enhancing characteristics. The fifth
section presents and comments our descriptive and econometric findings on the impact of entry,
permanence and exit from the Domini index of SR. The sixth section analyses whether the lower
return on equity of SR firms is compensated by reduced conditional volatility of SR firms stock
returns.
2. Expected costs and gains from socially responsible behaviour
Before testing directly the impact of SR on corporate performance we briefly survey theoretical
grounds which might support the hypothesis of a non negative relationship between SR and
corporate performance. As a starting point we must consider - as it will be clear from the analysis of
the characteristics of Domini criteria - that SR involves the undertaking of a set of actions which are
potentially cost increasing (such as higher attention to workers conditions within the firm and in
subcontracting companies, adoption of more environmentally, and often more costly, productive
processes, etc.).
These sources of additional costs need to be compensated by some potential benefits to be
economically sustainable. A first one, already mentioned, is represented by the creation of
reputational capital which may help the company to obtain more favourable terms of trade when
negotiating with various stakeholders (Cornell and Shapiro, 1987; Bowen et al., 1995; Jones, 1995).
A second one considers that SR may positively affect workers productivity if we move away from
the standard microeconomic approach which regards labour productivity as solely related to
individual skills, human capital and expected remunerations. In this perspective, a new strand of the
literature starts modelling workers productivity as being affected not just by the usual set of
individual worker variables, but also by intrinsic motivation, coworkers behaviour or working
conditions, and by the workers identification with the goals of their firm (Agell and Lundberg,
1999; Bewley, 1999, Campbell and Kamlani, 1999). Social preferences
3(Fehr- Schmidt, 1999; Fehr
and Schmidt, 2001; Sobel 2001) and gift exchange models (Akerlof, 1982) are two leading fields in
this literature .
In this perspective, it is possible that the move to (exit from) CSR may significantly increase
(reduce) intrinsic workers motivation, thereby affecting positively (negatively) their productivity.
3. The empirical literature on the impact of CSR
3 According to a definition of Fehr and Falk (2002) "a person exhibits social preferences if it does not only care about
the material resources allocated to it but also cares about the material resources allocated to other relevant reference agents".
A huge number of empirical papers have tested in the past the relationship between social
responsibility and corporate performance. Strangely enough, almost all of these papers have been
published in the business and not in the economics literature, even though the topic of CSR is
obviously relevant for both.
This “anomaly” gives us the advantage of providing an original contribution to this specific field by
testing the relationship between the two variables with methodological approaches which are
standard in economics, but are not always used in the business literature.
With some approximation we can divide the existing empirical papers into three groups.
The first finds a positive relationship between CSR and corporate performance. Soloman and
Hansen (1985) find that the costs of having a high level of CSR are more than compensated by
benefits in employee morale and productivity. Pava and Krausz (1996) and Preston and O’Bannon
(1997) observe that CSR is positively associated with financial performance, while positive
synergies between corporate performance and good stakeholders relationships are found by
Stanwick and Stanwick (1998) and by Verschoor (1998). Ruf et al. (2001) find that change in CSR
is positively associated with growth in sales and that returns on sales are positively associated with
CSR for three financial periods. Simpson and Kohers (2002) document a positive link between
social and financial performance on a sample of banking firms.
A second group of papers finds no significant direction in the link between CSR and corporate
performance. Mc Williams and Siegel (2001) observe that the financial performance of the Domini
index constituents is not significantly different from that of a control sample when per capita R&D
expenditure is added among regressors. Other papers finding inconclusive results are those of
Anderson and Frankle (1980), Freedman and Jaggi (1986) and Aupperle, Caroll and Hatfield
(1985).
A third group of contributions documents a negative relationship between CSR and corporate
performance which is consistent with the managerial opportunism hypothesis. Preston and
O’Bannon (1997) suggest that managers reduce expenditures on social performance to increase
short-term profitability and their personal compensation, but, when financial performance is poor,
they divert attention by expenditures on social programs. Other papers documenting a negative
relationship are those of Freedman and Jaggi (1982), Ingram and Frazier (1983), Waddock and
Graves (1997).
How to interpret these controversial results ? In the well known story about the blind men and the
elephant each blind man can get only part of the truth by touching a part of the body of the elephant.
The group of blind men acquires reasonable knowledge of the phenomenon under investigation (the
elephant) only when the partial and insufficient information collected by each individual is pooled.
The story suggests that the above described differences in findings across the three groups of papers
do not necessarily reflect mistakes or inaccuracies, but, most often, differences in perspective
(observation periods, companies included in the sample, measures of corporate performance and
methodological approaches adopted for the empirical analysis). It also suggests that the
combination of them, or an empirical research broadening the scope of the analysis and integrating
many of these perspectives, may give us a more complete picture of the effects of SR on corporate
performance (our “elephant”).
Our paper follows this direction as it aims to implement the existing research in the field from
several points of view. First, it uses panel data and takes into account a significantly long time
period, controlling for business cycle effects with year dummies and for spurious correlations
between variables with cointegrating panel techniques. Second, it introduces firm specific intercepts
(fixed effects), thereby separating the impact of CSR from time invariant, firm idiosyncratic,
characteristics. Third, it explores the impact of exit from CSR with specific reference to a range of
different motivations (labour relationships, sales of weapons, corporate governance, environment)
on corporate performance. Fourth, it proxies the relative risk of holding CSR stocks by testing for
the difference in conditional volatility and in its reaction to shocks between CSR and control sample
stocks.
4. The Social domini criteria
The Domini Social Index 400 (DSI 400) developed by Kinder, Lydenberger and Domini has created
a series of widely acknowledged SR criteria which gradually became an international standard.
4These criteria determine the inclusion of stocks into the index itself and, with it, the opportunity of
being selected in portfolios of ethical funds.
5Social domini criteria are divided into eight big domains: i) community; ii) corporate governance;
iii) diversity; iv) employee relations; v) environment; vi) human rights; vii) product quality; viii)
controversial business issues. For each of them the Domini index identifies strengths and
weaknesses, and lists a series of corporate actions falling under one of the two (see Appendix 1).
4.1 Domini requirements with cost increasing potential
The inspection of these criteria immediately shows that there are no “free lunches” in SR, revealing
how several SR actions are clearly cost-increasing. In the community section we find as strengths
charitable giving, support for education and support for housing. In the diversity section we find
work benefits (the company has outstanding employee benefits or other programs addressing
work/life concerns, e.g. childcare, eldercare or flextime). In the employee relations section we find
as strengths cash profit sharing programs, health and safety strength and strong retirement benefit
4 The index methodology presents advantages and drawbacks. Its advantages are that it reflects historical concerns of
investors, keeps track of CSR evolution in time and includes all dimensions identified as important in CSR. Its first limit is the absence of a measure of intensity in corporate performance. Another important problem with the index is in the adoption of a “best in class process” in which relative, but not absolute, best SR performers in some industries have been included with the specific aim of keeping the index sufficiently diversified, thereby allowing ethical fund investors to adopt well diversified passive investment strategies. Finally, a third limit is that the index must have a constant number of constituents. Therefore, for any exit a new entry is needed, with the effect that entry timing is determined not solely by firm progress on CSR, but also by rebalancing needs.
5 The weight of these funds in financial markets is growing considerably. According to 2003 Report on Socially Responsible Investing Trends in the United States the industry of ethically managed mutual fund assets represented
$2.16 trillion dollars when including all US private and institutional ethically screened portfolios. Based on these figures one out of nine dollars under professional management in the United States was part of socially responsible portfolios.
programs. In the environment section we find as strengths clean air programs. This item is for
companies which have taken significant measures to reduce [their] impact on climate change and
air pollution through use of renewable energy and clean fuels or through energy efficiency or for
companies that have demonstrated a commitment to promoting climate-friendly policies and
practices outside its own operations. The impact of these measures on costs is not necessarily
positive, but it is highly suspected to be so. In the human right section we find the item of
Indigenous Peoples Relations Strength (the company has established relations with indigenous
peoples near its proposed or current operations –either in or outside the U.S- that respect the
sovereignty, land, culture, human rights and intellectual property of the indigenous peoples) and
Labor Rights Strength (the company has outstanding transparency on overseas sourcing disclosure
and monitoring or has particularly good union relations outside the U.S.). Here again, good
relationships with local workers and stakeholders are expected to have some costs in terms of
missed opportunities of labour cost reductions.
4.2 Domini requirements with cost decreasing (or productivity enhancing) potential
Against all these potentially cost increasing factors we find only one clearly cost-decreasing SR
initiative in the corporate governance section (the limited compensation of the manager) and a profit
or productivity enhancing domain related to product quality.
On the other hand, our inspection of Domini affiliation also suggests that some of the same cost
increasing items commented above may have a dual effect including, on the positive side, the
capacity of increasing workers participation and productivity. First, limits to managerial
compensation may increase workers’ satisfaction if the latter have inequality aversion in their
preferences. Second, the presence of a program of Work/Life Benefits (the company has
The same Report illustrates that, from 1995 to 2003 the rate of growth of assets involved in social investing, through screening of retail and institutional funds, shareholder advocacy, and community investing has been 40 percent higher than all professionally managed investment assets in the U.S (240 against 174 percent).
outstanding employee benefits or other programs addressing work/life concerns, e.g. childcare,
eldercare or flextime) may increase workers involvement with the company.
Last but not least, a positive reaction of workers in terms of productivity may also be generated by
strength factors in the employee relations section. These are: i) Cash Profit Sharing (the company
has a cash profit-sharing program through which it has recently made distributions to a majority of
its workforce); ii) Employee Involvement (the company strongly encourages worker involvement
and/or ownership through stock options available to a majority of its employees, gain sharing,
stock ownership, sharing of financial information, or participation in management
decision-making); iii) Health and Safety Strength (the company is noted by the US Occupational Health and
Safety Administration for its safety programs); iv) Retirement Benefits Strength (the company has a
notably strong retirement benefits program); v) Union Relations (the company has a history of
notably strong union relations); vi) Other Strength (the company has strong employee relations
initiatives not covered by other KLD ratings).
The goal of our paper is to test whether the cost increasing factors related to CSR (and, specifically,
to Domini affiliation) prevail over the factors which should increase workers motivation and lead to
higher productivity. Furthermore, we want to evaluate whether, as it is implicit in its same
characteristics, CSR choice may lead to some forms of redistribution of corporate value from
shareholders to stakeholders.
5.1 The econometric specification and descriptive findings
In order to test the impact of Domini affiliation on corporate performance we choose the following
specification:
1 1
0 1 2 3 4
1 1
log(
)
min
log(
)
nRe
mit i k k t t it
k t
Y
α γ α
Size
α
Do
i
α
Entry
α
Postexit
β
asexit
δ
Year
ε
− −
= =
= + +
+
+
+
+
∑
+
∑
+
where Yit is a chosen performance variable (eg. return on equity, return on investment, return on
capital employed,
6total sales per employee), γ
iis the time invariant firm idiosyncratic (fixed) effect,
Size is the number of firm employees, Domini is a (zero/one) dummy measuring affiliation to the
Domini 400 index; Entry is a dummy which takes the value of one in the year of entry into the
Domini 400 index and zero otherwise; Postexit is a variable measuring the number of years
following exit from the Domini 400 index; Reasexit
kis the k
thdummy taking the value of one in
the year of exit when the specific exit rationale (Military, Environment, Productquality, Badgovnce
and Badlabour) applies. Finally, Year
tis a year t dummy picking up year effects.
In our estimate we therefore try to disentangle the effects of corporate social responsibility (proxied
by Domini affiliation) from business cycle effects (year dummies) and idiosyncratic characteristics
(e.g. management quality) of each firm (proxied by the fixed effect measured through the firm
specific intercept component u
i).
To provide an example of the relevance of this approach, it may happen that the association of
Domini affiliation with a positive performance in a given dependent variable depends from the fact
that high performers are more likely to search for Domini affiliation than low performers. In this
case the causation would be reversed with good performance causing Domini affiliation and not
vice versa. In our estimate fixed effects should capture differences in ex ante characteristics and the
Domini variable should measure just the net effect of CSR.
The use of fixed effect controls for measurement errors arising from the use of industry dummies as
well. The identification of firm specific characteristics goes in fact deeper than the identification of
industry characteristics, since industry classifications are becoming always more imperfect
taxonomies for firms with increasingly diversified product mix.
6 Return on capital employed is equal to Operating income/(Shareholders' equity + Interest bearing liabilities). Its
advantage is that it includes in the denominator and indicator which depends on firm indebtedness and therefore does not suffer, like ROE, of sensitiveness to firm leverage (i.e. highly leveraged firms tend, by definition, to have significantly higher ROE than non highly leveraged ones)
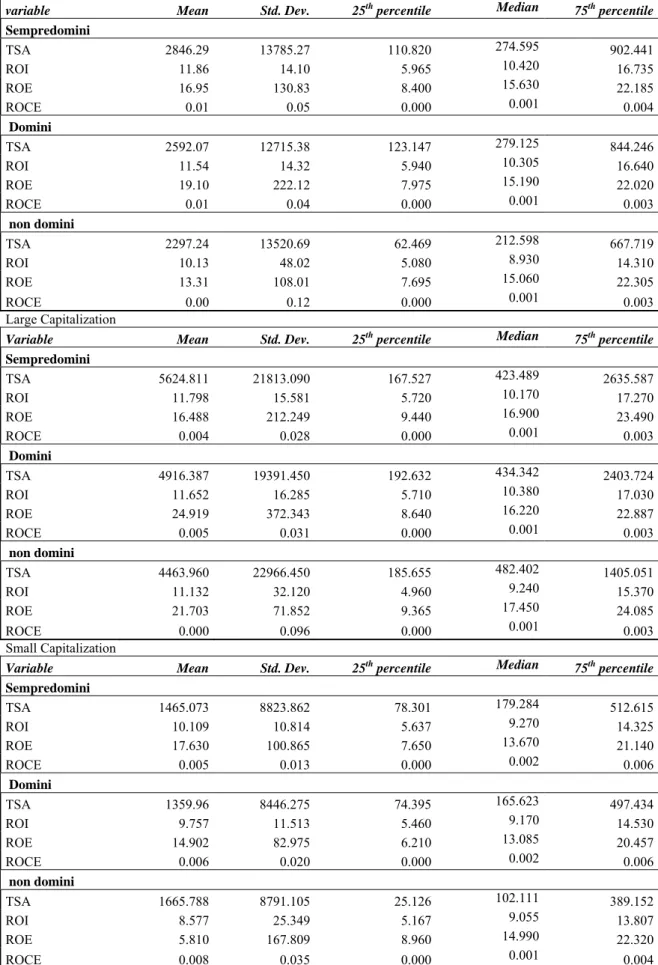
Table 1 presents preliminary descriptive findings on the distribution of variables used for the
econometric analysis showing that the median value for ROI (ROE) is around 10 (15) percent and
that more than 5 (10) percent of ROI (ROE) observations are negative.
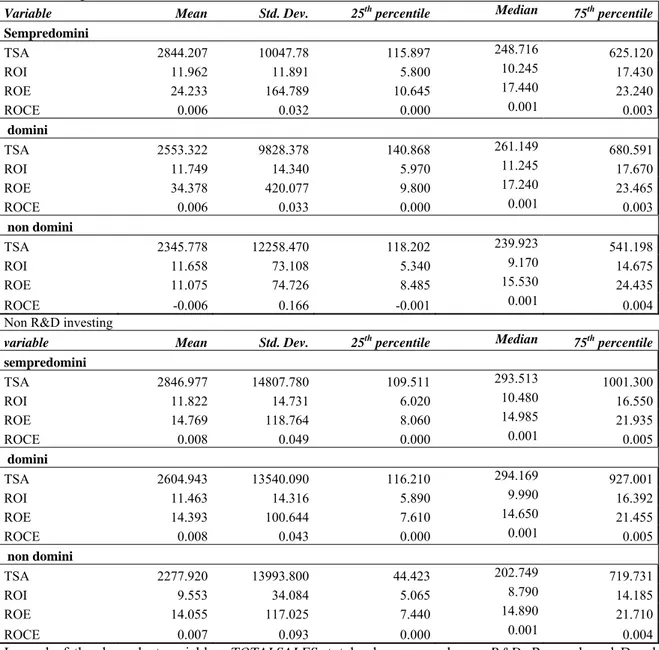
Table 2 illustrates descriptive findings on the distribution of the dependent variables selected for the
econometric analysis according to the three subgroups of firms which are never (non domini),
always (sempredomini) or, at some moment in the observation period, (domini) in the Domini
index. The analysis is provided for the overall sample and for the size and R&D/non R&D investing
subsamples which we will consider also in the econometric analysis. A relevant finding is that
average non domini total sales per employee (return on equity) are (is) always lower than in the
sempredomini subgroup with the exception of the small cap (large cap) subsample. Overall,
descriptive findings do not help much in obtaining a clear cut picture of the impact of SR on
corporate performance and econometric analysis is needed to disentangle ex ante identity from
Domini affiliation effects.
5.2 Results from econometric analysis
The standard techniques applied to time series require, before estimating a model, that series are
I(0) or, if not, that they have at least one cointegrating vector. This is to avoid that significant
relationships between the dependent variable and the regressors are led by spurious correlations.
These techniques are now being applied also to the time dimension of individuals in panels. The
application of these techniques to panel data is complex and requires the formulation of joint
hypotheses on the stationarity of the time series of each of the individuals (in our case firms) being
part of the panel.
We first test for the stationarity of non discrete series in our estimates (firm size, net sales per
worker, return on equity, on investment and on capital employed) by using the Fisher’s test,
developed by Maddala and Wu (1999), based on the p-values from N independent unit root tests.
The null hypothesis assumes that all series are non stationary. The test has two alternatives. The
homogeneous alternative (all series are stationary) and the heterogeneous alternative (some series
are stationary and some others are not). The null hypothesis is rejected for our dependent variables
(see Table 3.1).
The problem is that with the Fisher test we cannot discriminate between the homogeneous and the
heterogeneous alternative. For this reason we add the Im-Pesaran-Shin (2003) diagnostic in which
the null hypothesis that all series are nonstationary is tested against the heterogeneous alternative.
7The test does not lead to the rejection of this hypothesis for the net sales and net cash flow per
employee series. The finding is consistent with the result of the Fisher test performed on individual
(firm) series of the additional continuous variables (such as firm size) showing in some cases
stationarity and in some others non stationarity.
8Once verified the existence of nonstationarity in at least some of the time dimensions of our
individual firm series, we can still perform a regression in levels with these variables if we find the
presence of common stochastic trends (i.e. of cointegration). To check for it we use the Nyblom and
Harvey (2000) test which has the advantage of allowing for serial correlation in residuals and of not
requiring any model to be estimated.
9The test rejects the null hypothesis of absence of common
stochastic trends under the assumption of non IID standard errors (NH adj. t in Table 3.2), thereby
identifying the presence of cointegrating vectors which allow us to estimate the model in levels.
7 Among authors emphasizing the importance of testing for panel cointegration to avoid spurious regressions in panel
estimates see Gerdtham and Lothgren (2002) and Okunade and Karakus (2001). The latter also provide one of the earlier applications of the Im et al. (2003) test which is performed also in this paper. For an application of panel cointegration to financial ratios see Peel et al. (2004)
8 Omitted for reasons of space and available from the authors upon request.
9 The test does not require model estimates because is based on the rank of covariance matrix of the disturbances
driving the multivariate random walk. If this rank is equal to a certain number of common trends, this implies the presence of cointegration and vice-versa. If the rank is equal to zero, as in the null hypothesis, then there are no common trends among the variables. Thus, failure to reject the null hypothesis of zero common trends is also an indication that the variables do not form a cointegrated combination.
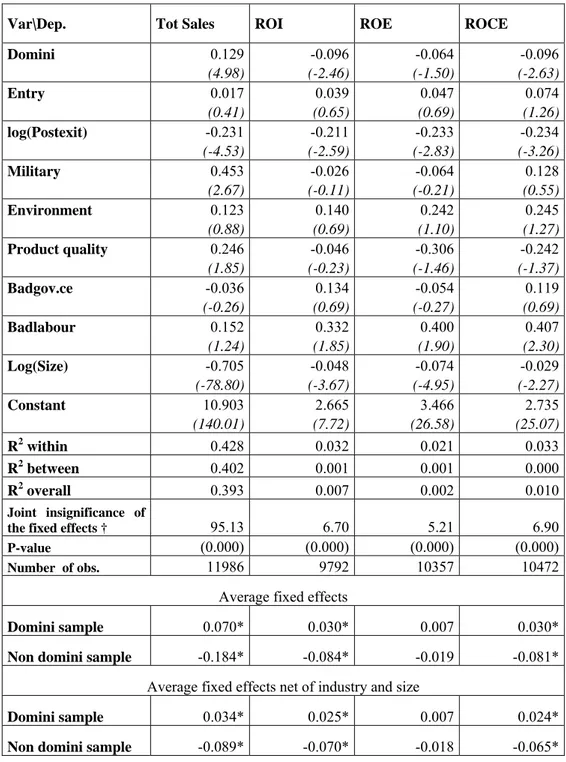
A first important result of the estimates presented in tables 4.1-4.4 shows that the joint
insignificance of the fixed effects is rejected, confirming that idiosyncratic factors matter and their
omission is likely to bias empirical findings.
Our empirical findings document that permanence into Domini index is associated with 13 percent
higher total sales per employee after controlling for size, business cycle effects and idiosyncratic
firm characteristics (Table 4.1, column 1). The positive total sales performance is consistent (even
though not coincident) with findings from Stanwick and Stanwick (1998), Verschnoor (1998) and
Ruf et al. (2001) mentioned in section 3. In the same estimate we find that doubling the years after
Domini exit reduces total sales per employee by 23 percent in the overall sample and is associated
with a significantly reduced performance (around 21, 23 and 23 percent respectively for each of the
three profitability indicators, ROI, ROE and ROCE) (Table 4.1, columns, 2, 3 and 4). These
findings are not at odds with the Friedman (1984) hypothesis that CSR helps to reduce transaction
costs with stakeholders but may be also explained by a distress factor which affect both
performance and exit from the Domini.
Columns 2 to 4 (table 4.1) show that Domini affiliation is associated with a reduction of return on
investment, return on equity and return on capital employed of around 10, 6 and 10 percent
respectively. Note that the effect of Domini affiliation on ROE is not significant in the overall
sample estimate but that it becomes so when large or R&D investing firms are excluded from the
sample (Tables 4.2-4.6). This negative effect is compensated by the positive impact of entry into the
Domini index on ROI and ROCE in the estimates in which large caps are excluded from the sample
(table 4.2) More generally, estimates in Table 4.2 in which large caps are excluded from the sample
reveals an overall deterioration of the Domini effect since the positive impact on total sales
disappears and the negative effect on profitability indicators become stronger.
Moreover, negative post exit effects on profitability indicators seem to exist (and to be stronger) for
non large capitalisation firms (around 62 percent lower return on capital employed and 60 percent
lower return on investment) (table 4.2).
When we reestimate the model for non R&D investing firms only the results of the overall sample
are confirmed with some slight differences: i) Domini affiliation has a significant effect on total
sales per worker even when large caps are excluded from the sample (16 percent with large caps
and 9 percent without large caps) (tables 4.3 and 4.4, column 1); ii) the negative effects of Domini
affiliation on profitability indicators tends to be larger in these subsamples (tables 4.3 and 4.4,
columns 2 to 4).
Overall, findings reported in tables 4.1-4.4 outline a picture in which SR seems consistent with the
shift in focus from shareholders wealth maximisation to a multistakeholders welfare approach. SR
firms productivity is equal or, in some cases, significantly higher than in the control sample while,
at the same time, return on equity is significantly lower. These findings clearly match with our
interpretation of SR criteria described in section 4. Such criteria are shown to generate transfers of
wealth to stakeholders and workers, but are also interpreted as having the potential effect of
increasing workers motivation and productivity.
To control further for endogeneity and reverse causation we wonder whether some permanent
characteristics distinguish Domini affiliated firms from the control sample or, in other terms, if
firms which will be included in the Domini index are idiosyncratically different in quality with
respect to the control sample.
We therefore test whether average fixed effects for the control sample and for firms which are in the
Domini index at some moment in our sample interval are significantly different. Our findings (last
rows of tables 4.1-4.6) show that SR firms have significantly higher net sales and return on
investment fixed effects before and after controlling for size and industry effects (in all of the six
estimated samples) in the overall and in all subgroup estimates. The difference between fixed
effects of Domini and non Domini firms is not significant in the return on equity estimate. Our
interpretation is that Domini affiliation significantly reinforces traits of corporate identity which
were already in place before entry. Summing up all our findings we are led to conclude that: i) SR
firms have ex ante higher total sales per worker and higher return on investment, ii) their
permanence into the Domini index generates a new significant independent effect in one case
consistent (higher total sales per worker) and in another not consistent (lower return on equity) with
ex ante characteristics.
6. Domini affiliation and conditional stock return volatility
The relatively lower ROE of SR firms does not necessarily mean that SR stocks are not a good
business. The comparative performance of equities must be obviously evaluated on the risk-return
perspective. In this perspective, relatively lower returns on equity of SR firms may be compensated
by relatively lower risk. Following Boccardelli and De Santo (2005) we test the relative risk of a
buy-and-hold investment strategy on our SR stocks vis à vis the same strategy on our control
sample by building an index of stock returns for the two subsamples and estimate their conditional
volatility with a simple GARCH (1,1)
10(Nelson, 1989; Engle, 1990; Engle and Ng, 1993).
The chosen specification for stock return behaviour (mean equation) is:
0
t i t i j j t
i j
R
=
α
+
∑
γ
R
−∑
β
DW
+
δ
DJ
+
ε
(2)
where
R is the average subgroup (SR or control sample) one-day compounded return,
tDW is the
jj-th dummy measuring “day of the week” effects, DJ is a dummy for “January” effect and
(0, )
t
h
tε
≈
is the error term.
The standard specification adopted for testing the asset market volatility in the second (variance)
equation of a GARCH (1,1) model is given by:
1 2 2 1 1 0
+
−+
−=
t t tb
b
b
h
h
ε
(3)
10 Preliminary tests on normality and ARCH LM tests show that observed returns are non normal and have an ARCH
structure. More complex (asymmetric, nonlinear) conditional heteroskedasticity models have also been estimated giving results which are not substantially different in terms of the effect of SR. Results are omitted for reasons of space and available upon request.
where
h is the conditional variance of the error term in (2),
t 21 − t
ε
measures the impact of news on
conditional variance and
h
t−1is the conditional variance autoregressive component which measures
persistence of the dependent variable.
Mean equations for the two (Domini and control sample) indexes (table 5) have some common
elements. One period lagged daily log returns have small but significant effects on the dependent
variable. Moreover, the control sample (non SR firms) exhibits also a negative and significant
Monday effect, consistently with several previous results in literature (Taylor, 1986).
Kurtosis and skewness tests, performed on the residuals obtained from the best estimation of the
base equations, show that the distribution is not normal. The existence of excess kurtosis confirms
the “stylized fact” of thick tails for financial time series, which was firstly observed by Mandelbrot
(1963 a, b). The sum of the ARCH and GARCH coefficients is very close to one, indicating that
volatility shocks are quite persistent (but lower than one).
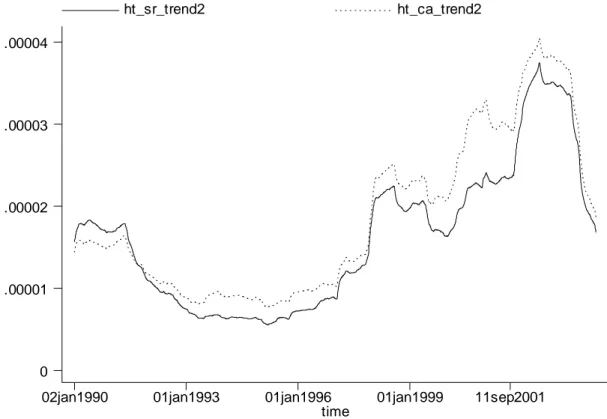
A relevant finding is that 95 percent confidence intervals of the first equation intercept overlap and
therefore we find no difference in excess returns between the SR and the non SR portfolios.
The main differences between the two indexes are that the Monday effect is significant and negative
only in the control sample index and that the intercept in the second equation is significantly lower
(at 90 percent) for the Domini index. Figure 1 plots conditional volatility for the two indexes and
confirms that the conditional volatility of the Domini index is almost always lower than that of the
control sample index.
The quality of the SR index is not just that of having relatively lower conditional volatility but also
that of having a significantly reduced volatility reaction to large shocks. In Table 6 the model is
reestimated by adding a dummy which tests the change in conditional volatility after the burst of the
Nasdaq stock market bubble in March 2000. The approach used for evaluating the impact of
changes in stock price volatility after news’ releases or regime shifts follows previous research from
Choi and Kim (2002), Crain and Lee (1996), Becchetti and Caggese (2000) and Wang et al. (2002).
Our findings show in this case that the impact is significantly lower in the social responsibility
index.
A possible interpretation of this result hinges upon the different nature of those investing SR and
non SR portfolios. According to the
2003 Report on Socially Responsible Investing Trends in the
United States, the highest growth component (80 percent) in the growth of assets involved in social
investing from 1995 to 2003 has been that of community investing
11. The nature of the latter, and
generally of most SR investors, is therefore expected to be “more patient” and long-term oriented
with respect to non SR investors. An indirect evidence of it is provided in the same report by the
comparison of the accumulated equity fund flows of SR and non SR funds in the US between
January 2001 and May 2003 where we assist to a constant growth in the stock of SR fund assets
compared to a sharp drop in the non SR funds in the mid of this period.
7. Conclusions
Corporate social responsibility is a multifaceted complex phenomenon involving a set of actions
which are expected to affect significantly cost structures and workers participation to productive
activity. As a consequence, the scope of empirical investigations on the effects of CSR on corporate
performance must be such that the highest number of hidden dimensions of the problem can be
discovered and analysed.
This paper tries to do so by enlarging the observed estimation period, by discriminating among
different reasons for entry or exit from a selected measure of CSR and by controlling for business
cycle effects and for time invariant idiosyncratic characteristics of the observed firms.
Our empirical approach allows us to disclose many unexplored dimensions of the CSR/corporate
performance relationship.
11 Community development financial institutions primarily provide loan financing to businesses in areas that need
economic development. CDFIs make loans that are generally "unbankable" by traditional industry standards because of past credit problems, the size of the loan request, limited equity from founders or limited collateral.
Our findings are consistent with the hypothesis that CSR is expected, in principle, to redirect the
focus of corporate activity from the maximization of shareholders to that of stakeholders interests.
We observe in fact that workers in SR firms produce “larger cakes” (total sales per employee are
significantly higher), but a smaller portion of these cakes goes to shareholders (returns on equity
are significantly lower when large caps or R&D investing firms are not in the sample and returns on
capital invested and on investment are always lower). The “penalty” that social responsibility
imposes on shareholders (relatively lower return one equity) seems to be compensated by reduced
conditional volatility of SR vis à vis the control sample. In fact, if the ROE of socially responsible
firms is significantly lower when we exclude large firms from the sample, risk adjusted returns of
the SR portfolio are not significantly different from those of the control sample.
A second robust finding is the significantly negative impact (both in terms of productivity and
return on equity) of exit from the Domini index. This result documents negative consequences
arising when a CSR stance is abandoned. Limits of our information do not allow to verify whether
the event reveals an exogenous negative shock on firm competitiveness which also leads to
exclusion from the Domini or whether the shock depends on reduced productivity of workers or on
sanctions imposed by socially responsible consumers.
References
Adriani F. Becchetti L., 2002, Fair trade: a “third generation welfare” mechanism to make globalisation sustainable, in J.Whalley (ed.) CEIS Working Paper, n. 171.
Anderson J., Frankle A. (1980), “Voluntary Social Report: An Iso-Beta Portfolio Analysis”, Accounting Review 55: 468-479
Aupperle K. E., Caroll A.B., Hatfield J.B. (1985), “An empirical examination of the relationship between corporate social responsibility and profitability”, Academy of Management Journal 28: 446-463
Becchetti A. Caggese, A, 2000, Effects of index option introduction on stock index volatility: a procedure for empirical testing based on SSC-GARCH models, Applied Financial Economics, 10(3), June, 323-41
Boccardelli L. De Santo S., 2004, Social responsibility and reaction to stock market shocks, mimeo
Bowen, R. M., L. DuCharme and D. Shores: 1995, ‘Stakeholders’ Implicit Claims and Accounting Method hoice’,
Journal of Accounting and Economics 20, 255–295.
Choi S. and Kim B. J., 1991, Monetary policy regime changes and the risk premium in the foreign exchange markets : A GARCH application, Economic Letters, 37, 447-452.
Cornell B., Shapiro A. (1987), “Corporate Stakeholder Theory and Corporate Finance”, Financial Management 16:5-14 Crain S.J. and Lee J.H., 1996, Volatility in Wheat Spot and Futures Markets, 1950-1993: government Farm Programs, Seasonality, and Causality, Journal of Finance, 1996, vol. 51, issue 1, 325-43
Deci E. (1975), “Intrinsic Motivation”, Plenum Press, New York
Engle, R. F. (1990) Stock volatility and the crash of ’87: discussion, Review of Financial Studies, 3(1), 103-6.
Engle, R. F. and Ng, V. (1993) Measuring and testing the impact of news on volatility, Journal of Finance, 48(5) 1749-78.
Fehr E., Falk A. Psychological Foundations of Incentives, in: European Economic Review 46 (2002), 687-724
Freedman M. and Jaggi B. (1986), “An analysis of the impact of corporate pollution disclosures included in Annual Financials Statements on investors’ decisions”, in Advances in public interest accounting
Freeman R.E. (1984), “Strategic Management”: a Stakeholder approach”, Pitman,Boston Friedman M. (1962),“Capitalism and Freedom”, Chicago University Press
Galor O. and Moav O. (2004), “From Physical to Human capital accumulation: Inequality and the process of Development”, Review of Economic Studies, Blackwell Publishing, vol. 71(4), pages 1001-1026, 10
Gerdtham, U. G., Lothgren, M.. 2002, “New Panel Results on Co-integration of International Health Expenditure and GDP.” Applied Economics. September, 2002, 1679-1686.
Ingram, R. and K. Frazier: 1980, ‘Environmental Performance and Corporate Disclosure’, Journal of Accounting
Research 18, 614–622.
Jones, T. M.: 1995, ‘Instrumental Stakeholder Theory: A Synthesis of Ethics and Economics’, Academy of Management
Review (April), 404–437.
Mandelbrot B. (1963 a) The variation of certain speculative prices, Journal of Business, 36, 394-419. Mandelbrot B. (1963 b) New methods in statistical economics, Journal of Political Economy, 71, 421-440.
McWilliams A., Siegel D. (2001), “Corporate social responsibility and financial performance: correlation or misspecification?”, Strategic Management Journal 21(5): 603-609
Nelson, D. B. (1989) Price volatility, international market links, and their implications for regulatory policies: commentary, Journal of Financial Services Research, 3(2- 3), 247- 54.
Pava L., Krausz J. (1996), “The association between corporate social responsibility and financial performance, Journal
of Business Ethics 15: 321-357
Okunade, A.A., M.C. Karakus (2001) “Unit Root and Cointegration Tests: Timeseries versus Panel Estimates for International Health Expenditure Models.” Applied Economics 33, 1131-1137.
Peel, D. A., Peel, M. J., Venetis I. A., 2004, Applied financial Economics, Further Empirical Analysis of The Time Series Properties Of Financial Ratios based on a Panel Data Approach, Applied Financial Economics, 14(3), 155-164. Preston L., O’Bannon D. (1997), “The corporate social-financial performance relationship”, Business and Society 36(1): 5-31
Ruf, B. M., Muralidhar K., Brown R. M., Janney J.J. and Paul K. (2001), An Empirical Investigation of the Relationship Between
Change in Corporate Social Performance and Financial Performance: A Stakeholder Theory Perspective, Journal of
Business Ethics 32, 143–156.
Simpson W.G. and Kohers T., (2002), The Link Between Corporate Social and Financial Performance: Evidence from the Banking Industry, Journal of Business Ethics, 35, 97-109.
Social investment forum, 2003 Report on Socially Responsible Investing Trends in the United States, Soloman R., Hansen K. (1985), “It’ s Good Business”, Atheneum, New York
Stanwick P.A. and Stanwick S.D. (1998), The Relationship Between Corporate Social Performance, and
Organizational Size, Financial Performance, and Environmental Performance: An Empirical Examination, Journal of Business Ethics, 17, 195-204.
Taylor D. (1986), Modelling Financial Time Series, Wiley and Sons, London Tirole J. (2001), “Corporate Governance”, Econometrica, 69 (1)
Verschoor, C.C. (1998) A Study of The Link Between as Corporation’s Financial Performance and Its Commitment to Ethics, Journal of Business Ethics, 17, 1509-1516.
Waddock, S.A. and Graves. S.A. (1997) The Corporate Social Performance-Financial Performance Link", Strategic
Management Journal, 18, 4, 303-319
Wang Z., Salin V., Hooker N.H. Leatham, D., 2002, Stock Market Reaction to Food Recalls: A GARCH Application," Applied Economics Letters, 9(15) 2002, 979-987
Table 1 Distribution for the variables selected for the empirical analysis
Centile
TOTALSALES
(millions of $) R&D ROI ROE ROCE
1% 6.678 0.055 -31.820 -72.540 -0.022 5% 16.493 0.202 -5.200 -17.230 -0.001 10% 30.917 0.387 1.100 -3.250 0.000 25% 110.821 1.049 5.940 7.980 0.000 50% 274.595 4.279 10.305 15.190 0.001 75% 902.441 24.731 16.640 22.020 0.004 90% 4415.063 120.051 24.580 33.300 0.012 95% 11724.880 592.727 31.690 45.250 0.027 99% 56790.850 3629.195 58.670 129.600 0.169 Legend of variables: TOTALSALES: total sales per employee; R&D: Research and Development per employee; ROI: Return on Investment; ROE: Return on Equity; ROCE: Return on Capital Employed (where
Table 2 Descriptive statistics of variables used in the empirical analysis
Overall samplevariable Mean Std. Dev. 25th percentile Median 75th percentile
Sempredomini TSA 2846.29 13785.27 110.820 274.595 902.441 ROI 11.86 14.10 5.965 10.420 16.735 ROE 16.95 130.83 8.400 15.630 22.185 ROCE 0.01 0.05 0.000 0.001 0.004 Domini TSA 2592.07 12715.38 123.147 279.125 844.246 ROI 11.54 14.32 5.940 10.305 16.640 ROE 19.10 222.12 7.975 15.190 22.020 ROCE 0.01 0.04 0.000 0.001 0.003 non domini TSA 2297.24 13520.69 62.469 212.598 667.719 ROI 10.13 48.02 5.080 8.930 14.310 ROE 13.31 108.01 7.695 15.060 22.305 ROCE 0.00 0.12 0.000 0.001 0.003 Large Capitalization
Variable Mean Std. Dev. 25th percentile Median 75th percentile Sempredomini TSA 5624.811 21813.090 167.527 423.489 2635.587 ROI 11.798 15.581 5.720 10.170 17.270 ROE 16.488 212.249 9.440 16.900 23.490 ROCE 0.004 0.028 0.000 0.001 0.003 Domini TSA 4916.387 19391.450 192.632 434.342 2403.724 ROI 11.652 16.285 5.710 10.380 17.030 ROE 24.919 372.343 8.640 16.220 22.887 ROCE 0.005 0.031 0.000 0.001 0.003 non domini TSA 4463.960 22966.450 185.655 482.402 1405.051 ROI 11.132 32.120 4.960 9.240 15.370 ROE 21.703 71.852 9.365 17.450 24.085 ROCE 0.000 0.096 0.000 0.001 0.003 Small Capitalization
Variable Mean Std. Dev. 25th percentile Median 75th percentile Sempredomini TSA 1465.073 8823.862 78.301 179.284 512.615 ROI 10.109 10.814 5.637 9.270 14.325 ROE 17.630 100.865 7.650 13.670 21.140 ROCE 0.005 0.013 0.000 0.002 0.006 Domini TSA 1359.96 8446.275 74.395 165.623 497.434 ROI 9.757 11.513 5.460 9.170 14.530 ROE 14.902 82.975 6.210 13.085 20.457 ROCE 0.006 0.020 0.000 0.002 0.006 non domini TSA 1665.788 8791.105 25.126 102.111 389.152 ROI 8.577 25.349 5.167 9.055 13.807 ROE 5.810 167.809 8.960 14.990 22.320 ROCE 0.008 0.035 0.000 0.001 0.004
Table 2 Descriptive statistics of variables used in the empirical analysis (follows)
R&D investing
Variable Mean Std. Dev. 25th percentile Median 75th percentile Sempredomini TSA 2844.207 10047.78 115.897 248.716 625.120 ROI 11.962 11.891 5.800 10.245 17.430 ROE 24.233 164.789 10.645 17.440 23.240 ROCE 0.006 0.032 0.000 0.001 0.003 domini TSA 2553.322 9828.378 140.868 261.149 680.591 ROI 11.749 14.340 5.970 11.245 17.670 ROE 34.378 420.077 9.800 17.240 23.465 ROCE 0.006 0.033 0.000 0.001 0.003 non domini TSA 2345.778 12258.470 118.202 239.923 541.198 ROI 11.658 73.108 5.340 9.170 14.675 ROE 11.075 74.726 8.485 15.530 24.435 ROCE -0.006 0.166 -0.001 0.001 0.004 Non R&D investing
variable Mean Std. Dev. 25th percentile Median 75th percentile sempredomini TSA 2846.977 14807.780 109.511 293.513 1001.300 ROI 11.822 14.731 6.020 10.480 16.550 ROE 14.769 118.764 8.060 14.985 21.935 ROCE 0.008 0.049 0.000 0.001 0.005 domini TSA 2604.943 13540.090 116.210 294.169 927.001 ROI 11.463 14.316 5.890 9.990 16.392 ROE 14.393 100.644 7.610 14.650 21.455 ROCE 0.008 0.043 0.000 0.001 0.005 non domini TSA 2277.920 13993.800 44.423 202.749 719.731 ROI 9.553 34.084 5.065 8.790 14.185 ROE 14.055 117.025 7.440 14.890 21.710 ROCE 0.007 0.093 0.000 0.001 0.004
Legend of the dependent variables: TOTALSALES: total sales per employee; R&D: Research and Development per employee; ROI: Return on Investment; ROE: Return on Equity; ROCE: Return on Capital Employed.
SEMPREDOMINI: observations relative to firms being part of the Domini index throughout all the sample period; NONDOMINI: observations when sample firms are not part of the Domini index; DOMINI: observations when sample
Table 3.1. Panel Unit Root Test
Fisher t-test: the null hypothesis is that all series are non stationary against the homogeneous alternative (all series are stationary) and the heterogeneous alternative (some series are stationary and some others are not).
IPS: Im, Pesaran and Shin (2003). The null hypothesis of the test is that all series are non stationary (H0: ρi=1) against
the alternative heterogeneous hypothesis (H1: ρi <1 for each i=1,…,N1 and ρi =1 for each i=N1+1,…,N for some N1)
Size Net sales per worker
Net cash flow per worker
ROI ROE ROCE
Fisher t-test p-value 0.001 0.001 0.001 0.001 0.001 0.001 t-bar -0.774 -1.631 -3.312 -2.112 -2.691 -2.331 Critical Value 10% -1.64 -1.64 -1.64 -1.64 -1.64 -1.64 Critical Value 5% -1.67 -1.67 -1.67 -1.67 -1.67 -1.67 Critical Value 1% -1.73 -1.73 -1.73 -1.73 -1.73 -1.73 W-bar 17.286 -2.584 -24.924 -35.23 -32.23 -41.14
IPS
test
p-value 1.000 0.005 0.000 0.000 0.000 0.000Table 3.2 Panel Cointegration Test by Nyblom and Harvey (2000)
The null hypothesis of the test is no cointegration (H0: rang(var-cov)=K=0) against the alternative hypothesis of
cointegration (H1: rango(var-cov)=K ≠ 0).
NH-t: the test is performed under the hypothesis of iid errors. Nh adj-T: errors are allowed to be serially correlated, and the test is performed using an estimate of the long-run variance derived from the spectral density matrix at frequency zero.
Size Net sales per worker
Net cash flow per worker
ROI ROE ROCE
NH-t 7.4667 8.412 7.153 9.152 8.195 9.003 NH adj-t 44.800 41.230 38.450 47.250 41.330 41.360 Critical Value 10% 18.36 18.36 18.36 18.36 18.36 18.36 Critical Value 5% 19.01 19.01 19.01 19.01 19.01 19.01 Critical Value 1% 20.25 20.25 20.25 20.25 20.25 20.25 Fixed effects N N>100 N>100 N>100 N>100 N>100 N>100
Table 4.1 The impact of Domini affiliation on performance indicators
Var\Dep. Tot Sales ROI ROE ROCE
Domini 0.129 -0.096 -0.064 -0.096 (4.98) (-2.46) (-1.50) (-2.63) Entry 0.017 0.039 0.047 0.074 (0.41) (0.65) (0.69) (1.26) log(Postexit) -0.231 -0.211 -0.233 -0.234 (-4.53) (-2.59) (-2.83) (-3.26) Military 0.453 -0.026 -0.064 0.128 (2.67) (-0.11) (-0.21) (0.55) Environment 0.123 0.140 0.242 0.245 (0.88) (0.69) (1.10) (1.27) Product quality 0.246 -0.046 -0.306 -0.242 (1.85) (-0.23) (-1.46) (-1.37) Badgov.ce -0.036 0.134 -0.054 0.119 (-0.26) (0.69) (-0.27) (0.69) Badlabour 0.152 0.332 0.400 0.407 (1.24) (1.85) (1.90) (2.30) Log(Size) -0.705 -0.048 -0.074 -0.029 (-78.80) (-3.67) (-4.95) (-2.27) Constant 10.903 2.665 3.466 2.735 (140.01) (7.72) (26.58) (25.07) R2 within 0.428 0.032 0.021 0.033 R2 between 0.402 0.001 0.001 0.000 R2 overall 0.393 0.007 0.002 0.010 Joint insignificance of
the fixed effects † 95.13 6.70 5.21 6.90 P-value (0.000) (0.000) (0.000) (0.000) Number of obs. 11986 9792 10357 10472
Average fixed effects
Domini sample 0.070* 0.030* 0.007 0.030* Non domini sample -0.184* -0.084* -0.019 -0.081*
Average fixed effects net of industry and size
Domini sample 0.034* 0.025* 0.007 0.024* Non domini sample -0.089* -0.070* -0.018 -0.065*
Legend of the dependent variables: Totsales: total sales per worker; R&D: Research and Development per worker; Roi
return on investment; Roe Return on Equity, Roce: Return on Capital Employed.
Legend of the regressors: Domini: dummy for affiliation in the Domini 400 index; Entry: dummy for entry into the Domini 400 index; Postexit: number of years after exit from the Domini 400 index; Military, Environment,
Productquality, Badgov.nce and Badlabour: dummies taking value of one the year of exit when the exit rationale
(Military, Environment, Productquality, Badgov.nce and Badlabour) applies, Size. Number of firm employees. Coefficients and t-stats of year dummies are omitted for reasons of space and available upon request.
* Subgroup means are significantly different at 95 percent.
Table 4.2 The impact of Domini affiliation on performance indicators (large capitalisation
firms excluded from the sample)
Var\Dep. Tot Sales ROI ROE ROCE
Domini 0.050 -0.172 -0.156 -0.119 (1.45) (-3.33) (-2.83) (-2.53) Entry 0.061 0.170 0.081 0.137 (1.11) (2.15) (0.95) (1.86) log(Postexit) -0.147 -0.596 -0.164 -0.617 (-1.58) (-3.46) (-1.17) (-4.38) Military 0.628 -0.227 -0.391 -0.212 (2.84) (-0.77) (-1.18) (-0.73) Environment 0.009 0.205 0.181 0.426 (0.05) (0.88) (0.75) (2.00) Product quality 0.185 -0.052 -0.592 -0.315 (0.98) (-0.17) (-2.10) (-1.28) Badgov.ce -0.121 0.070 -0.125 0.109 (-0.83) (0.34) (-0.59) (0.60) Badlabour -0.367 . -0.345 . (-0.67) . (-0.44) . Log(Size) -0.734 -0.056 -0.080 -0.034 (-66.90) (-3.58) (-4.42) (-2.27) Constant 10.743 2.910 3.530 2.739 (113.26) (21.67) (22.79) (21.07) R2 within 0.435 0.035 0.024 0.036 R2 between 0.483 0.000 0.000 0.002 R2 overall 0.478 0.007 0.004 0.011 Joint insignificance of
the fixed effects † 60.10 6.31 4.82 6.56 P-value (0.000) (0.000) (0.000) (0.000) Number of obs. 8361 6862 7345 7334
Average fixed effects
Domini sample 0.044* 0.043* 0.019* 0.038* Non domini sample -0.105* -0.109* -0.045* -0.092*
Average fixed effects net of industry and size
Domini sample -0.024* 0.032* 0.016* 0.026* Non domini sample 0.057* -0.079* -0.039* -0.063*
Legend of the dependent variables: Totsales: total sales per worker; R&D: Research and Development per worker; Roi
return on investment; Roe Return on Equity, Roce: Return on Capital Employed.
Legend of the regressors: Domini: dummy for affiliation in the Domini 400 index; Entry: dummy for entry into the Domini 400 index; Postexit: number of years after exit from the Domini 400 index; Military, Environment,
Productquality, Badgov.nce and Badlabour: dummies taking value of one the year of exit when the exit rationale
(Military, Environment, Productquality, Badgov.nce and Badlabour) applies, Size. Number of firm employees. Coefficients and t-stats of year dummies are omitted for reasons of space and available upon request.
* Subgroup means are significantly different at 95 percent.
Table 4.3 The impact of Domini affiliation on performance indicators (non R&D investing
firms)
Var\Dep. Tot Sales ROI ROE ROCE
Domini 0.158 -0.150 -0.085 -0.148 (5.11) (-3.05) (-1.63) (-3.34) Entry -0.015 0.048 0.053 0.164 (-0.31) (0.64) (0.64) (2.35) log(Postexit) -0.017 -0.331 0.0001 -0.219 (-0.20) (-1.92) (1.21) (-1.91) Military 0.542 0.298 -0.196 0.043 (2.42) (0.77) (-0.47) (0.13) Environment -0.362 -0.023 0.362 -0.065 (-1.53) (-0.06) (0.97) (-0.20) Product quality -0.168 0.055 -0.372 -0.354 (-0.99) (0.21) (-1.43) (-1.57) Badgov.ce 0.112 0.180 -0.020 0.138 (0.73) (0.79) (-0.09) (0.69) Badlabour 0.263 0.623 0.451 0.547 (1.39) (2.05) (1.54) (1.92) Log(Size) -0.789 -0.028 -0.067 -0.014 (-70.20) (-1.64) (-3.61) (-0.89) Constant 11.517 2.723 3.391 2.675 (118.66) (18.61) (21.19) (19.43) R2 within 0.462 0.032 0.020 0.035 R2 between 0.408 0.003 0.000 0.001 R2 overall 0.426 0.011 0.002 0.012 Joint insignificance of
the fixed effects † 69.11 6.13 3.96 5.37 P-value (0.000) (0.000) (0.000) (0.000) Number of obs. 8287 6563 7267 7307
Average fixed effects
Domini sample 0.055* 0.045* 0.010 0.045* Non domini sample -0.138* -0.119* -0.025 -0.113*
Average fixed effects net of industry and size
Domini sample 0.014 0.043* 0.012* 0.041* Non domini sample -0.036 -0.114* -0.031* -0.104*
Legend of the dependent variables: Totsales: total sales per worker; R&D: Research and Development per worker; Roi
return on investment; Roe Return on Equity, Roce: Return on Capital Employed.
Legend of the regressors: Domini: dummy for affiliation in the Domini 400 index; Entry: dummy for entry into the Domini 400 index; Postexit: number of years after exit from the Domini 400 index; Military, Environment,
Productquality, Badgov.nce and Badlabour: dummies taking value of one the year of exit when the exit rationale
(Military, Environment, Productquality, Badgov.nce and Badlabour) applies, Size. Number of firm employees. Coefficients and t-stats of year dummies are omitted for reasons of space and available upon request.
* Subgroup means are significantly different at 95 percent.
Table 4.4 The impact of Domini affiliation on performance indicators (non R&D investing
firms -large capitalisation firms are excluded from the sample)
Var\Dep. Tot Sales ROI ROE ROCE
Domini 0.090 -0.202 -0.177 -0.146 (2.32) (-3.37) (-2.76) (-2.71) Entry 0.020 0.193 0.075 0.182 (0.34) (2.12) (0.77) (2.19) log(Postexit) 0.035 -0.405 0.163 -0.532 (0.28) (-1.75) (0.78) (-3.25) Military 0.689 0.290 -0.246 -0.166 (2.49) (0.75) (-0.58) (-0.45) Environment -0.548 -0.124 0.208 0.059 (-1.92) (-0.25) (0.48) (0.16) Product quality -0.351 -0.047 -0.554 -0.445 (-1.61) (-0.14) (-1.70) (-1.59) Badgov.ce 0.051 0.115 -0.111 0.161 (0.32) (0.48) (-0.45) (0.77) Log(Size) -0.786 -0.057 -0.067 -0.030 (-57.58) (-2.78) (-3.01) (-1.57) Constant 11.090 2.966 3.212 2.600 (94.40) (17.05) (16.55) (15.61) R2 within 0.455 0.037 0.023 0.040 R2 between 0.500 0.005 0.001 0.003 R2 overall 0.505 0.011 0.006 0.015 Joint insignificance of
the fixed effects † 45.92 5.93 3.84 5.29 P-value (0.000) (0.000) (0.000) (0.000) Number of obs. 5975 4792 5308 5312
Average fixed effects
Domini sample 0.029 0.054* 0.022* 0.050* Non domini sample -0.068 -0.129* -0.051* -0.115*
Average fixed effects net of industry and size
Domini sample -0.039* 0.044* 0.020* 0.039* Non domini sample 0.090* -0.107* -0.045* -0.090*
Legend of the dependent variables: Totsales: total sales per worker; R&D: Research and Development per worker; Roi
return on investment; Roe Return on Equity, Roce: Return on Capital Employed.
Legend of the regressors: Domini: dummy for affiliation in the Domini 400 index; Entry: dummy for entry into the Domini 400 index; Postexit: number of years after exit from the Domini 400 index; Military, Environment,
Productquality, Badgov.nce and Badlabour: dummies taking value of one the year of exit when the exit rationale
(Military, Environment, Productquality, Badgov.nce and Badlabour) applies, Size. Number of firm employees. Coefficients and t-stats of year dummies are omitted for reasons of space and available upon request.
* Subgroup means are significantly different at 95 percent.
Table 5. GARCH (1,1) estimated conditional volatility for SR firms and the control sample
MEAN RETURN EQUATION DEPENDENT VARIABLE: RT
VARIABLES DOMINI INDEX
CONSTITUENTS VARIABLES CONTROL GROUP
Rt-1 0.1283** Rt-1 0.1250**
[7.4931] [7.0795]
DJUN -7.75E-05 DJUN -0.0002
[-0.4258] [-0.8587]
DMONDAY -0.0002 DMONDAY -0.0004**
[-1.2607] [-2.3157]
DTHURSDAY -0.0002 DTHURSDAY -0.0003*
[-1.3785] [-1.6532]
DWEDNESDAY 7.80E-05 DWEDNESDAY 0.0002
[0.4824] [1.0250]
DFRIDAY -4.60E-05 DFRIDAY -4.35E-05
[0.3026] [-0.2566] constant 0.0003** constant 0.0004** [2.9580] [3.4081] VARIANCE EQUATION DEPENDENT VARIABLE:
h
t VARIABLES DOMINI INDEXCONSTITUENTS VARIABLES CONTROL GROUP
2 1 − t
ε
-SR 0.0883** [5.9167] 2 1 − tε
-CA 0.0864** [13.699] 1 − th
-SR 0.9026** [147.909]h
t−1 -CA 0.8979** [126.947]Constant-SR 1.84E-07** Constant-CA 2.97E-07**
[5.9168] [7.2819]
Wald χ2 10352.3 Wald χ2 9904.3
Obs 3651 Obs 3651
Legend of the variables: ht: conditional variance estimated in the GARCH (1,1) model;