ENGINEERING PH.D. SCHOOL "LEONARDO DA VINCI" UNIVERSITY OF PISA
PH.D. PROGRAMME IN AUTOMATION, ROBOTICS, BIOENGINEERING
Dynamic Assessment of Cardiovascular Biomarkers
AUTHOR: Elisabetta Bianchini TUTOR Giovanni Pioggia January 2013 SSD: ING-INF/06
Dynamic Assessment of Cardiovascular Biomarkers
Elisabetta Bianchini University of Pisa
Abstract
The behaviour of cardiovascular parameters during exercise remains unsettled. Arterial stiffness is one of the most promising and innovative vascular biomarkers; this vessel property is usually evaluated at rest, but, since it aims to describe a stress-strain vessel behaviour, it is not a static parameter. Hence, our aim was to develop a method able to evaluate carotid elasticity dynamically in order to investigate if this analysis can provide information regarding differences between populations (i.e. patients and healthy subjects). We developed an approach based on a contour tracking algorithm applied to ultrasound B-mode image sequences and used it in conjunction with a local pressure estimation to assess carotid distensibility. The method's reproducibility was evaluated by analyzing a group of healthy volunteers during two sessions 3 days apart. Repeatability was expressed as coefficient of variation and satisfactory results were obtained in exercise.
After testing the robustness of the technique, the approach was applied during graded bicycle semi-supine exercise session in patients with known or suspected coronary artery disease (CAD)
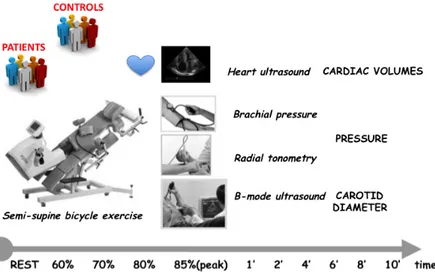
patients (20 men, 61±8years), and 18 healthy volunteers (9 men, 34±3 years) were recruited. Right carotid diameter (D) and distension (ΔD) were estimated by the developed ultrasound B-mode image processing method, and central pulse pressure (PPa) by radial tonometry; then, carotid elasticity was expressed as cross-sectional distensibility coefficient (DC). Besides the vascular evaluation we introduced the estimation of left-ventricular elastance (ElvI) by echocardiography, in order to obtain a more integrated dynamic picture including arterial-ventricular coupling. All measurements were performed at rest, peak of age-dependent maximal heart rate and during recovery.
At rest, D and PPa were higher in patients than in controls, whereas no significant differences were observed in ΔD and mean blood pressure; DC and ElvI were lower in patients than in healthy volunteers. At peak mean blood pressure increased both in patients and controls; DC significantly decreased and D increased in healthy subjects but not in patients. Finally ElvI highly increased in controls but not in patients. Behaviours of the two populations during recovery were similar.
Hence, we can conclude that the developed approach provides a suitable reproducibility for clinical studies and was able to dynamically discriminate between different kind of subjects. In particular, in patients with known or suspected CAD, carotid distensibility, which at rest is lower than in healthy controls, remains unchanged during maximal exercise, despite a similar increase in mean blood pressure in the two populations. This difference is underlined also by the absence of strong cardiac response and
From our preliminary results, the importance of a dynamic assessment of carotid elasticity was confirmed, and there is evidence of a clinical need including a simple and robust device to more easily perform this kind of analysis than by ultrasound. In our lab a first prototype based on vibration approach was designed and might be the suitable solution for implementing low-cost and easy carotid elasticity dynamic evaluation.
In the future, the cardiologist ambulatory might provide, besides cardiac and pressure monitoring, additive relevant clinical information from an arterial elasticity 24-hours device.
Acknowledgments
To my family: the apples and the trees from which they are born!
Acknowledgments
My thanks go to all my colleagues, my tutor Giovanni, Dr Rosa Sicari and Dr Eugenio Picano.
The research described in this thesis has been carried out at Institute of Clinical Physiology (IFC), CNR, Pisa and it was was supported by
INDEX
Introduction and aim 1
Chapter 1:
Ultrasound vascular biomarkers
1.1 Carotid intima-media thickness...……... 1.1.1 Clinical aspects and prognostic values... 1.1.2 Methodological and technical issues... 1.2 Carotid distensibility and stiffness ... 1.1.1 Clinical aspects and prognostic values... 1.1.2 Methodological and technical issues... 1.3 Non-invasive assessment of endothelial function: brachial
artery flow mediated dilation ...…….
1.1.1 Clinical aspects and prognostic values... 1.1.2 Methodological and technical issues...
5 7 7 7 14 14 15 21 21 23 Chapter 2: Materials and Methods
2.1 Development of a contour tracking algorithm for arterial diameter estimation... 2.1.1 The mass center of the gray level variability... 2.1.2 The normalized gradient of gaussian... 2.2 Assessment of carotid elasticity: reproducibility
evaluation...…….. 2.3 Assessment of carotid elasticity: patients and controls
comparison...……. 30 31 33 34 35 45 Chapter 3: Results 52
3.1.1 Gray-level discontinuities modeling... 3.1.2 The mass center of the gray level variability and the normalized gradient in the presence of the synthetic vessell border discontinuity...……..
3.1.3 The mass center of the gray level variability and the normalized gradient applied to vascular ultrasound image sequences...……..
3.2 Assessment of carotid elasticity: reproducibility evaluation...……..
3.3 Assessment of carotid elasticity: patients and controls comparison...……. 54 55 56 60 63 Chapter 4:
Discussion and Conclusions
4.1 Discussion...……... 4.2 Conclusions...……... 70 70 80 Chapter 5: Future perspectives 82 References 88 Appendix A 112
Introduction
Introduction and Aim
Cardiovascular disease is one of the major causes of mortality in the developed countries even though several cardiovascular risk factors, such as aging, smoking, hypercholesterolemia, diabetes mellitus and hypertension are well known today. This kind of disease may result in substantial disability and then largely contributes to the cost of the health care system. Efficient primary prevention, which includes the assessment, management, and follow-up of patients who risk cardiovascular diseases, is the best approach to the problem. However, the assessment of classical risk factors cannot offer an accurate estimate of the
Introduction
probability that a subject will suffer a cardiovascular event.
For this reason, the number of studies that propose methods for the evaluation of markers of subclinical cardiovascular disease have been increased significantly in the last years and these measurements proved to be independent predictors of cardiovascular events [1, 2, 3].
Among these great emphasis has been placed on the role of vascular parameters assessed by ultrasound data due to the non-invasiveness and low-cost of this technique. By processing ecographic data estimation of endothelial function by Flow-Mediated Dilation (FMD) [4], and analysis at the level of the carotid artery by Intima-Media Thickness (IMT) [5] and arterial stiffness [6], can be obtained. In particular, FMD ad IMT can be evaluated by ultrasonography, whereas indices of local arterial stiffness of superficial arteries can be estimated by measuring the diameter change during the heart cycle from ultrasound data in conjunction with the local pulse pressure.
The latter analysis, which is considered one of the most promising from a clinical point-of-view, is usually estimated from resting values; however, arterial stiffness is not a static characteristic but a function of pressure
Introduction
and therefore, parameters of local elasticity quantified in-vivo over a range of pressures could enhance the characterization of the elastic properties of the vessel. Recently, some authors [7] have estimated the arterial elastance index during exercise in patients with hypertension suggesting a gender related difference in dynamic arterial stiffness. Others [8] have characterized carotid distensibility via the isometric exercise pressor and they hypothesized that differences in vascular function with gender and age may only be recognized if arterial elasticity is quantified over a range of pressures. Besides the attention in dynamically evaluating the arterial elasticity, another recent hypothesis, based on the translation of flow-mediated dilation [9] assessment from the brachial artery to a less peripheral, larger and predisposed to atherosclerosis vessel, sounds interesting: some authors studied the carotid artery reactivity to hand grip (isometric exercise) by measuring the change in the vessel diameter following the stress with respect to the baseline, and concluded that this might be associated with coronary risk status [10]. Dynamic exercise, as well as hand grip increases sympathetic tone and is by far the most used stress test. The aim of the present project was to investigate the carotid artery’s response to dynamic exercise during
Introduction
exercise stress echocardiography, both in terms of diameter and local elasticity parameters.
During the first phase of the project the methodology was developed and then tested in a small group of healthy volunteers in terms of reproducibility. Subsequently, a clinical experimentation was performed; patients with known or suspected coronary artery disease (CAD), and healthy volunteers were analyzed in order to investigate if the assessment of dynamic parameters might allow a better characterization of the subjects and stronger discrimination between different populations, than a static evaluation.
Progress beyond state of the art
Indeed, although several studies reported an independent predictive value on cardiovascular events for arterial stiffness evaluated at rest, only a few studies, where parameters of vascular elasticity and reactivity were assessed dynamically, are available in literature. Hence, the originality of this project is due to the fact that it could provide analysis of the carotid site before, during and after exercise in order to obtain, at one time, a non-invasive and integrated picture of static and dynamic characteristics of this central district.
Chapter 1 - Ultrasound vascular biomarkers
CHAPTER 1
Ultrasound Vascular Biomarkers
Part of this chapter is obtained from the paper "Functional and structural alterations of large arteries: methodological issues." Bianchini E, Giannarelli C, Bruno RM, Armenia S, Landini L, Faita F, Gemignani V, Taddei S, Ghiadoni L.Curr Pharm Des. 2012 Nov 19. The paper is reported in Appendix A.
Cardiovascular disease is one of the major cause of mortality and morbidity worldwide. The prevention of this disease, which kills more people in the United States than do cancer, AIDS and car accidents together (data source: www.shapesociety.org) is a priority in public health. It is widely accepted by the scientific community that the description of the cardiovascular status of a person based only on classic risk factors such as smoking, obesity, hypercolesteromia and hypertension, is not enough in terms of clinical effectiveness nor in terms of cost to the NHS.
The ability to identify a "vulnerable" patient can be increased by the introduction of innovative biomarkers,
Chapter 1 - Ultrasound vascular biomarkers
such as those based on laboratory analysis and omics techniques, or the ones objectively measurable on biomedical signals and images. This approach, beside diagnostics and pharmacology, is particularly important when applied to implement a model for effective prevention able to detect the presence of vascular damage at the sub-clinical, asymptomatic stage preceding the onset of decades of disease. In this way effective screening and prevention can be obtained, that reduce the transition of the disease to deadly (for the patient) and expensive (for the National Health Service - NHS) clinical stages.
Of the various cardiovascular biomarkers introduced and studied in the scientific literature in recent years great emphasis has been placed on parameters that can be assessed by ultrasound data, since this approach is widespread, non-invasive, feasible and non-ionizating. Thus, great emphasis has been placed on the role of markers such as brachial Flow-Mediated Dilation (FMD), carotid Intima-Media Thickness (IMT) and arterial stiffness [1,2,3,4]. An accurate, robust and reliable methodology for the evaluation of these markers could improve their predictive value and allow them to be used for analysis in a large population.
Chapter 1 - Ultrasound vascular biomarkers
1.1 Carotid intima-media thickness
1.1.1 Clinical aspects and prognostic values
Carotid intima-media thickness (C-IMT), as measured by high resolution B-mode ultrasound of extra-cranial carotid arteries, is the most widely accepted non-invasive marker of subclinical atherosclerosis. C-IMT is considered an intermediate phenotype of atherosclerosis suitable for use in large-scale population studies [11]. Increased C-IMT has been associated with augmented cardiovascular risk [12, 13] as well as with presence of advanced atherosclerosis at different vascular sites including peripheral, cerebral and coronary areas [14,15]. Most importantly, epidemiological studies, including the Atherosclerosis and Risk in Communities Study (ARIC), the Rotterdam Study and the Cardiovascular Health Study, have consistently reported the predictive value of C-IMT for myocardial infarction or stroke independent of traditional cardiovascular risk factors [16-21].
1.1.2 Methodological and technical issues
C-IMT is included in the American College of Cardiology and American Heart Association guidelines as a class IIA recommendation for intermediate risk patients [22]. However, several methodological aspects should be
Chapter 1 - Ultrasound vascular biomarkers
taken into consideration for its correct evaluation as recently suggested by an expert’s review [23] since C-IMT value can be influenced by location of the measure, type of ultrasound data and features of the reading system.
A careful examination of previous studies on C-IMT reveals methodological discrepancies that must be taken into account for a proper interpretation of results. Inaba et al. [24] observed that 77% of the studies included in their meta-analysis did not indicate whether plaques were actually included in C-IMT analysis. In addition, 63% of the studies used maximal C-IMT, more likely reflecting focal thickening or plaque, instead of mean C-IMT. Furthermore, study design of C-IMT trials was heterogeneous since the definition of the landmarks of carotid segments (Common Carotid Artery, CCA, Carotid Bulb, CB or Internal Carotid Artery, ICA) selected to measure C-IMT differ significantly [25]. The far wall of CCA is the easiest of the three anatomical segments to examine, being the most commonly used measurement in clinical studies. Unfortunately plaques are rare at this site and studies of the relationship of C-IMT at this site are conflicting [26]. The carotid artery is a complex vessel, with differing associations for each segment regarding risk factors and outcome. Common
Chapter 1 - Ultrasound vascular biomarkers
carotid C-IMT is a better predictor of stroke than myocardial infarction [27, 28] and shows a better correlation with left ventricular mass than with coronary artery disease [26].
These data suggest that different pathological processes occur at distinct vascular sites of the carotid artery in different stages of disease. Indeed, the hemodynamics of the carotid artery in its different segments explains why atherosclerotic plaques are located in the carotid bulb and internal carotid artery than in the common carotid segment, which is affected in more advanced stages of the disease [29].
Several studies suggest the CCA far wall as the best location in terms of feasibility and reproducibility of the measure [30, 31] and this has been considered as the standard segment for the evaluation.
However, it might also be interesting to investigate whether information provided at CB or ICA, more challenging from a technical point of view, may show stronger correlation with classic risk factors [31]. Another point to take into consideration specifically referring to CCA is the variability in morphology and in vessel appearance under pathology. In particular, a horizontal image of the carotid artery cannot always be obtained depending on the anatomy of the subject, and
Chapter 1 - Ultrasound vascular biomarkers
this may be a problem for some automated segmentation techniques [32].
A post-hoc analysis to determine the best algorithm for determining CIMT using data from the METEOR study showed that ultrasound protocols that include CIMT measurements at multiple angles of both the near and far walls provide the best balance between reproducibility, rate of CIMT progression, treatment effect and their associated precision in this low-risk population with subclinical atherosclerosis [33].
Regarding the ultrasound data that can be used to obtain C-IMT evaluation, two main types are commercially available: B-mode image processing-based device and Radio-frequency (RF)-processing-based echo-tracking system [32]. In the past, estimation was obtained manually, but currently the assessment of C-IMT is generally obtained by automatic processing of these ultrasound signals [32]. RF data devices are considered very accurate since they are based on signals with higher spatial resolution than B-mode data [34, 35]. However, when comparing the performance in terms of reproducibility of this kind of technique with that of robust image-based systems, similar results are obtained [32, 36]. The repeatability of the two approaches was recently tested in the same population,
Chapter 1 - Ultrasound vascular biomarkers
obtaining similar coefficients of variation (5% for RF-based device and 6% for image processing systems, respectively) [36]. A good agreement between the two techniques in terms of Bland-Altman statistics was also reported. However, it must be pointed out that the quality of the final result of B-mode based systems is related to several issues which have to be carefully considered, such as quality of the scans and the system's setting. In particular, Potter et al. [37] studied the effects of changing dynamic range (DR), gain set and probe distance in C-IMT assessment by an image analysis software applied to an agar phantom. An increase in DR or gain causes a reduction in the measured wall thickness, whereas the distance of the probe did not influence the final result. Hence, DR and gain sets, but also other parameters such as depth gain compensation (DGC) or filtering should be standardized as suggested by international guidelines [38] or at least documented in follow-up analysis. Furthermore, Rossi et al. [39] analyzed the influence on carotid diameter evaluation of non-linear processing generally used in standard ultrasound equipment for better image visualization. In particular, these authors show that logarithmic compression and saturation can cause alteration when using approaches based on the gray
Chapter 1 - Ultrasound vascular biomarkers
level gradient, and the consequent small deviation might affect also the assessment of C-IMT. Another point to consider when working with standard US equipment is whether values obtained with newer apparatus are comparable to those obtained with older ones. A recent paper [40] reported the effects of transducer frequency on the final result by semi-automated analysis in a small group of patients. In particular C-IMT measurements obtained with standard (8 MHz) and high (14 MHz) frequencies were comparable.
Other features of the reading systems should be also considered for the assessment of C-IMT. Low-cost and user-friendly devices can make the diffusion of this vascular biomarker easier and faster. Hence, reliable and robust software based on B-mode image processing, which can be adopted with any standard ultrasound equipment, could provide an effective solution. Nevertheless they should be used according to international guideline suggestions, with particular attention to machine settings. Finally, it is worth noting that despite guideline suggestions introducing standardization in the measure, different approaches are available for C-IMT estimation in terms of analyzed data, (i.e., B-mode images or RF signal processing) or for anatomical sites. Thus, future analysis providing the
Chapter 1 - Ultrasound vascular biomarkers
agreement between different kinds of measurements and reference values for risk classification are needed in order to improve the clinical implications of C-IMT assessment.
Chapter 1 - Ultrasound vascular biomarkers
1.2 Carotid distensibility and stiffness
1.2.1 Clinical aspects and prognostic value
Arterial distensibility is a measure of the artery’s ability to expand and contract with cardiac pulsation and relaxation. Hypertension and other risk factors such as diabetes, dyslipidemia and smoking can alter the structural and functional properties of the arterial wall, leading to a decrease in arterial distensibility. This seems to be a common pathologic mechanism for many factors that lead to the occurrence and progression of the vascular changes associated with cardiovascular disease [35]. The aorta is a major vessel of interest when determining regional arterial stiffness, for at least two reasons: the thoracic and abdominal aorta makes the largest contribution to the arterial buffering function, [35] and aortic stiffness is an independent predictor of outcome in a variety of populations [8]. The measurement of aortic stiffness as carotid-to-femoral pulse wave velocity (PWV) by arterial tonometry is generally accepted as the most simple, non-invasive, robust, and reproducible method to determine arterial
Chapter 1 - Ultrasound vascular biomarkers
stiffness. However, it should be recognized that carotid-femoral PWV is not a direct measurement, since it is based on the acceptance of a propagative model of the arterial system. Thus, other arterial sites have potentially more interest: the measurement of local carotid stiffness may also provide important prognostic information, since the carotid artery, which is a superficial vessell that can be easily analyzed, is a frequent site of plaque formation.
1.2.2 Methodological and technical issues
Arterial stiffness can be estimated at the systemic, regional and local levels [35]. The local measure is generally obtained at the common carotid site, a large superficial artery that is easily accessible; this evaluation is considered particularly accurate, since unlike the systemic and regional evaluation, in this case arterial stiffness is determined locally and is estimated directly by pressure changes, which in turn determine the changes of volume of the vessel. The local assessment can be obtained by measuring the diameter of the vessel and its variations during the cardiac cycle (stroke change in diameter or distension) by ultrasound signal in conjunction with local pulse pressure estimation by tonometry [35].
Chapter 1 - Ultrasound vascular biomarkers
With ever-increasing attention focused on the clinical implications of arterial stiffening analysis, it is extremely important to take into consideration methodological aspects, regarding arterial diameter assessment by ultrasound influencing clinical study outcomes. Several factors should be considered when performing this kind of measurement, especially accuracy, precision and feasibility.
Two main approaches are available for arterial diameter assessment by ultrasound data: B-mode image processing based device [36, 41] and radio-frequency (RF)-based echo-tracking system [34]. Devices processing RF data are considered very accurate since they are based on signals with higher spatial resolution than mode data [35]. Furthermore, when adopting B-mode based systems some issues should be considered since the accuracy of this kind of device depends on many aspects such as the quality of the scans, and can be influenced by the system's setting. In particular, Potter et al [37] showed that dynamic range (DR), gain set and probe distance alter lumen diameter values obtained by an image analysis software applied to an agar phantom; an increase in DR, gain or distance causes a reduction in the measured diameter value. Hence, DR and gain sets, but also other parameters
Chapter 1 - Ultrasound vascular biomarkers
such as depth gain compensation or filtering should be documented and replicated when performing follow-up analysis on the same subject, and consensus guidelines adopted. As regards the distance's influence on the final measurement, the authors suggest keeping in mind this aspect when interpreting the reported effects of weight changes on arterial diameter. Furthermore, Rossi et al. [39] showed that non-linear processing used to improve the B-mode image visualization on standard ultrasound equipment could affect the diameter measure obtained by edge-detection algorithms. In particular, the authors show that logarithmic compression and saturation can cause alteration when using approaches based on the grey-level gradient. Another aspect should be taken into consideration when using methods based on edge-detection for diameter assessment on ultrasound images: the location of a grey-level discontinuity corresponding to an artery interface depends on the mathematical operator adopted and on its particular configuration. Consequently, it is possible that an edge detector converges to a point slightly different from the real localization of the interface [36]. This issue is relevant when tracking the two walls of a longitudinal section of the vessel in order to compute the diameter; in fact, in this case the grey-level discontinuities of the
Chapter 1 - Ultrasound vascular biomarkers
near and far border respectively are in opposite directions, and different convergence points result in different measures. On the other hand, when evaluating distance where the grey-level discontinuities corresponding to the two edges are in the same direction, like the C-IMT evaluation, the possible different point of convergence does not influence the resulting measurement. A similar consideration can be drawn regarding distension, since it is computed as the subtraction of two diameter values and hence is not influenced by the edge location [36].
RF-based devices are generally also considered more precise than video-image systems, which are limited by the spatial resolution of pixel analysis. For this reason, precision for video-image analyzers is usually estimated to be about 150 µm (i.e., the size of the pixel) [35] and this would be insufficient for determining arterial stroke change in diameter. However, it is important to point out that methods are available based on algorithms with sub-pixel precision, able to evaluate change in a diameter less than 15 µm [36, 41] and therefore suitable for local arterial stiffness assessment. In addition, studies investigating precision in terms of repeatability of instantaneous arterial diameter evaluation by ultrasound data processing are available in literature
Chapter 1 - Ultrasound vascular biomarkers
[42]: coefficients of variation (CV) of the parameters involved in arterial elasticity evaluation which are considered appropriate for studying their physiological and pathophysiological variations, are shown in [43-45].
As an example Selzer et al. [45] reported a CV of 1.28% for arterial diameters and from 11.05 to 14.54% for carotid stiffness indices. Kool et al [44] found a CV of 4.5% for carotid diameters, 7.9% for distension and 8.3 to 9.1% for arterial stiffness parameters.
Furthermore, in a recent work [36] reproducibility of RF- and image-based techniques were assessed in the same population showing comparable reproducibility and good agreement. Hence, it might be concluded that high spatial resolution of RF-based methods is not mandatory for standard clinical examination. This point might be even more interesting when considering how important it is to document the independent predictive value of carotid stiffness on cardiovascular events; so far only a few studies where parameters of carotid elasticity were used are found in the literature and the development of user-friendly and relatively inexpensive systems for assessing carotid diameter and distension would be important. In addition, besides the RF-systems, B-mode based devices that can also provide the automatic measure of carotid C-IMT are available
Chapter 1 - Ultrasound vascular biomarkers
and are able to furnish both functional and structural parameters of the analyzed vessel, as suggested by the international expert consensus [35].
RF-based echo-tracking devices are considered the reference technique providing optimal conditions in the simultaneous measurement of local arterial stiffness and C-IMT for their high precision; however, since this kind of data output is not easily available in standard ultrasound equipment, reproducible and robust B-mode based technique (that can be applied to any ultrasound equipment) in conjunction with international guidelines, can be considered an effective alternative.
Chapter 1 - Ultrasound vascular biomarkers
1.3 Non-invasive assessment of endothelial
function: brachial artery flow mediated dilation
1.3.1 Clinical aspects and prognostic values
Endothelium plays a primary role in the control of vascular function [46] by the production of nitric oxide (NO), which derives from the transformation of L-arginine into citrulline by the constitutive endothelial enzyme NO synthase (eNOS), under the stimulus of agonists (acetylcholine, bradykinin, and others) acting on specific endothelial receptors and of mechanical forces, namely shear stress [47]. In pathological conditions, the same stimuli determine the production of endothelium-derived contracting factors (EDCFs, e.g., thromboxane A2 and prostaglandin H2), which counteract the relaxing activity of NO, and reactive oxygen species (ROS) which impair endothelial function by causing NO breakdown. In such conditions, reduced NO availability and EDCF not only exert an opposite effect on vascular tone, but also facilitate the pathogenesis of thrombosis and atherosclerotic plaque by promoting platelet aggregation, vascular smooth
Chapter 1 - Ultrasound vascular biomarkers
muscle cell proliferation and migration, and monocyte adhesion [48].
This pivotal role of the endothelium in the atherosclerotic process led to the development of different methods to assess endothelial function, which could provide novel insights into patho-physiology and a clinical opportunity to detect early disease, quantify risk, judge response to interventions designed to prevent progression of early disease, and reduce later adverse events in patients [49, 50].
Endothelial function in clinical research is mainly tested by vascular reactivity studies [49]. The most widely used technique is the so-called “flow-mediated dilation” (FMD) of the brachial artery. This is a non-invasive, Ultrasound-based method, introduced in 1992 [51]. FMD occurs as a result of local endothelial release of NO and it is measured as brachial artery diameter changes in response to increased shear stress, induced by reactive hyperemia and measured [52, 53]. To this aim the sphygmomanometer cuff placed on the forearm distal to the brachial artery is inflated to 200 mmHg and subsequently released 5 min later. Endothelium-independent dilator response can be tested by low-dose sublingual nitroglycerin [54]. FMD has been studied widely in clinical research as it enables serial evaluation
Chapter 1 - Ultrasound vascular biomarkers
of young subjects, including children [51]. It also permits testing of lifestyle and pharmacological interventions on endothelial biology at an early preclinical stage, when the disease process is most likely to be reversible [50]. Impaired FMD has been shown in hypertensive patients and in the presence of the other cardiovascular risk factors [54-58].
1.3.2 Methodological and technical issues
Assessment of brachial FMD in clinical investigation has increased because it is non-invasive and apparently easy to perform. However, several challenges must be overcome that are major limitations to a widespread application of this method in clinical studies. These challenges include the need for highly trained operators, the expense of the equipment, and also the care required to minimize the effect of environmental or physiological influences [59]. Furthermore, other caveats should be considered in designing a study where FMD is investigated for the biological and technical variability of its measurement, including appropriate study design and sample size and efforts to achieve a uniform technique and minimize operator-dependency, including the adoption of probe-holding devices and automated systems to measure brachial artery diameter changes [60-63].
Chapter 1 - Ultrasound vascular biomarkers
It is important to note that variations in technique, such as the position of the occluding cuff and duration of inflation, may produce results that are less representative of local NO activity, since FMD is also partly determined by the magnitude of post-ischemic forearm vasodilatation, which is a measure of microcirculatory function [50]. Interestingly, the use of upper cuff occlusion was associated with one of the few negative reports on the prognostic role of FMD [64], although a recent meta-analysis showed that studies applying the upper cuff occlusion technique showed similar prognostic predictive values compared with those using the lower cuff technique [65].
Training and certification of sonographers in FMD procedure has been well-described in guidelines [61] and proven by results in recent multicenter trials by the small number of rejected examinations, due to poor quality and/or instability of the images [66, 67].
The use of a clamp to hold and adjust probe position, as well as a computerized system to automatically measure brachial artery diameter are currently required to obtain the best reproducibility of this non-invasive technique [9, 49, 68] as recently also shown in multicenter settings [66, 67].
Chapter 1 - Ultrasound vascular biomarkers
As of today, only a few experienced research centers apply a rigorous methodology to achieve a high standard of accuracy and reduce FMD variability [69]. The lack of uniform methodology, including all the above-mentioned procedures, is a major limitation, although not the only one, for the application of FMD assessment in large multicenter studies. We recently evaluated the time-dependent variability of FMD measurements obtained in more than 130 healthy volunteers by trained operators according to a uniform technique [67]. This included centralized analysis by an automated edge detection system, composed of a special-purpose hardware/software device for measuring changes in brachial artery diameter [70, 71]. The study showed for the first time that adherence to a rigorous protocol, with certified operator training as well as defined experimental settings (adjustable stereotactic probe-holding device, automated computer-assisted brachial artery measurements), is feasible in different research centers, ensures high quality examinations and, most of all, provides an optimal time-dependent reproducibility of FMD. In particular, a similar coefficient of variation (close to 10%) for intra-session (1 h apart) and inter-session (1 month apart) FMD assessment was shown and the overall FMD variability was comparable
Chapter 1 - Ultrasound vascular biomarkers
with that observed by the authors who originally described the non-invasive method for FMD using a similar methodology [69]. Thus, this approach should be implemented in all studies investigating FMD as a surrogate marker of cardiovascular disease.
As already stated, automated, computer-based analysis of brachial artery diameter changes [70, 71] is fundamental for the assessment and reproducibility of FMD testing. At the present time, automatic systems for FMD assessment are based on both post-processing and real-time analysis, thus working offline and online, respectively. In particular, real-time systems offer several advantages enhancing reliability and precision of FMD measurement [72]. Mainly, a real-time feedback signal generated during the scan acquisition and strictly related to the algorithm performance could continuously inform the operator about the quality of the ultrasound images. This aspect is of particular importance in FMD studies because in these examinations, the quality of the image is a critical component that can compromise the success of the measurement. Indeed, a proper image must be maintained for several minutes to best quantify the transitory response induced by the endothelium. For this reason, adjustments of the position of the probe may be required during the
Chapter 1 - Ultrasound vascular biomarkers
examination, especially to compensate for small movements of the patient. The sonographer is largely helped in this task by immediate feedback from the measurement system. As a final result, the number of examinations rejected due to low-quality post-processing analysis could be reduced [66, 67, 72]. Another advantage of online analysis is the reduction in time spent analyzing the images after acquisition and the absence of those drawbacks associated with video storing. Recording the video means a reduction of image quality, while an acquisition on a personal computer requires a large amount of memory. Moreover, the real-time characteristic improves the operator's learning curve, significantly reduced by this approach [72] another major challenge for FMD assessment [61].
Finally, another important characteristic of the FMD technique is the timing of the procedure, with respect to the cardiac cycle. In fact, vasodilatations induced by reactive hyperemia are not much larger than the diameter variations between systole and diastole [70, 71]. Guidelines suggest using electrocardiogram (ECG) gating during image acquisition [61], where the onset of the R-wave is used to identify the end diastole, and this is currently the method most commonly used both for
Chapter 1 - Ultrasound vascular biomarkers
manual and automatic analyses. However, this requirement influences the complexity of the ultrasound equipment adopted for the examination. Nowadays, high frequency linear array transducers are also available in less expensive hand-carried ultrasound devices, which are being used more and more in research and clinical practice. Although such devices produce high quality B-mode images, they may lack ECG trigger capabilities, which are at times provided as an option with a significant increase in the overall cost of the system. On the other hand, modern automatic measurement methods used in FMD examinations have become faster and more precise, thus allowing a continuous measurement of the diameter curve with a sample rate of 25 to 30 samples/s. By using these systems, information on the timing with respect to the cardiac cycle can be obtained by directly analyzing the diameter curve, without the need for an ECG trigger. Also, working at 25/30 frames per second ensures greater reliability against noise, analyzing a greater number of frames for diameter measurements, so FMD technique is more suitable for centralized readings.
Some issues remain unresolved in FMD measurement. In particular, agreement was not reached on the normalization of the percentage variation brachial
Chapter 1 - Ultrasound vascular biomarkers
diameter by the amount of the reactive stimulus (e.g. shear rate) that induced vasodilation. As a consequence, several papers present FMD values as not normalized, especially in the past. Recently, this problem has been recognized and a debate on how to normalize FMD values was started. At the present, the maximum shear rate, the full shear rate area under the curve and the shear rate area under the curve up to the peak of the FMD have been proposed as potential normalization factors with the last one as the most promising in terms of efficacy [60-63].
Lastly, some interesting new topics are still waiting answers in the FMD area. Among these, the need for reference values that could be used in clinical studies is the most interesting and imperative point. By this means, clinicians would be able to stratify populations and share results more easily.
Chapter 2 - Materials and Methods
CHAPTER 2
Materials and Methods
The elasticity of a vessell can be estimated by ultrasound data processing for arterial diameter assessment in conjunction with a local pressure measure. These direct measurements allow calculating arterial distensibility as the ratio between the stroke change in the lumen area (i.e. the variation of the area during the cardiac cycle) and the local pulse pressure, normalized by the diastolic lumen area.
During the first phase of this project we compared two different edge detectors applied to ultrasound images for the evaluation of the arterial diameter, in order to adopt the more suitable. Then we implemented the method for carotid diameter estimation and we used it in conjunction with tonometry for pressure evaluation, in order to measure carotid distensibility in a group of healthy controls during graded bicycle semi-supine exercise test. During this second part of the project we tested the robustness of the algorithm in terms of reproducibility: the control group was analyzed in two
Chapter 2 - Materials and Methods
different sessions and coefficients of variation suitable for clinical applications were obtained. Finally, we applied the approach to a group of subjects with known or suspected coronary artery disease (CAD) in order to investigate differences in dynamic behaviour between healthy controls and patients.
2.1 Development of a contour tracking algorithm for arterial diameter estimation
Arterial elasticity is an innovative non-invasive cardiovascular biomarker. In fact, vessel elasticity decreases in presence of cardiovascular disease and its accurate assessment permits early and efficient prevention. This parameter can be evaluated in superficial arteries by measuring instantaneous vessel diameter in conjunction with local pressure. The temporal changes of the diameter are highlighted on ultrasound images by movements of the vascular walls, which are usually not greater than few pixels. Therefore, to obtain a useful plot of arterial diameter variation, an algorithm which is able to locate edges on the image plane with a subpixel resolution is required. Moreover, in clinical analysis (that might require real-time
Chapter 2 - Materials and Methods
performances) the computational cost of the algorithm is also critical. With this work two subpixel edge operators were implemented in Matlab and compared in order to choose the most suitable for vascular analysis: the normalized gradient of Gaussian (NGoG) and the mass center of the gray level variability. First, from a significant set of B-mode images of a human artery we derived a simple model of the gray level discontinuity provided by the vessel borders. The model, which is given by the sum of a smoothstep discontinuity and a Gaussian function, was subsequently used to analyse the performances of the two operators. In this way, the best configurations of the two edge operators were defined by varying the work conditions. Subsequently, we generated a set of ultrasound synthetic images using the simulation software Field II [73] to verify the resolution of the two edge detectors in ultrasound applications. A sequence of 100 realistic images of an artery, with a resolution of 13 pixels/mm and with a diameter ranging from 3.9mm to 4mm, was obtained with steps of 0.01mm. In this way, a real ultrasound vascular exam was simulated, with temporal changes of the diameter generating movements of the arterial walls which were less than 2 pixels. Finally, the two
Chapter 2 - Materials and Methods
algorithms were used for analysis of arterial diameter in in-vivo studies.
2.1.1 The mass center of the gray level variability
The first absolute central moment is a statistical filter which measures the variability of the gray levels of the image with respect to the local mean. Let f(x,y) be the gray level map of an image, and let g(x,y,σi) be normalized Gaussian weight functions. The following relationship is used to compute the first absolute central moment at a point p of coordinates x,y.
(1)
Moreover, the mass center b of the gray level variability associated to the first absolute central moment can be computed at p:
Chapter 2 - Materials and Methods
In [74] it is shown that if configurations of eq. (2) with σ1=σ3/π are used then vector b always locates a point p' which is closer to the nearest discontinuity than p, independently of the distance between p and the discontinuity. Therefore, given the points pi of an approximate starting contour, a discontinuity can be located by iteratively computing vector b at pi where the starting points for any new iteration are the points p'i which are located with the previous iteration.
2.1.2 The Normalized GoG
Another mathematical operator which can be used to process gray level discontinuities is known as the normalized gradient of Gaussian (NGoG). On real discontinuities when given an approximate starting contour, the points of the final contour can be located by computing iteratively NGoG from the points of the starting contour [74, 75]. Let f(x,y) be the image gray level map and g(x,y,σ) be a Gaussian function with σ2>a. A vector u, which locates a set of points p'i that are closer to the discontinuity than pi is obtained when computing NGoG at the points pi of a starting contour. In this case also, given an approximate starting contour, the relative discontinuity can be located by iteratively computing vector u.
Chapter 2 - Materials and Methods
(3)
2.2 Assessment of carotid elasticity:
reproducibility evaluation
Part of this paragraph is obtained from the paper "Assessment of carotid elasticity during exercise: a reproducibility study". Bianchini E, Bruno RM, Corciu AI, Faita F, Gemignani V, Ghiadoni L, Picano E, Sicari R. Ultrasound Med Biol. 2012 Feb;38(2):223-30.
The paper is reported in Appendix A.
After choosing the most suitable edge-detector operator, we implemented in Matlab a contour tracking algorithm for the carotid analysis in exercise. This technique, in conjunction with a local pulse pressure evaluation, can provide estimation of arterial elasticity. In order to evaluate the robustness of the developed approach, a pilot study in a group of healthy volunteers was performed. Variability of the technique was estimated by coefficient of variation as reported in the subsequent paragraphs.
Study population
A group of 18 healthy untrained volunteers were recruited for the study (9 males, age 34 ± 3 years, BMI =
Chapter 2 - Materials and Methods
22 ± 6 kg/m^2, 3 smokers). Subjects with overt cardiovascular disease, diabetes, hypertension, major non-cardiovascular diseases or who engaged in competitive sports were excluded. None of the subjects were taking any medication at the time of the study or during the previous week. The study protocol was approved by the local ethics committee and informed consent was obtained from all subjects.
Experimental procedure
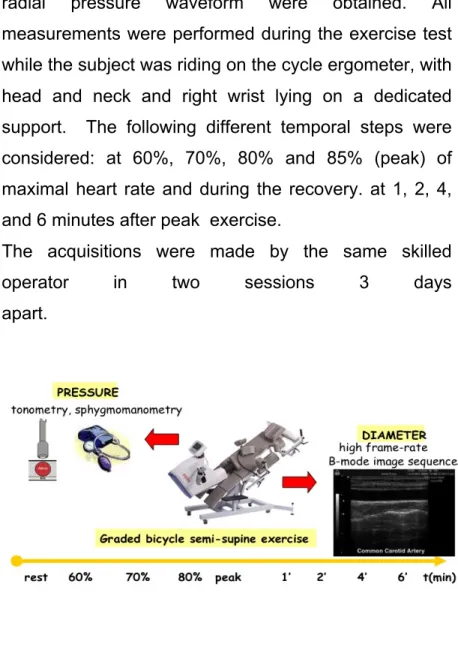
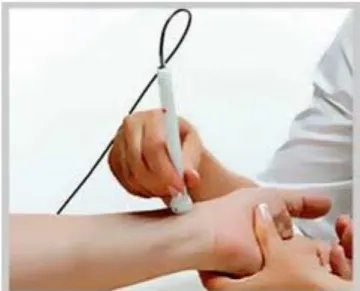
The subjects were analyzed in two different sessions 3 days apart, in order to evaluate the intersession repeatability of carotid elasticity parameters in exercise. The examinations were all performed in the afternoon after a light lunch in a temperature-controlled room according to current guidelines [6]. The subjects avoided taking caffeine-containing beverages and smoking in the 3 h preceding the experimental sessions. In each session a maximal exercise test was performed on a graded bicycle semi-supine ergometer (Fig. 1) [76]. Workload was increased by 25W every 2 min.
Theoretical maximal heart rate (HRmax) was computed for both male and female subjects, as:
HRmax = 220 - age [in years]
In order to estimate arterial elasticity, acquisitions of carotid ultrasound images, brachial blood pressure and
Chapter 2 - Materials and Methods
radial pressure waveform were obtained. All measurements were performed during the exercise test while the subject was riding on the cycle ergometer, with head and neck and right wrist lying on a dedicated support. The following different temporal steps were considered: at 60%, 70%, 80% and 85% (peak) of maximal heart rate and during the recovery. at 1, 2, 4, and 6 minutes after peak exercise.
The acquisitions were made by the same skilled
operator in two sessions 3 days
apart.
Figure 1. Experimental setup
Techniques
Chapter 2 - Materials and Methods
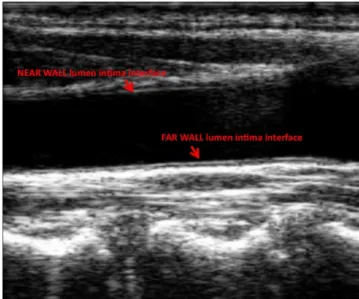
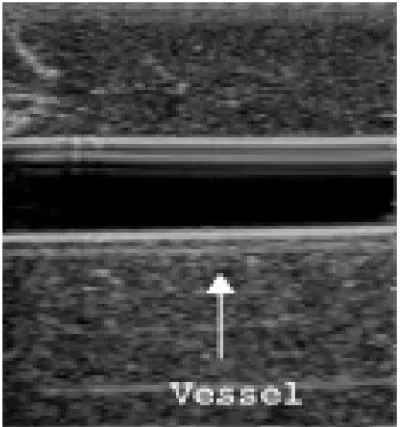
After the first part of the work described in the previous paragraphs, we developed the algorithm for the automatic evaluation of the instantaneous carotid diameter based on the most suitable mathematical operator and implemented it in Matlab (The MathWorks, Natick, MA, USA). The method is based on a contour tracking technique that allows the automatic evaluation of diameter stroke changes (i.e. difference between maximum and minimum values) during the heart cycle. The method assesses the instantaneous diameter of the artery by processing B-mode ultrasound sequences of the longitudinal section of the vessel. An example of B-mode image of the carotid artery and its interfaces is reported in Figure 2.
Chapter 2 - Materials and Methods
For each image, lumen-intima interfaces are automatically detected using the algorithm based on the edge operator "First Order Absolute Moment" and diameter is estimated as the distance between far and near lumen-intima interfaces.
The procedure must be initialized by providing two approximated starting borders, an operation that also defines the region of interest where the diameter will be computed. After this simple initialization procedure, the elaboration proceeds automatically: in each image of the video sequence the two borders of the vessel are located, then the diameter is calculated as the distance between such borders.
We have to point out that the two borders of the vessel are not of the same quality. The near wall (NW), that is the border which is closer to the probe, is generally less defined than the far wall (FW). The closeness of a multiple tissue layer, mainly the wall of the vessel, in the space between the transducer and the border is the reason for this. Such a structure, when crossed by the ultrasound beam, provokes a reverberation of the ultrasound energy which degrades the quality of the final image. The border which is further from the probe, by contrast, is better defined since this is the first interface which the ultrasound beam crosses.
Chapter 2 - Materials and Methods
Due to this characteristic of the images, the FW can be located more easily and more accurately than the NW. For this reason, in each image it was first located the FW, then it was used as a reference point for the computation of the NW.
The other feature we exploited is that the area internal to the vessel is less noisy than the external area. This difference is due to the presence of the blood, which generates weak echoes. The presence of a region with less noise is advantageously exploited by the edge detection algorithm. This is obtained simply by forcing the algorithm to locate the two borders by starting from the internal part of the vessel.
These two peculiarities were used to affect the way the approximated contours are obtained. As for the FW, it was assumed that for, each image, the contour computed on the previous image FW(n-1) is a good estimation of the current contour FW(n). This statement is generally true because there is a very little movement of the walls between two adjacent images. However, as it was previously mentioned, it was preferable to start from an approximated contour aFW(n) in the inner region of the vessel, where the noise is smaller. For this reason aFW(n) was computed as the segment parallel
Chapter 2 - Materials and Methods
to FW(n-1) at a distance ε1 towards the inner part of the vessel.
Concerning the NW, the same strategy was used to obtain an approximated contour aNW(n). However, since in most of the images the quality of the NW is worse than the quality of the FW, it was computed aNW(n) by starting from the FW(n) already computed on the current image instead that from the contour NW(n-1) computed on the previous image. Let d be an estimation of the diameter of the vessel computed as the mean value of the diameters calculated on the previous Nd images, then aNW(n) is obtained as the parallel to FW(n) at a distance (d-ε2). ε2 is a constant greater than zero, which was added to start from the inner region of the vessel, as well as it was done for FW.
Once the two borders of the vessel have been obtained, the diameter is computed. In theory, the two borders should be parallel but, in practice, this hypothesis is not exactly true and an approximation must be introduced in the computation of the diameter. Since it was assumed the FW is better estimated than the NW, the FW is taken as the reference line and the diameter is computed as the distance between the central point of the segment NW and the line FW. Finally, the mean value of diameter is computed
Chapter 2 - Materials and Methods
on 10 beats of examination, in order to reduce the effect of cycle-to-cycle variability on the final result.
As regard data processing for the assessment of variations in diameter during the cardiac cycle (stroke change in diameter or distension [6]), several other computational stages are included:
• After a band-pass filtering, the maximum (systolic) and minimum (diastolic) diameter values are identified for each cardiac cycle.
• The stroke change in diameter is calculated for each cardiac cycle as the difference between the systolic and diastolic diameter values.
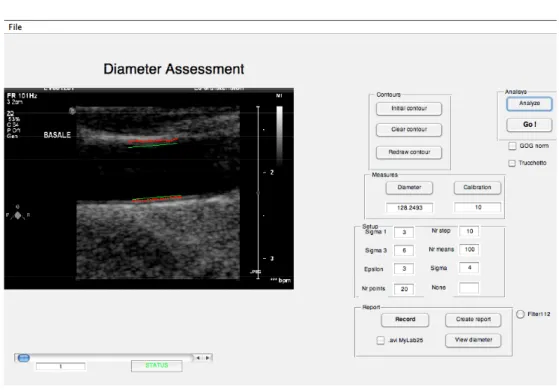
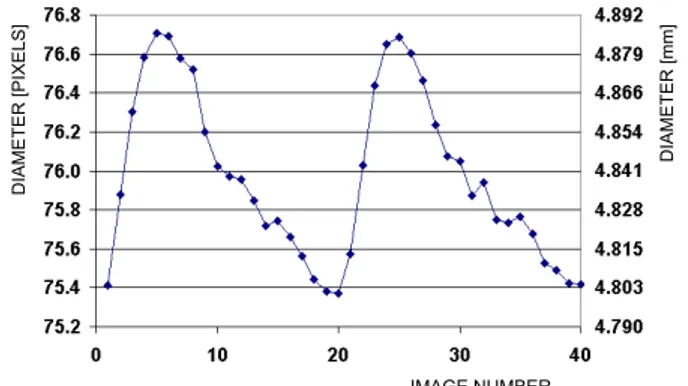
• The mean distension value is computed as the average of the results obtained during the last 10 beats. The algorithm in this study was customized for high frame rate (i.e., > 25 frame/s) application. High frame rate, which ensures high temporal resolution, is needed in order to track the rapid wall movements of the vessel due to the high cardiac frequency in exercise. A graphical-user-interface (GUI) was developed in Matlab (Figure 3) in order to analyse the sequences: the user has just to trace an initial region-of-interest, then the algorithm is able to automatically track the vessel borders.
Chapter 2 - Materials and Methods
Figure 3. GUI for ultrasound image sequences analysis
Carotid image sequences in DICOM format (frame rate ~ 100 f/sec), were acquired and then analyzed off-line. Data were excluded when image quality was considered insufficient (i.e., the algorithm was not able to correctly track vessel borders).
Blood pressure measurement
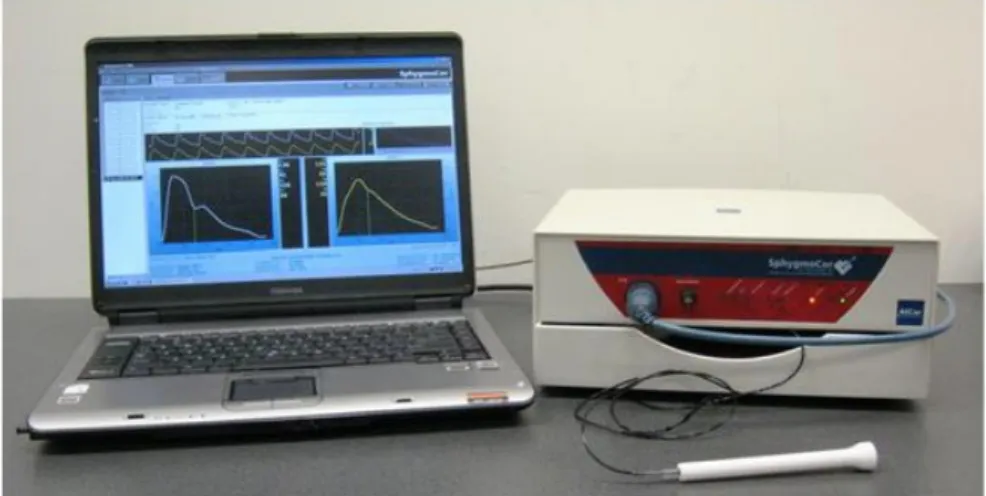
Radial tonometry was performed in order to evaluate central pressure by radial to aortic transfer function (commercial device: Sphygmocor, Atcor Medical, Figure 4 and Figure 5). Central aortic pressures provide important information about cardiovascular status, but
Chapter 2 - Materials and Methods
direct measurements are invasive. Peripheral pressures can be measured noninvasively, and although they differ from central pressures, they can be mathematically transformed to approximate the latter. Hence transfer functions between aortic and radial pressures was calculated by parametric model and introduced in the scientific community more the 15 years ago [77].
For each step of exercise and recovery we applied this technique. In particular, the radial waveform was acquired and then calibrated by using the arm blood pressure automatically recorded at the right brachial artery (by a Dinamap XL device). In fact, diastolic and mean blood pressures can be assumed to be constant along the arterial tree and this allows to calibrate the radial waveform from the brachial values.
Chapter 2 - Materials and Methods
Figure 5. Acquistion of radial pressure waveform by tonometry
Quality index (QI) for central pressure waveform was automatically provided by Sphygmocor software: measurements were considered acceptable with QI > 75 at rest and QI > 50 during exercise.
Since carotid and aortic pressure estimations by tonometry (at least at rest) showed good agreement, with differences around 1-2 mmHg [78], final data obtained by the Sphygmocor system were used, together with diameter values, to assess carotid elasticity parameters.
Chapter 2 - Materials and Methods
Ultrasound B-mode image sequences (image resolution = 100 pixels/cm, DICOM format, 100 frame/s, 10 beats) of the right common carotid arteries were acquired and analyzed by the customized algorithm for evaluation of arterial diameter (D) and distension (ΔD). The common carotid arteries were scanned in longitudinal section using an iE33 Philips machine and a 10-MHz linear-array probe. Arterial diameter borders were tracked in the near and far wall lumen-intima interfaces 1 cm proximal to the carotid bulb in a region 1 cm wide and free of plaques. The bulb was considered an anatomic fiducial point and a picture of the adopted ultrasound image was printed in order to ensure similar location of the measurements between the first session and the second one performed 3 days later. During vascular scanning, time-gain-compensation and depth settings were fixed. In addition, systolic and diastolic brachial pressures were measured and central pulse pressure obtained by radial tonometry as described above. Local elasticity was then obtained for each step of the examination and expressed as:
cross sectional distensibility coefficient, DC = ΔA /( PPa*Ad)
where ΔA represents the stroke change in lumen area, PPa the central pulse pressure and Ad the diastolic
Chapter 2 - Materials and Methods
lumen area, respectively. ΔA and Ad were evaluated from the diameter values, assuming the cross-section of the artery to be circular.
Reproducibility data
The volunteers were analyzed in two sessions 3 days apart, in order to evaluate the intersession repeatability of the arterial elasticity measurements (CC and DC). For each step of the examination, in each volunteer, variability was expressed as the coefficient of variation (CV), which is defined as the ratio of the standard deviation to the mean of the two measurements; the mean of CVs from all the subjects was then computed. CVs of pressure and diameter’s evaluation were also obtained.
Furthermore, the reproducibility of each parameter for the whole examination was estimated by using the intraclass correlation coefficient. The two-way random effects model was adopted [79].
All calculations were made using SPSS software (SPSS version 13.0 for Windows, 2004).
2.3 Assessment of carotid elasticity: patients and
controls comparison
After testing the robustness of the developed approach, carotid elasticity dynamic behaviour was assessed both in controls and patients. Besides this vascular analysis,
Chapter 2 - Materials and Methods
also a cardiac evaluation was performed during the exercise in order to investigate differences in arterial-ventricular coupling too.
Study population
In addition to the 18 healthy volunteers (9 men, 34±3 years), 36 consecutive patients with known or suspected coronary artery disease, CAD, (20 men, 61±8years) were analysed.
Chapter 2 - Materials and Methods
Table1: characteristics of the analyzed population
Vascular evaluation
Carotid elasticity was obtained as described in the previous paragraph. The subjects underwent a maximal exercise test on a graded bicycle semi-supine ergometer. Workload was increased by 25W every 2 min.
Also in this protocol theoretical maximal heart rate (HRmax) was computed for both male and female subjects, as:
Chapter 2 - Materials and Methods
As previously described in order to estimate arterial elasticity, acquisitions of carotid ultrasound images, brachial blood pressure and radial pressure waveform were obtained. All measurements were performed at baseline and during the exercise test at peak of the age-dependent maximal heart rate while the subject was riding on the cycle ergometer, with head and neck and right wrist lying on a dedicated support. Recovery analysis was also obtained at 1, 2, 4 ad 6 minutes after peak.
Cardiac evaluation
Besides the carotid distensibility, also an important cardiac parameter, the left-ventricular elastance (ElvI), was evaluated in the analysed subjects during the exercise (Figure 6).
Cardiac volumes were estimated by 2D transthoracic echocardiography, and blood pressure by applanation tonometry. From these direct measurements ElvI was then calculated as the ratio between ESP and ESV, normalized by the body surface area, where ESP represents the systolic pressure, ESV the end-systolic volume. ElvI reflects left ventricular contractility, but it is also influenced by biochemical and morphological features of the cardiac tissues. In particular, changes during stress conditions (i.e.
Chapter 2 - Materials and Methods
exercise) can give us information about cardiac performance, and its behaviour in conjunction with the carotid analysis might give a more integrated and accurate picture of the cardiovascular status of a subject.
Also the cardiac measurements were performed at rest and peak of the age-dependent maximal heart rate, and during recovery.
Controls and patients data were analyzed by two-ways ANOVA, considering time intervals and population as factors, p < 0.05 was considered significant.
Figure 6. Experimental set-up for analysis in controls and patients
Chapter 3 - Results
CHAPTER 3
Results
As described in the previous chapter, during the first phase of this project we compared two different edge detectors applied to ultrasound images for tracking vessell borders, in order to choose the best to implement a new approach for arterial diameter estimation in exercise. After developing the method for carotid diameter estimation, we adopted it in conjunction with pressure evaluation by tonometry, for dynamic carotid distensibility estimation in a group of healthy controls. During this second part of the project we tested the reproducibility of the algorithm in order to evaluate if it is suitable for clinical applications: the control group was analyzed twice and coefficients of variation were obtained. Finally, we applied the technique, in conjunction with a cardiac analysis, to a group of subjects with known or suspected coronary artery disease (CAD) to evaluate possible differences in dynamic behaviour between healthy controls and patients.
Chapter 3 - Results
In this chapter we will summarize the obtained results.
3.1 Development of a contour tracking algorithm for arterial diameter estimation
3.1.1 Gray-level discontinuities modeling
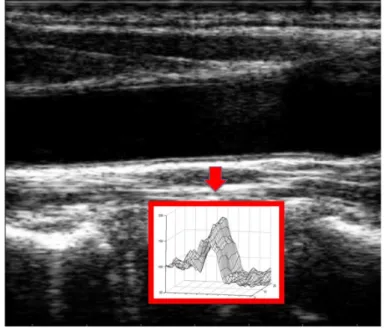
We acquired and observed a set of real B-mode images of the carotid artery, in order to obtain a realistic model of the gray level discontinuity associated with the artery borders. In the figure below the gray level discontinuity associated to the artery border is shown.
Figure 1. Carotid longitudinal B-mode image and profiles of the gray level discontinuities at the far artery border
Chapter 3 - Results
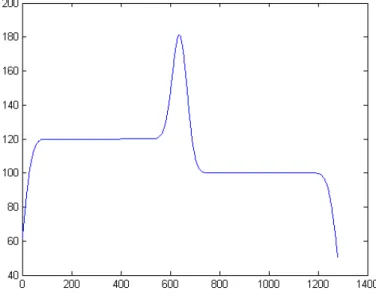
After this analysis, we derived a synthetic discontinuity similar to this real profile from the sum of a smoothstep discontinuity and a Gaussian function. An image (1280x1280 pixels) with two gray levels 120/100 i.u. (intensity unit) was used as a base. The step was then smoothed with a 2D Gaussian kernel with σ2=30 pixels and a 1D Gaussian with σ=30 pixels was added. The maximum value of the obtained discontinuity model was equal to 180 i.u.. This mathematical model of the arterial gray level discontinuities is shown in the picture below.
Figure 2. One-dimensional mathematical model of the gray level discontinuity associated to the artery borders