FACOLTÁ DI INGEGNERIA
DIPARTIMENTO DI INFORMATICA, SISTEMI e PRODUZIONE
P H D T H E S I S
to obtain the title of
PhD of Science
Specialty : Computer Science
Agent Based Modeling and
Simulation for critical and
interdependent systems
Defended by
Emanuele Galli
Course: XXII
A.Y. 2009/2010
Thesis Advisor
Coordinator
Acknowledgments
First, I would like to sincerely thank my advisors Salvatore Tucci and Emiliano Casalicchio.
Salvatore, from his personal big experience, gave me always ex-cellent suggestions to my research and also to other topics external to my own area.
Emiliano has been my personal inspiration and helped me soon to find the correct direction in my research field. We have worked together in many topics and we have obtained together really good re-sults. Today I consider Emiliano a friend and I hope to keep working and having other extraordinary experiences with him in the future.
I would also thank my university friends with whom we have shared happiness, gaiety, satisfactions, but also, sometimes, disap-pointment and sadness moments. In particular I would remind my friends Emiliano Betti, Francesca Fallucchi, Cristina Giannone, Fabio Dellutri, Gianluca Grilli, Vittorio Ottaviani, Danilo Croce and Diego De Cao.
A special thank goes to Donato Griesi, who I will never forget for the rest of my life and keeps living in my heart and in my thoughts . I spent an unforgettable year in Los Alamos National Laboratory, working with Stephan Eidenbenz, who has been my mentor and co-author. Here I met really brilliant young people from all the world and I would like to express my heartfelt thanks to Ha Duc, Chiara Pozzi, Milan Bradonjić, Guanhua Yan, Shiva Kasiviswanathan and Andrea Asztalos.
Finally, I would like to thank my Love Michela, my brother Massi-miliano, my parents Emilia and Antonio, Michela’s parents Serenella and Giulio, for their continuous love and support.
Agent Based Modeling and Simulation for critical
and interdependent systems
Abstract:
The research community has been just recently at-tracted by the study of critical infrastructure. All related topics can be grouped in the so called "critical infrastructure protection" (CIP). Lewis1 defines the study of CIP as "the study of challenges to be metand solutions to be found". He also divides the challenges of CIP in seven possible categories, which are:
1. Vastness: related to the vastness of problem, which renders impractical to protect all infrastructures;
2. Command: associated to the problem to define who takes the last decision;
3. Information Sharing: the absence of a clear way to share and distribute information among different infrastructures made data completely incompatible;
4. Knowledge: every infrastructure has its own domain and tech-nology, so it is very hard to have a whole knowledge of a so vast complex system;
5. Interdependencies: every infrastructure depends on many other ones directly or indirectly. Dependencies are caused by human organizational structures as well as physical linkage between components;
6. Inadequate Tools: there is not yet a general approach or tool to study critical infrastructure;
1Presented in Critical Infrastructure Protection in Homeland Security:
7. Asymmetric Conflict: small attack can produce big damages. Such scenario has also attracted us specifically in the study of hu-man and physical interdependencies, their own valuation and quan-tification. In particular, the goal of this thesis has been to provide a framework for the simulation and analysis of physical, geographical, informational and temporal interdependencies using the agent based modeling and simulation approach with the theory and architecture of distributed simulation in order to allow the reuse of already imple-mented simulators as well as to increase performances and to scale the problem. We have also used the micro-simulation as an alterna-tive approach to the study of critical infrastructure. For such aim, we have implemented a simulator of road-traffic using the parallel and discrete events approach in order to simulate daily traffic in big cities and to evaluate how other infrastructures and individuals de-pend on transportation system. The major contributions are as in the following:
• We introduce a new model to simulate and analyze critical in-frastructures and their interdependencies using the agent based modeling and simulation. An agent is an entity which has a spe-cific behavior that can be influenced by the environment, the memory and experience of the agent, can interact with the envi-ronment and other agents (heterogeneous and homogenous) to reach the same goal, has a specific geographical position. The agent based modeling and simulation has been used to simulate and to define physical and geographical interdependencies. • We have used the parallel and distributed simulation to reuse
already implemented and well-tested specific sector simulators as well as to distribute the load and increase both performances and scalability. Such characteristics allow to simulate a big sce-nario composed of thousands and thousands of components and
multiple infrastructures at the same time. Moreover we have used a standard as the High Level Architecture so that the framework can be easily extended with new sector simulators. Information interdependency as well as physical one is simu-lated directly by the sector simulators.
• We have used the standard representation to geo-reference ob-jects in order to create realistic scenario and reuse real stake-holders data.
• We have also considered the workload generated by the people on the infrastructure networks during their regular activities while is still a big challenge to provide the workload during catastrophic events.
• We have developed a parallel and scalable micro-simulator for transportation network which uses the discrete-event queue model which uses the workload generated by the daily activ-ities simulator.
• We have introduced some new metrics to measure direct and indirect interdependencies using collected data from sector sim-ulators. Such metrics are really helpful for managers who have to take important decisions to prevent catastrophic events and to reduce the risk of threats.
Keywords:
Critical Infrastructure, Agent Based Modeling and Simulation, parallel and distributed simulation, HLA-RTI1 Introduction 1
1.1 Motivation . . . 1
1.2 Critical infrastructures models and approaches . . . . 4
1.2.1 Analytic approach . . . 5
1.2.2 Simulation approach . . . 6
1.3 Contribution. . . 7
1.4 Outline. . . 9
2 Models for critical interdependent infrastructure anal-ysis 11 2.1 Analytic Models. . . 15
2.1.1 Qualitative and semi-qualitive models . . . 16
2.1.2 Input-output models . . . 16
2.1.3 Indicative system dynamics models . . . 17
2.1.4 Hybrid System Modeling . . . 18
2.1.5 Hierarchical Holographic Modeling . . . 19
2.1.6 Topological and complex network models . . . 20
2.2 Simulation Models . . . 21
2.2.1 Agent Based model . . . 21
2.2.2 Multi-domain or federated simulation model . 22 2.2.3 Petri nets model . . . 23
2.3 Critical Infrastructures Projects . . . 24
2.3.1 Projects survey . . . 25
2.3.2 The Service-Focused approach IRRIS . . . 30
2.3.3 The Federative approach DIESIS . . . 31
2.3.4 The Supply and Demand System approach I2Sim 33
3 Federated Agent Based Model 37
3.1 Agent-based modeling of interdependent complex
sys-tems . . . 39
3.1.1 The Federated agent-based model . . . 40
3.1.2 Interconnecting Agents: The Interdependen-cies Model . . . 43
3.1.3 The Federated ABMS methodology . . . 44
3.2 The case study . . . 45
3.3 Implementation Issues . . . 48
3.3.1 Implementation of agents. . . 48
3.3.2 Federation of the agent-based model(s) and sector specific models . . . 49
3.3.3 Interaction between the agent model and the sector specific model . . . 50
3.3.4 Orchestration of the Federated agent-based simulation model . . . 51
3.4 Concluding Remarks . . . 51
4 Design and implementation of Fed-ABM&S to study IT infrastructure 53 4.1 The case study . . . 55
4.2 Federated agent-based modeling and simulation soft-ware architecture . . . 58
4.2.1 Federated ABM&S methodology. . . 61
4.2.2 The HLA-Repast . . . 62
4.2.3 The HLA-OMNeT++ . . . 65
4.3 Preliminary Interdependencies Analysis . . . 70
4.4 Concluding Remarks . . . 77
5 ActivitySim: workload generator for Infrastructure Simulation 79 5.1 Introduction . . . 79
5.2 The ActivitySim Architecture . . . 82
5.2.1 The SimCore DES Framework . . . 82
5.2.2 The SimCore Agent Layer - AgentCore . . . . 83
5.2.3 ActivitySim . . . 84
5.3 ActivitySim Modeling Paradigms . . . 86
5.3.1 Utility Functions . . . 89
5.3.2 Constraints . . . 91
5.3.3 Priority functions . . . 92
5.3.4 Needs function . . . 93
5.3.5 Location selection function . . . 94
5.3.6 Objective function . . . 94
5.3.7 Optimization Algorithm . . . 95
5.4 Large example results. . . 97
5.5 Concluding remarks. . . 98
6 FastTrans: a distributed, large scale simulator for Transportation System 101 6.1 Introduction . . . 101
6.2 Traffic Modeling Through Realistic Activity Generation102 6.2.1 Queue Model of Road Networks . . . 104
6.2.2 Activity Modeling. . . 105 6.3 Software Architecture . . . 105 6.3.1 FastTrans Architecture . . . 106 6.3.2 Integrated Simulations . . . 107 6.4 Performance Tuning . . . 109 6.4.1 Routing in FastTrans . . . 109
6.4.2 Partitioning and Load Balancing . . . 114
6.5 Experimental Results . . . 117
6.5.1 Partitioning and Load Balancing . . . 118
6.5.2 Computational Scaling Results . . . 120
7 Metrics 133
7.1 Introduction . . . 133
7.2 Metrics to quantify Critical Infrastructure interdepen-dencies . . . 135
7.2.1 Shape metrics . . . 135
7.2.2 Core metrics. . . 139
7.2.3 Statistical measures for interdependencies quantification . . . 140
7.2.4 A Methodology to compute Core and Shape metrics. . . 141
7.3 The Case Study . . . 142
7.4 Interdependencies analysis . . . 142
7.4.1 Propagation of outages scenario . . . 143
7.4.2 Rescue of wounded scenario . . . 145
7.5 Concluding Remarks . . . 149
8 Conclusions 151
2.1 Critical Infrastructures modeling . . . 13
2.2 The Leontief and general cascading models [22] . . . 18
2.3 Example of Hybrid System Model [29] . . . 19
2.4 Tools survey for modeling of critical infrastructure (de-velopers and areas) [38]. . . 28
2.5 Tools survey for modeling of critical infrastructure (chracteristics) [38] . . . 29
2.6 The Implementation-Service-Effect CI metamodel [18] 31
2.7 DIESIS architecture [77] . . . 32
2.8 I2Sim ontology: cells, channels, tokens and controls [57] 34
2.9 I2Sim: cell and channel model [57] . . . 35
2.10 Tools survey for modeling of critical infrastructure for IRRIS, DIESIS and I2Sim . . . 36
3.1 The federated agent-based model . . . 41
3.2 The distributed agents implementation. FA is the fed-erate ambassador, A the agent model, DM the sec-tor specific simulation model and FDD the FOM Data Document . . . 50
3.3 The centralized agents implementation. FA is the Fed-erate Ambassador, A the agent model, DM the on model and FDD the FOM Data Document . . . 50
4.1 Agent-based Modeling & Simulation (a) v.s. Federated ABM&S (b) . . . 55
4.2 The Civic Emergency Management scenario. . . 56
4.3 HLA architecture of a federation and of a federate . . 59
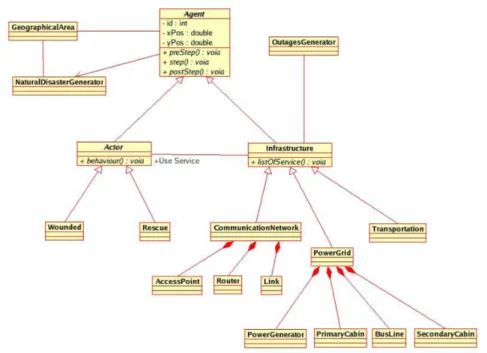
4.5 Entity Class Diagram of HLA-Repast for the critical
infrastructure scenario . . . 64
4.6 HLA-OMNeT++ architecture . . . 66
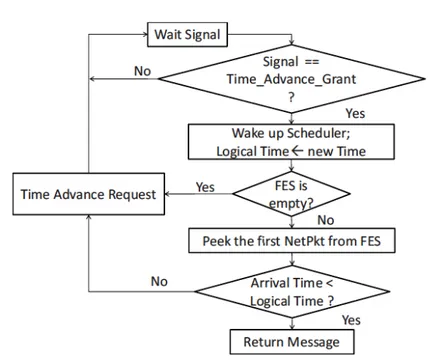
4.7 Flow chart of *getNextEvent() method . . . 69
4.8 Crisis resolution time. . . 74
4.9 Downgrade of the crisis resolution time and of the av-erage wounded agent pickup time. . . 75
4.10 Percentage of the rescued and died wounded agents. Died wounded agents are classified as died because not picked up and died because picked up too late. . . 76
5.1 Overview of Software Architecture. . . 83
5.2 ActivitySim Inputs, Modules, and Think Loop . . . . 86
5.3 Optimization Loop . . . 87
5.4 Example Utility Functions . . . 90
5.5 Example Priority Functions . . . 93
5.6 Example of produced schedule . . . 99
5.7 Running time per simulated day . . . 100
6.1 Distributed-memory model of FastTrans . . . 107
6.2 Modular software architecture of the integrated simu-lator . . . 108
6.3 Comparison of the execution times of the two modules for a 32-CPU parallel run of a medium sized US city 110 6.4 Nodes expanded in A? (shown in blue) vs. Dijkstra (shown in green). The red squares are the source and destination nodes, with the source being at the center. Dijkstra expands the search tree in all directions from the source node, while A? is more directed . . . . 112
6.5 A routing query where A? performs markedly better,
expanding only about one percent of the nodes (blue) compared to Dijkstra (green). On average, in our com-putations A? expands 82% lesser nodes than Dijkstra 112
6.6 Logarithmic chart showing various overheads for Dijk-stra, optimized DijkDijk-stra, and A? in a serial simulation run . . . 113
6.7 Execution profile of FastTrans with A? in a serial sim-ulation on a 3 GHz Mac-Pro work-station . . . 113
6.8 Execution profile of FastTrans with A? in a parallel simulation on a 32-CPU Linux infiniband I/O cluster. 113
6.9 Figure illustrating road-network density in the New York region . . . 123
6.10 Figure illustrating distribution of event load in the New York region . . . 123
6.11 Figure illustrating distribution of routing load in the New York region . . . 123
6.12 Figure illustrating assignment of entities under geo-graphic partitioning scheme. All entities with the same color are assigned to the same processor . . . 124
6.13 Figure illustrating assignment of entities under scatter partitioning scheme. All entities with the same color are assigned to the same processor. . . 124
6.14 A zoomed in version of the Figure 6.13. The scatter scheme assigns close by entities to different processors 124
6.15 Comparison of execution times of FastTrans (as a func-tion of #CPUs) under different partifunc-tioning schemes 125
6.16 Comparison of the number of messages passed in Fast-Trans (as a function of #CPUs) under different parti-tioning schemes . . . 125
6.17 Computational load distribution of FastTrans in a 256 CPU run under scatter partitioning. Each bar repre-sents the load on one CPU . . . 126
6.18 Computational load distribution in FastTrans in a 256 CPU run under pure geographic partitioning . . . 126
6.19 Computational load distribution in FastTrans in a 256 CPU run under geographic partitioning with balanced entities . . . 127
6.20 Computational load distribution in FastTrans in a 256 CPU run under geographic partitioning with balanced event load (estimated) . . . 127
6.21 Computational load distribution in FastTrans in a 256 CPU run under geographic partitioning with balanced routing load . . . 128
6.22 Comparison of fairness of computation load in Fast-Trans under different partitioning schemes . . . 128
6.23 Execution time of FastTrans as a function of #CPUs 129
6.24 Memory usage per node in Fast- Trans as a function of #CPUs . . . 129
6.25 Messages passed in FastTrans as a function of #CPUs 130
6.26 Comparison of execution times of FastTrans, Activi-tySim, and the integrated simulation as a function of #CPUs . . . 130
6.27 Comparison of the memory usage per node in Fast-Trans, ActivitySim, and the integrated simulation as a function of #CPUs . . . 131
6.28 Comparison of the number of messages passed in Fast-Trans, ActivitySim, and the integrated simulation as a function of #CPUs . . . 131
7.1 The proposed taxonomy for Interdependency quantifi-cation metrics . . . 136
7.2 Difference between shape metrics (a) and core metrics (b-c) . . . 137
7.3 An example of relationship between sector specific metrics and direct metric. . . 138
7.4 The proposed methodology to compute shape and core
metrics from sector specific metrics. . . 141
7.5 Overall throughput of the communication network . . 144
7.6 Zoom of the overall throughput at the beginning of the power grid outage, t = 100tics (left), and at the end, t = 400 (right). . . 146
7.7 CDF of the crisis resolution time Tc . . . 147
7.8 CDF of the wounded rescue time Tr . . . 147
7.9 CDF of the percentage of died agents Wd . . . 148
7.10 CCDF of the percentage of rescued wounded . . . 148
7.11 Summary of the interdependencies metrics character-istics . . . 150
2.1 Legend for Petri Net Model in[42] . . . 24
4.1 The main simulation parameters . . . 71
4.2 Classes of wounded agents, their percentage and time to live . . . 72
7.1 90th percentile of Tc (sec.), Tr (sec.) and Wd(%) . . . 146
Introduction
Contents
1.1 Motivation . . . 1
1.2 Critical infrastructures models and approaches 4
1.2.1 Analytic approach . . . 5
1.2.2 Simulation approach . . . 6
1.3 Contribution . . . 7
1.4 Outline . . . 9
1.1
Motivation
The current industrial and technology development of a country relies on availability and correct operation of multiple infrastructures. If we take the Oxford dictionary, an infrastructure is defined as "the basic physical and organizational structures and facilities (e.g., buildings, roads, and power supplies) needed for the operation of a society or enterprise".
Even though most of dictionaries have a similar definition, the political institutions have often changed and modified their own def-inition in the last twenty years. This is principally due to the fact that we have seen an escalation of terroristic attacks especially in
regard to destructive effects. Most of us still remember tragic mo-ments of 2001 in New York, 2004 in Madrid and 2005 in London. During such attacks most of infrastructures have been seriously af-fected either directly or indirectly. So, if at the beginning engineers as well as politicians were concerned about the quality and adequacy of an infrastructure, today they are more interesting in their protec-tion. Protection today does not mean only to prevent to be attacked, but, especially, to ensure a continuos flow of services for every sin-gle infrastructure and to mitigate the risk that if an infrastructure cannot offer the standard level of service, all other infrastructure are minimally affected and can keep operating.
On August 14, 2003 failures of some software system was one of contribution to the blackout in Northeast and Midwestern USA and in Ontario, Canada [66]. Even though some essential services re-mained in operation, cell phones system, water system and rail sys-tem were heavily affected. Though everyone can generally imagine that a blackout could affect other infrastructures, it is much harder to imagine the opposite. On January 25, 2003 the SQL Slummer warm [90] started to spread around the world infecting more than 75.000 hosts in the first 10 minutes and caused big slowing downs of Internet. Successively it was able to penetrate and disable a safety monitoring system of Davis-Besse nuclear power plant. Such a case puts in evidence the importance of cyber-security today. In 2007 one of the biggest Distributed Denial of Service (DDoS) attack in Estonia [4], one of the most computerized country in the world, ob-ligated the government to shut down several of its own key systems. Since the current Estonia’s government and economy is based on high tech technologies (citizens can ballot at home using Internet), banks, ministries, newspapers and broadcasters were put out of service.
Such threats have obligated countries to draft some shared docu-ments and to create a plan to protect all infrastructures. The USA patriot act of 2001[12] and, successively in 2004, the USA ’s
Congres-sional Research Service drafted a report [61] to define and identify current critical infrastructures. In like manner during the 2006 the Commission of European Communities distributed a document [16] for defining an overall strategy among all countries of the community for the protection of Critical Infrastructures. Even though the cited reports as well as other ones of different nations do not identify same infrastructures, there is an important fact shared by all countries: if twenty years ago infrastructures were considered only public works of a nation, today they contemplate both public and private work of different sectors.
Even the research community has been recently attracted by the study of critical infrastructure. All related topics can be grouped in the so called "critical infrastructure protection" (CIP). In [87] Lewis defines the study of CIP as "the study of challenges to be met and solutions to be found". He also divides the challenges of CIP in seven possible categories which are:
1. Vastness: related to the vastness of problem which renders im-practical to protect all infrastructures;
2. Command: associated to the problem to define who takes the last decision;
3. Information Sharing: the absence of a clear way to share and distribute information among different infrastructures made data completely incompatible;
4. Knowledge: every infrastructure has its own domain and tech-nology, so it is very hard to have a whole knowledge of a so vast complex system;
5. Interdependencies: every infrastructure depends on many other ones directly or indirectly. Dependencies are caused by human
organizational structures as well as physical linkage between components;
6. Inadequate Tools: there is not yet a general approach or tool to study critical infrastructure;
7. Asymmetric Conflict: small attack can produce big damages. Such scenario has also attracted us specifically in the study of hu-man and physical interdependencies, their own valuation and quan-tification. Moreover in this thesis we want to provide a tool as general as possible which can be used in most of scenarios.
Before presenting contributions of this thesis, we introduce some of already proposed models and solutions that we can find in litera-ture.
1.2
Critical infrastructures models and
approaches
The goal of critical infrastructure model is to study their interdepen-dency so that we can prevent both direct and cascade effects. Taking into account of the proposed categorization of Rinaldi (2001-2004) [74] dependencies can be classified in terms of: physical, cyber, geo-graphic, or logical dependency. Physical interdependencies is related to the production of materials or services used by an other one. The risk of failure from normal operating conditions in one infrastructure will be a function of risk in another infrastructure. Cyber interde-pendencies occur when state of an infrastructure depends on infor-mation transmitted through the inforinfor-mation infrastructure. This is the type of complex system whereby control of a networked system is dependent upon the transmission of information. Geospatial in-terdependencies involve the physical proximity of one infrastructure
to another. An event such as a catastrophic event in an urban area could create correlated disruptions with other infrastructures, such as communication and electric services to a community. Logical ones are all other kind of interdependencies. They could be, i.e., economic or political.
A revision of Dudenhoeffer, Permann and Boring (2004) called logical interdependencies as policy ones, that occur when there is a binding of infrastructure components due to policy or high level decisions.
Finally the same Dudenhoeffer and Permann with Manic in 2006, aside the already presented interdependencies, introduced a new one that is the societal interdependency. Differently from the policy terdependency, the societal interdependency refers principally to in-terdependencies or influences than an event on an infrastructure com-ponent may impact on societal factors such as public opinion, public confidence, fear and cultural issues.
Interdependencies analysis depends also on temporal and econ-omy scales. In case of temporal scale the dynamics of infrastructures varies from milliseconds (e.g. power plants and network communi-cations) to hours (e.g. water systems). In case of economy scale it measures how much the cost of an infrastructure depends on an other ones and how the economy could be affected.
Follows a brief description of some related works that uses analytic and/or simulated approach for the analysis of interdependencies.
1.2.1
Analytic approach
Analytic approaches give us a higher overview of the problem and generally is not possible to evaluate with such methodologies all kinds of interdependencies. So we should use more than one only analytic approach to cover all problems. In literature we can find several analytic approaches that are from completely different domain like
network, electric, economy, etc...
For example, the topological approaches adopt models of inter-dependencies between nodes at level of topology and their structural properties. They use the so called perimetring procedure to individ-uate and identify the set of network of an infrastructure A (auxil-iary network) necessary to the infrastructure B (behaving network). Topological approaches necessity stakeholders data to construct the two networks. The topological approaches measure the probability that a node of B fails when a node of B is removed. The average of such metrics should give us the robustness of a network.
Other approaches like the holistic ones, rather than to decompose the infrastructure into its components in order to analyze their inter-actions, analyze each infrastructure assumed as a single entity and try to emphasize how the behavior of a single infrastructure is able to affect the behavior of other infrastructures.
These approaches are generally more abstract, simplified and qualitative than the previous ones. They can be set-up more easily even if they appears not useful from an operative point of view. More-over, while the topological approaches generally refer to the coupling between only two infrastructures, this type of approach is naturally designed to consider in the same time more infrastructures.
The holistic approaches appear more able to analyze interdepen-dencies in terms of services exchange rather than the topological for-mulation (that are, on the contrary, more effective to analyze physical interdependencies). Hence they are able to provide ordinary indica-tors more useful for strategic analysis rather than for operational plans.
1.2.2
Simulation approach
The simulation approach allows to model, in deeper details, critical infrastructures coupling and their behavior.
Theoretically, a simulation model allows to do the measurement of every observable value and then every modeled interdependency. For example, if we have geo-referenced infrastructures, it is possible to model geographical inter-dependencies in case of natural disasters and, hopefully, to quantify them with an appropriate metric.
Simulation approach can be subdivided in base of time models (discrete, continuos), if they use time-stepped or discrete-events ap-proach, in base of representation models like entities or agents, in base of level of detail, and if they are serial, parallel or distributed programs. During the selection of a simulator, we should always consider which characteristic are important for us: performance, ac-curacy, usability, distributability, etc..
1.3
Contribution
The goal of this thesis is to provide a framework for the simulation and analysis of physical, geographical, informational and temporal interdependencies using the agent based modeling and simulation ap-proach with the theory and architecture of distributed simulation to allow the reuse of already implemented simulators as well as to in-crease performances and to scale the problem. We have also used the micro-simulation approach to simulate road-traffic using a parallel and discrete events approach in order to simulate daily traffic in big cities and to evaluate how other infrastructures as well as individuals depend on transportation system. The major contributions are as in the following:
• We introduce a new model to simulate and analyze critical in-frastructures and their interdependencies using the agent based modeling and simulation. An agent is an entity which has a spe-cific behavior that can be influenced by the environment, the memory and experience of the agent, can interact with the
en-vironment and other agents (heterogenous and homogenous) to reach the same goal, has a specific geographical position. The agent based modeling and simulation has been used to simulate and to define physical and geographical interdependencies. • We have used the parallel and distributed simulation to reuse
al-ready implemented and well tested specific sector simulators as well as to distribute the load as well as to increase both perfor-mances and scalability. Such characteristics allow to simulate a big scenario composed of thousands and thousands of compo-nents and multiple infrastructures at the same time. Moreover we have used a standard as the High Level Architecture so that the framework can be easily extended with new sector simu-lators. Information interdependency as well as physical one is simulated directly by the sector simulators.
• We have used the standard representation to geo-reference ob-jects in order to create realistic scenario and reuse real stake-holders data.
• We have also considered the workload generated by the people on the infrastructure networks during their regular activities while is still a big challenge to provide the workload during catastrophic events.
• We have developed a parallel and scalable micro-simulator for transportation network which uses the discrete-event queue model which uses the workload generated by the daily activ-ities simulator.
• We have introduced some metrics to measure direct and indi-rect interdependencies using collected data from sector simula-tors. Such metrics are really helpful for managers who have to
take important decisions to prevent catastrophic events and to reduce the risk of threats.
1.4
Outline
The thesis is organized as in the following. The chapter 2 presents deeply some of the most famous related works. We present both an-alytic and simulated approach for the analysis of interdependencies.
The chapter 3 is dedicated to definition and formalization of an ar-chitecture that can embrace so many different domains. To overcome this difficulty we have used agent based modeling and simulation ap-proach together with parallel and distributed simulation technique. The whole system is simulated as a composition of multiple systems that can communicate, exchange information and send events each other. Every system is an agent while a specific sector simulator simulates the agent behavior. Agents and specific sector simulators are synchronized thanks to distributed simulation approach that per-mits to put together heterogeneous simulators as well as to distribute and to balance the load. WIth such an architecture, domain experts have to be concentrated principally only on their domains defining correctly what their system provide and what they need from other ones.
The chapter 4 presents an implementation of the proposed frame-work, which federates Repast, an agent-based simulation engine and OMNeT++ an IT systems and communication networks modeling and simulation environment. We have used both the High Level Ar-chitecture and an own arAr-chitecture to federate the two simulators.
In chapters 5 and 6 we present the micro-simulation technique applied to the individual daily activities generation as well as to the transportation network. The micro-simulation is an other technique deeply based on parallel simulation in order to maximize the level
of details to the detriment of necessary effort to develop such kind of system and hypothetical performance issues. ActivitySim is the simulator of daily activities. In ActivitySim, activities are generated using a synthetic-population, meta-heuristic algorithms that take into consideration the current position, the last performed activity, prior-ities of activprior-ities and some constraints (e.g. duration and maximum, minimum time). Daily activities have been used to generate the workload for the transportation network simulator FastTrans. The FastTrans has been used to evaluate some optimization algorithm for the shortest path as well as some partitioning schemas for load balancing, including geographic partitioning (that assigns simulation entities that are geographically close by to the same processor) and scattering (that assigns geographically close entities to different pro-cessors).
In the seventh chapter we present metrics and statistics to eval-uate direct and indirect interdependencies. We propose a taxonomy of Interdependencies Quantification Metrics (IQM) which uses in-formations we have obtained from our simulations to measure some performance indexes that allow to risk analyst and domain experts to evaluate the goodness of mechanism and/or strategies designed in order to increase critical infrastructure protection and resilience.
In the last chapter we present conclusions and challenges for future works.
Models for critical
interdependent infrastructure
analysis
Contents
2.1 Analytic Models . . . 15
2.1.1 Qualitative and semi-qualitive models . . . . 16
2.1.2 Input-output models . . . 16
2.1.3 Indicative system dynamics models . . . 17
2.1.4 Hybrid System Modeling. . . 18
2.1.5 Hierarchical Holographic Modeling . . . 19
2.1.6 Topological and complex network models . . 20
2.2 Simulation Models . . . 21
2.2.1 Agent Based model. . . 21
2.2.2 Multi-domain or federated simulation model . 22
2.2.3 Petri nets model . . . 23
2.3 Critical Infrastructures Projects . . . 24
2.3.1 Projects survey . . . 25
2.3.2 The Service-Focused approach IRRIS. . . 30
2.3.4 The Supply and Demand System approach I2Sim . . . 33
2.3.5 Evaluation of IRRIS, DIESIS and I2Sim projects 35
If we take into consideration the definition of DoD Modeling and Simulation Glossary, a model is defined as "A physical, mathematical, or otherwise logical representation of a system, entity, phenomenon, or process". An implementation of a model is called a simulation.
In this chapter we want to provide a review of related works on modeling and simulation of critical infrastructures and, in particular, of interdependencies models and tools . The study of critical infras-tructures interdependency can be described by a general framework as illustrated in figure 2.3. When we want to model interdependen-cies and successively to simulate and analyze simulation-results, we need significant amount of data, a geographical representation and correlation between geographical position and infrastructures com-ponents, some visualization components ( or GUI tools) that allow users to interact with our models and, finally, we need some utility to apply some experimental scenario.
Infrastructure Models The modeling of a single infrastructure like electricity or telecoms networks are mature field. One of the biggest issue is to find a way to get correct information from expert domains to gain an understanding of infrastructure interdependencies and risks.
Interdependency Modeling The modeling of interdependencies can be done at different level of abstraction (from high level ab-straction to detailed models) as well as at different perceived model (physical, logical, cybernetic and so on). For each abstraction layer can be used a wide range of models based on several theories that
Figure 2.1: Critical Infrastructures modeling
can be range from qualitative models, stochastic activity networks to high fidelity simulation. At the same time every approach can be deployed at a several level of details, varying from detailed topology to service topology and cascading effects.
Simulators We have seen above that a simulation is actually an execution of a model over a period of time. It could be interactive or not. In the first case the simulation time has to coincide with the real time. In case the simulator takes and returns identical data to real data we can speak more of emulation. Generally simulators can be classified in base of what is simulated and what is virtual:
• Live simulation (where real people use simulated equipment in the real world)
• Virtual simulation (where real people use simulated equipment in a simulated world, or virtual environment) and
• Constructive simulation (where simulated people use simulated equipment in a simulated environment).
Since a simulator is a software, when we build a simulator we have to consider what kind of software paradigm we have to use. If we need rapidly a simulator that does not need high performance capability, we could implement it serially. In case we need high performance (consider simulation of millions of atoms) we should implement it using parallel programming. In such case, time synchronization of simulated events is crucial to avoid the loose of realism. Finally, in case we want to use multiple heterogenous simulators, we have to use distributed simulation. In such case, aside from considering events synchronization, we need to use a standard language and rep-resentation of data to publish and subscribe for sharing data among federates.
Data This refers to the data is collected from stakeholders and is used for the simulation of our models. Data can be static (i.e. geo-graphical position) or dynamic (i.e. direction of wind during a day). Data verification is an important challenge since incorrect data could successively mislead the analysis. Apart from validating the data, when we have a big amount of data, good data mining approaches are necessary to get only the necessary informations.
Visualization, GUI tools GUI tools are necessary both during the modeling and data analysis. An example of visualization is the Geographical Information Systems (GIS) to represent both point, lines and more complex figures on a map. Information are often layered, specially when we have to work with so many abstraction layers (i.e. physical and logical layer) as well as with so different domains (i.e. electrical and telecommunication network).
Scenario After that we have chosen the model to use, we have implemented it with a simulator and we have been able to collect all data that we need, we have to allow stakeholders/users to apply some specific scenario that they want to simulate. For example, if we have build a simulator to simulate infrastructures inside our city, we could allow users to experiment some failure in a particular neighborhood to evaluate and analyze the effect of such scenario in the surrounding zones or in all the area under study.
2.1
Analytic Models
With the increasing interest from the research communities of the critical infrastructures , there has been an increment of proposed models for infrastructures. Currently there is not a shared and precise classification of all proposed analytic models and, may be worst, there is not a comparison of such models that allows us to classify which model is the best choice for a particular case study or which model we should use to simulate a certain type of scenario. So the choice of the best model remains an open question [19]. Due to the complexity of critical infrastructure model, every model is based on different simplifications of the mathematical model or the input parameters set. Such choices influence both the level of details that are simulated and scenarios that can be simulated. Moreover the model during the implementation could have further simplification to avoid some performance as well as numerical issues and such information should be included in a compendium [63].
Starting from the work [21] we give an overview of common in-frastructure models that differentiate each others for the abstraction level and model boundaries, for the underlying theories and for the model applicability. Finally we will present some of the most success-ful project that we can find in literature presenting their maturity and
validation level.
2.1.1
Qualitative and semi-qualitive models
The qualitative and semi-qualitative models is based on continuos time stochastic processes as well as on Stochastic-Activity-Network (SAN) theory. Activity networks are used in cognitive science and cognitive engineering to show the time dependencies and flow of con-trol when multiple parallel resources are required [65]. Moreover they are used to simulate and study common mode failures (CMF). CMF occurs when events are not statistically independent. A classic exam-ple of CMF is the calculation of probability that if a hard-disk inside, for example, a RAID-1 fails then also the second will fail. Obviously if we consider the two events as independent, the probability of two failure at the same time will be the multiplication of two probabil-ities. But such probability would increase if, for example, the two HDs were built by the same company, during the same period of production (serial numbers are almost the same) and so on[41].
In the case of critical infrastructure SAN are used to estimate the availability and reliability of network components when there is a failure in a certain component. Qualitative models can provide useful support to identify and analyze dependency at high level and to provide stochastic measures of the durations of events as well as the likelihood of the occurrence. Qualitative models can be imple-mented by means of already impleimple-mented tools like MODAF, ASCE or Mobius tools.
2.1.2
Input-output models
Input-output models (IOM), also know as Leontief’s model, has been widely used in economy to predict the effect of changes in one indus-try on others and by consumers, government, and foreign suppliers on
the economy. With IOM a system-wide solution can be determined for the cascading effects caused by a single perturbation. If for ex-ample the operability of one producer decreases by a certain amount, this model can calculate how the operability of all interconnected producers is affected (including an amplification of the inoperability of the originally affected producer)[72]. In [49] the output is the in-operability that can be triggered by one or multiple failures due to their inherent complexity or to external perturbations (e.g., natural hazards, accidents, or acts of terrorism). In this approach the time is divided in several frames and in each frame is calculated a conceptual situation of equilibrium after an attack or other catastrophic events that affect the infrastructures. With such approach a qualitative analysis of short long term effect can be conducted.
In [49] the IOM model is applied to examine and predict the effects of changes in one infrastructure system on other ones. The limit of IOM is not able to describe the details of complex system evolution and to predict all basic behaviors of interdependent infrastructures [54]. To overcome such limit, generic cascading model [81] has been proposed which is a continuos model that considers also the recovery capacity of system components and time-delayed interaction among the nodes. In [69] the model was used to asses also the efficiency of different recovery strategies.
GCM seems to be more appropriate for studying spreading be-havior in large networks.
2.1.3
Indicative system dynamics models
System dynamics model was created by Professor Jay Forrester dur-ing 1950s at the MIT. It is a top-down approach and is generally used to study the behavior of a complex system over time. It uses feed-back loops and time delays to study the whole complex system. All dynamics in a system are assumed to arise from the interaction of two
Figure 2.2: The Leontief and general cascading models [22]
types of feedback loops, positive and negative ones[86]. These loops are represented in loop diagrams. A diagram includes stocks (the accumulation of resources in a system), flows (the rates of change that alter those resources) and information (about the value influ-ences based on changes in the regarded stocks). Changes in stocks and flows are described with differential equations, so it can also be simulated.
System dynamic has been widely used in a wide range of areas, for example population, economic and ecological systems. In the case of critical infrastructures it can be used to explore the dynamic behavior of the complex system and the cascade propagations of failures. It does not need a big amount of data and in [81] has been used to study network vulnerabilities to failures.
2.1.4
Hybrid System Modeling
Hybrid system is a dynamic system that exhibits both continuos and discrete behavior. So the system can be described by differential equations as well as difference equations or a discrete events machine. Hybrid systems have been intensively studied in the past few years both for their rigorous mathematical foundations and for engineering
designs [55]. That means a continuously changing variable describing the change of systems behavior over time can trigger a state machine transition, which means an occurrence of a discrete event [38]. On the other hand a state can change as a result of some discrete events which are directly linked to the continuous system behavior [29].
Figure 2.3: Example of Hybrid System Model [29]
Hybrid System Modeling applies mainly to the huge group of continuous systems controlled by discrete events, such as systems coordinating processes (e.g. air and ground transportation), infras-tructures, robots, etc.
2.1.5
Hierarchical Holographic Modeling
The term hierarchical refers to an understanding of risks due to dif-ferent levels in a hierarchy (i.e. risks at "system-of-systems" level, individual system level, sub-system level and component level). The term holographic modeling refers to a multi-view image of a system with regard to identifying vulnerabilities. Central to the mathemat-ical and systems basis of hierarchmathemat-ical holographic modeling (HHM)
is the overlapping among various holographic models with respect to the objective functions, constraints, decision variables, and input-output relationships of the basic system. Through HHM [43] multiple models can be developed and coordinated to capture the essence of many dimensions, visions, and perspectives of infrastructure systems. One example is the study conducted for the President’s Commission on Critical Infrastructure Protection on the U.S. water supply sys-tem. In applying the HHM philosophy the risk to a water supply in-frastructure is decomposed into 16 major categories. The categories represent the risks to a water supply system from the multifaceted dimensions of each major category including the likelihoods, root causes, consequences, and direct and indirect impacts.
The HHM approach to reduce infrastructure vulnerability ad-dresses its holistic nature in terms of its hierarchical institutional, organizational, managerial, and functional decision making structure in conjunction with factors that shape that hierarchical structure. These include the hydrologic, technologic, and legal aspects as well as time horizons, user demands on the infrastructure, and socioeco-nomic conditions. Unfortunately no real-time simulation is possible. HMM has been applied to study risks for agencies in the U.S. such as - besides the PCCIP - the FBI, the NASA, the Virginia Department of Transportation (VDOT), and the National Ground Intelligence Center [44].
2.1.6
Topological and complex network models
The topological analysis of properties of a network can reveal im-portant and interesting information about the system structure [17], evolutionary dynamics, topological vulnerabilities[84], and the level of functionality demanded of its own components (for instance, topo-logical centrality measures allow us to determine which network ele-ments are likely undergo intense usage because of heir "location" in
the network).
Anyhow has been demonstrated that simple topological descrip-tion cannot capture all of system’s properties when there is some dynamic process acting on the network. Therefore at the topological network has been included basic features of the dynamical process. In [56] topological and dynamic models have been used to simulate the failure rates of electric power systems or in [81] to study the flow of failures in a complex network and the produced delay.
2.2
Simulation Models
Simulation, or more specifically, computer simulation is often used as an adjunct to, or substitution for, modeling systems for which simple closed form analytic solutions are not possible. There are many different types of computer simulation, but all of them have the common goal to generate a sample of representative scenarios for a model in which a complete enumeration of all possible states would be prohibitive or impossible.
Several software packages exist for running computer-based sim-ulation modeling (e.g. Monte Carlo simsim-ulation, stochastic modeling, multi-method modeling) that makes the modeling almost effortless.
We present two modern technique of simulation that are generally used in the study of complex systems as well as system-of-systems: the Agent Based Modeling & Simulation and the federated approach.
2.2.1
Agent Based model
Agent-based models (ABM) consist of dynamically interacting, rule– based agents. An agent-based model can exhibit complex behavior patterns and provide valuable information about the dynamics of the real-world system simulated. An agent is a software object im-plemented on a computer network. Agents have access to certain
information and they are able to "communicate" with each other. Additionally, agents’ design can include an ability to learn about the environment and formulate unique sets of decision rules[29]. Agent based models are often used to observe aggregate activity for a pop-ulation of agents. ABM can also be seen as a modeling framework rather than a methodology, because it is based on further underlying techniques like Monte-Carlo, FTA, etc. The major advantage of the ABM approach for modeling and simulation critical infrastructure interdependencies is the possibility to emulate an emergent behavior. The overall system behavior results from the interactions of the mul-tiple single agents and is not specified on the system level. Detailed data is only needed on the agents’ level (bottom-up principle), not on the system level. Detailed data is only needed on the agents’ level (bottom-up principle), not on the system level. More details about ABM will be given in the next chapter when we present our model partially based on such methodology. Anyhow many projects that use ABM can be found in literature.
2.2.2
Multi-domain or federated simulation model
Every specific sector simulator is appropriate to model a particu-lar domain by means for example a specific mathematical model like Input-output model. Anyhow, to model critical infrastructure we need to be able to simulate different domains at the same time without loosing important information during the exchange of data among heterogenous simulators. The use of heterogenous simulators is pretty common in the military field to model, for example, air and terrain forces at the same time. Moreover, in such filed there is inter-est in real-time simulation to train soldiers as well as commanders in deploying troops. The current standard for distributed simulation is the High-Level Architecture v.1.3 and its successor IEEE.1516 which provides rules for federated simulation. The communication among
federates is managed by a kind of broker called Runtime Infrastruc-ture (RTI). The RTI, aside managing data and communication, has to manage the synchronization since every federate can have a dif-ferent representation of the real time. Today there are many tools that implement such an architecture and help to manage and build our own federation, that is where all federates reside. High Level Architecture has many advantages especially for the modeling and simulation of dynamic behavior of "system of systems". It is useful for quantitative simulation even though is very time and resource consuming.
2.2.3
Petri nets model
Stochastic Petri Nets (in short SPN) are a time enhanced variant of place-and-transition nets which are mathematical models of non-deterministic and discrete distributed systems. A Petri Net model is a bipartite directed graph. It consists of places and transitions. Places may contain any number of tokens. When a transition switches ("fires"), it consumes the tokens from its input places, performs some processing task, and places a specified number of tokens into each of its output places.
Generalized Stochastic Petri Nets (GSPNs) are an extension of SPNs which allow timeless as well as timed (exponential) transitions. Petri nets are a well known technique to implicitly define large au-tomatons needed to model distributed systems. Petri nets have an advantage in that the size of the net, i.e. the number of places and transitions, grows but in linearity with the number of components.
SPN can be applied to model common mode failures and cascad-ing effects in complex systems, e.g. [50], as well as to analyze the impact of communication on power grids [78]. GSPNs are also suit-able for formalizing and simulating dynamic aspects describing the semantics and activities of e.g. workflow systems and distributed and
Table 2.1: Legend for Petri Net Model in[42] Transtions Places
1. Electric Power is Dis-rupted
1. Electric Power ON 2. Lubricants in Reserves
are Consumed
2. Electric Power OFF 3. Power Disruption Affects
Natural Gas Pro-duction
Natural Gas Production Stops
4. Natural Gas in Reserves is consumed
4. Consumed Natural Gas 5. Power Disruption affects
Oil Lubricants Production
5. Oil Lubricant Produc-tions Stop
... ...
concurrent computing systems.
2.3
Critical Infrastructures Projects
Currently in literature we can find many projects-tool to support the modeling of critical infrastructure. Most of them are supported by government agencies as well as private companies and are mostly implemented in universities, centre of research or as the collaboration of both. In particular in US there are three department involved in critical infrastructure:
• Department of Homeland Security (DHS): for the protection of citizens from terroristic attacks and natural disasters
• Department of Defense (DOD): for the coordination and su-pervising of all agencies of the government related directly to
military forces and the national security
• Department of Energy (DOE): responsible for the energy and the nuclear safety. It is also responsible for the nuclear weapons and the nuclear waste disposal.
Some centre of research like the Aragone National Laboratories (ANL), Idaho National Laboratories (INL) and the Los Alamos Na-tional Laboratories (LANL) are heavily involved in such projects. In Europe there is not yet a well centralized department for the pro-tection of critical infrastructure and generally every nation has its own departments. Recently, the Information Society of the Euro-pean Commission has provided several documents and is supporting the Joint Research Centre (JRC) both to develop models for support-ing critical infrastructure protection and to manage multiple different centre of research and universities spread around Europe.
2.3.1
Projects survey
The modeling of critical infrastructure is a very challenging task since it is composed of multiple interconnected infrastructures that ex-change service as well as products each other. Considering the sur-vey presented in [67] we want to show the approaches adopted besides the status and goals of the project-tools. In [67] were considered six categories to characterize every tool which are:
Infrastructures: in the survey were considered 12 different sectors: 1. Agriculture and food
2. Banking and finance 3. Defense industrial base 4. Emergency services 5. Energy
6. Government
7. Industry/manufacturing
8. Information and telecommunication 9. Postal and shipping
10. Public health and safety 11. Transportation
12. Water
Modeling and simulation technique that we have seen above
Integrated vs. coupled models: use of a single framework that inte-grates everything in one simulator or the coupling of multiple sector simulators
Hardware/software requirements: the portability and exportability of programs and data.
Maturity level: the survey defines 4 maturity level: 1. Research: the model is only conceptual 2. Development: the model is in developing
3. Mature Analytic: the code is stable and has reached a good level, and some experiments are executed to conduct some analysis.
4. Mature Commercial: the tool is a commercially licensed product.
In particular in the survey were presented 33 tools that are re-ported in figure2.4 and 2.5. Most efforts have been made in the sec-tors electricity, information and telecommunication technology, and transportation, but further infrastructure sectors are also considered
(12 sectors in total). Some of the approaches consider more than one infrastructure sector but this does not mean that they can provide combined modeling and simulation. A more detailed description of every project can be found in [67].
Using the same methodologies, we want to considers other three important projects that have reached a mature analytic level. Such projects are the IRRIS, DIESIS and I2Sim project. The first two are European projects while the last one has been implemented in the British Columbia University in Canada.
Figure 2.4: Tools survey for modeling of critical infrastructure (de-velopers and areas) [38]
Figure 2.5: Tools survey for modeling of critical infrastructure (chrac-teristics) [38]
2.3.2
The Service-Focused approach IRRIS
The IRRISS project is from the collaboration of 15 european partners from area of research and private companies in which the Fraunhofer Institute was the project coordinator. It has the goal to determine interdependencies among infrastructures using an agent based simula-tor and to develop the Middleware Improved Technology (MIT) a col-lection of software components to facilitate IT-based communication among infrastructures as well as different infrastructure providers. The scenario simulated is based on a real scenario called "Rome Mini Telco Blackout" which refers to the flooding event of a Telecom Italia major telecommunication service node occurred in Rome on 2nd
Jan-uary 2004.
The simulator is named SimCIP and it is baed on the Implemen-tation, Services and Effect (ISE) model (see figure 2.6). The ISE model split the full model in three separated levels:
1. implementation layer: encapsulates the domain specific data, logic and behavior model of the components
2. service layer: exchange of data between different model compo-nents (inter or intra-domain)
3. effect layer: effects of the data-processing
SimCIP is an agent-based model simulator that can simulate sev-eral variety of infrastructure in an integrated environment. The be-havior of an infrastructure can be done in an external specific sim-ulator of the particular domain. SimCIP has the task of defining the dependencies between the components, setting the initial values and collecting and evaluating the results of the simulation done by the external simulators. The agent encapsulates the state of network components and some of them are are transformed into variables that are abstract enough to be exchanged on the service layer of the ISE
Figure 2.6: The Implementation-Service-Effect CI metamodel [18] model. The current implementation of SimCIP simulates interdepen-dencies between power grid and telecommunication network and uses as external simulator the PPS-Sincal and ns-2 respectively to the two infrastructures.
2.3.3
The Federative approach DIESIS
The DIESIS is a project supported by the European Community started on 1st February 2008 and of two-years duration. The project has the goal of performing a design study for an e-Infrastructure en-abling federated simulations of CI systems and supporting research on CIP. In particular the European e-Infrastructure [6] has the goal to allow researchers to access to unique and distributed facilities (in-cluding data, instruments, computing and communication resources). This European e-Infrastructure will support full cooperation of the different partners in charge for studying (inter)dependencies of criti-cal infrastructures, while preserving the confidentiality of the propri-etary knowledge embedded into the different models and simulation
packages.
Figure 2.7: DIESIS architecture [77]
As illustrated in figure 2.7 a middleware is developed for the in-teroperability among different federates similar to the HLA architec-ture. The middleware will support also the scenario configuration and management as well as the setup of the simulation by means of a workflow. Moreover an ontology has been included in DIESIS [58] which will allow the representation of the knowledge about the het-erogenous infrastructures domains, the description of infrastructures networks and the interconnections among these networks. Moreover, the ontological framework allows the definition, through logic rules, of the interconnections semantic. The DIESIS-ontology has been ap-plied to describe three different infrastructures: railway, electric and telecommunication. To prove the ontology, the Rome flooding sce-nario from the previous IRRISS project have been used.
2.3.4
The Supply and Demand System approach
I2Sim
The I2Sim simulation environment was developed at the University of British Columbia the JIIRP project. The system-modeling is based on the modeling of flow resources between component infrastructures without revealing their internal details. Every component uses an internal model to evaluate its status, while the I2Sim combines these operating states into a system-of-systems solution. A main objec-tive of the simulator is to capture the time line events during a large emergent scenario so that is possible to predict the evolution of the global system when a certain decision is taken. Aside the real time decision support, I2Sim has the goal to permit the analysis and dis-covery of vulnerable points in the system as well as gaps in policies and procedures. Similarly to Petri’s nets, I2Sim defines the following entities (see also figure 2.8):
• Cells (Production Units): it is an entity that produces some-thing and requires some inputs (e.g. primary cabin, routers, hospitals)
• Channels (Transportation Units): entities products are trans-ferred to others by some transportation channels (e.g. wires, pipes, roads)
• Tokens (Exchange Units): represents the quantities needed in input or produced in output (e.g. a doctor, water, a phone call) • Controls (Distributor & Aggregator Units): interface the
Figure 2.8: I2Sim ontology: cells, channels, tokens and controls [57]
2.3.4.1 Cell and channel model
A cell is a functional unit (see figure 2.9(a)) that needs a certain quantity of a product as input to produce its own relative output. Generally the relation between inputs and outputs is a function mul-tidimensional and not linear. While the internal details are hidden to the simulator, I2Sim needs a Human Readable Table (HRT) which has to be provided by the owner of the infrastructure. HRTs can be represented as multidimensional hyper-surface which can be lin-earized to represent current state of a cell along time line evolving. Cells are connected each other with specific channels (figure2.9(b)). Channels represent the means by which tokens are transported from a source cell to destination ones. Channels can have a coefficient of loss to simulate for example leakages or delays.
(a) Cell (b) Channel
Figure 2.9: I2Sim: cell and channel model [57]
2.3.5
Evaluation of IRRIS, DIESIS and I2Sim
projects
Using the same methodology in [29] and tables presented previously
2.42.5 we evaluate previous presented projects. The IRRIS had the goal of collecting some new ideas from different partners and exper-imenting some new modeling technique. From such experience, the DIESIS project has been conducted so that it has avoided some of issues that IRRIS project has affronted. So DIESIS can be seen as an evolution of the IRRIS project and, at the same time, as the base for future European projects. Vice versa, I2Sim had the goal to provide a tool for real users, so that it results to be more usable compared to the IRRIS project. Moreover it embraces much more domains and can be more easily extended to other infrastructures.
(a) Developers and areas
(b) Chracteristics
Figure 2.10: Tools survey for modeling of critical infrastructure for IRRIS, DIESIS and I2Sim
Federated Agent Based Model
Contents
3.1 Agent-based modeling of interdependent
complex systems . . . 39
3.1.1 The Federated agent-based model. . . 40
3.1.2 Interconnecting Agents: The Interdependen-cies Model . . . 43
3.1.3 The Federated ABMS methodology . . . 44
3.2 The case study . . . 45
3.3 Implementation Issues . . . 48
3.3.1 Implementation of agents . . . 48
3.3.2 Federation of the agent-based model(s) and sector specific models . . . 49
3.3.3 Interaction between the agent model and the sector specific model . . . 50
3.3.4 Orchestration of the Federated agent-based simulation model . . . 51
3.4 Concluding Remarks . . . 51
The modeling of critical infrastructure falls within the study and modeling of complex systems. The theory of complex systems is rel-atively recent and derives from Cybernetics and System Research
which started in the 1940’s with people like Norbert Wiener, Warren McCulloch, Margaret Mead, Ross Ashby, Jhon Von Neuman, Heinz von Foerster, and others [46]. A system is generally defined as a col-lection of elements which interacts each other and make up a whole [24]. To describe the dynamic evolution of a system, scientists use simplified mathematical models which represent a whole system [76]. While a system can be considered complicated, it could not be com-plex. Actually there is not a shared definition of complex in literature. In [85] it is defined as:
A system comprised of a (usually large) number of (usu-ally strongly) interacting entities, processes, or agents, the understanding of which requires the development, or the use of, new scientific tools, nonlinear models, out-of equilibrium descriptions and computer simulations. Herbert Simon [80] defines a complex system as
A system that can be analyzed into many components having relatively many relations among them, so that the behavior of each component depends on the behavior of others.
While, according to Jerome Singer, [82] it is
A system that involves numerous interacting agents whose aggregate behaviors are to be understood. Such aggregate activity is nonlinear, hence it cannot simply be derived from summation of individual components behavior.
Anyhow we can generally define a complex adaptive system (CAS) as any system in which there a large numbers of interacting entities, we cannot model the whole system linearly as the simple sum of agents’ activities and, lastly, entities can use some sort of hierarchical-organization to reach a shared goal or more simply to survive.
One of the most used technique to model CAS is surely the Agent Based Modeling and Simulation (ABM&S). It is based on proven, highly successful techniques such as discrete-event simulation and object-oriented programming to discover strategic, tactical and op-erational business solutions [64]. The ABM&S allows to model CAS using a bottom-up approach, in which are modeled the behavior and interactions between single entities and at the same time it provides a view model of the whole.
3.1
Agent-based modeling of
interdepen-dent complex systems
As shown in many research works, agents can be used to model inter-dependent complex systems (e.g. [64]). A general definition of agent is the following [27]:
Definition 1 An agent is an entity with a location, capabilities and memory. The entity location define where it is in a physical space ... What the entity can perform is defined by its capabilities ... the experience history (for example, overuse or aging) and data defining the entity state represent agent’s memory.
A critical infrastructure is characterized by its location, its behav-ior, interaction capabilities and its internal state. Then a critical in-frastructure can be modeled as an autonomous agent and the system composed of interdependent critical infrastructures can be modeled as interacting agents which cooperate and/or compete to realize a common or an individual goals. In this chapter we present our model based on ABM&S and distributed simulation technique. Successively we adopt such model to simulate interactions between the electrical system and the communication network.
![Table 2.1: Legend for Petri Net Model in[42]](https://thumb-eu.123doks.com/thumbv2/123dokorg/8029172.122289/46.748.168.634.242.515/table-legend-for-petri-net-model-in.webp)
![Figure 2.4: Tools survey for modeling of critical infrastructure (de- (de-velopers and areas) [38]](https://thumb-eu.123doks.com/thumbv2/123dokorg/8029172.122289/50.748.199.588.182.850/figure-tools-survey-modeling-critical-infrastructure-velopers-areas.webp)
![Figure 2.6: The Implementation-Service-Effect CI metamodel [18]](https://thumb-eu.123doks.com/thumbv2/123dokorg/8029172.122289/53.748.137.561.183.440/figure-the-implementation-service-effect-ci-metamodel.webp)
![Figure 2.7: DIESIS architecture [77]](https://thumb-eu.123doks.com/thumbv2/123dokorg/8029172.122289/54.748.184.607.239.581/figure-diesis-architecture.webp)


![Figure 4.3: HLA architecture of a federation and of a federate The HLA defines two objects models for the description of the shared elements inside the federation and to describe the federate itself[35]:](https://thumb-eu.123doks.com/thumbv2/123dokorg/8029172.122289/81.748.134.565.182.464/figure-architecture-federation-federate-description-elements-federation-federate.webp)