Chiara Foglietta
S Y S T E M M E T H O D O L O G I E S F O R S I T U AT I O N AWA R E N E S S A N D R I S K M A N A G E M E N T F O R C R I T I C A L I N F R A S T R U C T U R E P R O T E C T I O N
Doctoral Thesis in
Computer Science and Automation Dept. of Engineering
University of "Roma TRE" Doctoral Thesis in
Computer Science and Automation Dept. of Engineering
XXV Cycle
S Y S T E M M E T H O D O L O G I E S F O R S I T U AT I O N AWA R E N E S S A N D R I S K M A N A G E M E N T F O R C R I T I C A L I N F R A S T R U C T U R E
P R O T E C T I O N
Ph. D. Student: Chiara Foglietta Signature: ________________________________
Advisor: Stefano Panzieri Signature: ________________________________
Course Coordinator: Stefano Panzieri Signature: ________________________________ February 2013
Critical Infrastructure Protection
A Thesis presented by Chiara Foglietta
in partial fulfilment of the requirements for the degree of Doctor of Philosophy
in Computer Science and Automation Dept. of Engineering
University of "Roma TRE"
I known the price of success: dedication, hard work,
and an unremitting devotion to the things you want to see happen. — Frank Lloyd Wright
A B S T R A C T
The Mixed Holistic Reductionist Approach is a methodology that merges the holistic and the reductionist techniques trying to conserve the pros. The aim is the modelling of critical infrastructure interde-pendencies and the assessment of impact due to physical failures and to cyber threats. This approach can be applied both in distributed and in centralised contexts. The distributed framework is mandatory if the communication among control centres is peer-to-peer.
In order to manage also cyber threats, Situation Awareness models and techniques help in order to classify faults and failures. In fact, Data Fusion methodologies, as Evidence Theory, can detect the most probable cause of faults happened in facilities and, therefore, we uses the other information, coming from Evidence Theory results, as an-other input for the MHR approach.
The state estimation is one of the key functions of SCADA systems for grids. In order to identify the state of the system, state estimation helps in accurate and efficient monitoring of operational constraints. The ability to provide a reliable state can also help in contingency analyses and in the required corrective actions. The smart grid context is quite different respect to traditional distribution grid, starting from different topology features, so a new approach to state estimation is mandatory.
A C K N O W L E D G M E N T S
It would not have been possible to write this doctoral thesis without the help, support and patience of the kind person around me, to only some of whom it is possible to give particular mention here.
This thesis would not have been possible without the presence, help, support and patience of my supervisor, Prof. Stefano Panzieri. He is able to help me and understand my “bad” moments. I also thank Prof. Stephen D. Wolthusen for inviting me in his working group, for supporting me during the stay in Egham at the Royal Hol-loway University of London.
I would like to thank Vincenza “Cinzia” Abate for her kindness, friendship and support, together with the other Ph.D students of the XXV cycle, especially Attilio Priolo, without him the first two years has been a dark hole. The older Ph.D students, as Gabriele Oliva and Sandro Meloni, have been a guide to understand the mechanisms and the tricks in the research and university world. The younger Ph.D stu-dents, as Simone Palmieri, Antonio Di Pietro and Jagadeesh Gunda, have the same enthusiastic energy to stimulate me towards new goals and objectives.
A special thank goes to Riccardo Santini, “my” best master thesis student. In the last more than three years, I see a lot of students doing their best to obtain their degree, but seeing someone so enthusiastic and hard-headed is always a pleasure to work with. With him and Giovanni Corbò, the M·CIP lab is completed.
I would like to thank all the Egham boys and girls, i.e., Alessio Baiocco, Yangue “Yaya” Feng and Cristina Alcaraz. Those moments spent with them are a gift for me.
I am also grateful to all the secretaries of the Computer Science and Automation Department, for their help and support, for their patience in my messes and noises, and for their constant understanding.
Thanks to Alessandro Longhi, my neighbour in the Robotic Labo-ratory. He is the supporter of my messes, my songs, and my noises. The cappuccino moments are the best instants in the day. I’m very sorry for all the troubles that I always create to you.
Last, but not least, my family: Adele, Ilaria and Diana, my per-sonal big-dog. The last three years were often not happy, but all the moments we lived together tied and enriched us.
For any errors or inadequacies that may remain in this work, of course, the responsibility is entirely my own.
C O N T E N T S
i n t r o d u c t i o n 1
1 m o d e l l i n g i n t e r d e p e n d e n c i e s i n d i s t r i b u t e d c o n -t e x -t 5
1.1 State of the Art 6
1.2 Mixed Holistic Reductionist Approach 9
1.3 Critical Infrastructure Simulation by Interdependent Agent (CISIA) 13
1.4 Example of Interdependent Critical Infrastructures 17 1.5 Online Prediction Tool 21
1.6 Conclusions 25
2 i m pa c t a s s e s s m e n t o f c y b e r t h r e at s 27 2.1 Cyber Threats 28
2.2 Reference architecture 30
2.3 Risk Prediction Tool architecture 31
2.4 MHR for Cyber Attack Impact Evaluation 33 2.5 Example of Cyber Attack Impact Assessment 34 2.6 Conclusion 40
3 s i t uat i o n awa r e n e s s: models and methodologies 41 3.1 Situation Awareness 41
3.2 Situation Awareness Models 42 3.3 Methodologies 44 3.4 Case Study 46 3.5 Conclusions 50 4 n e t w o r k e d e v i d e n c e t h e o r y 51 4.1 Introduction 51 4.2 Evidence Theory 53
4.3 Data Fusion Problem in Networked Context 55 4.4 Data Fusion Algorithm in Networked Context 57 4.5 Application Scenario 59
4.6 Conclusions 61
5 a n a g i l e m o d e l f o r s i t uat i o n a s s e s s m e n t 63 5.1 Knowledge Representation for Situation Awareness 64 5.2 Evidence Theory Applied to Situation Awareness
Do-main 66
5.2.1 Knowledge Representation 67
5.3 Notes on Evidence Theory and Inference Algorithm 69 5.3.1 Unability to discriminate situations 69
5.3.2 Mass re-allocation 69
5.3.3 Closed world vs Open world assumption 70 5.4 Towards an Online Augmented Impact Assessment 71 5.5 Application in Critical Infrastructure Domain 73
5.5.1 First Example: the Right Behaviour of the Model 74
5.5.2 Second Example: the Wrong Behaviour of the Model 75
5.5.3 Third example: the Wrong Knowledge Model 77 5.6 Conclusions 82
6 h i e r a r c h i c a l s tat e e s t i m at i o n f o r s m a r t g r i d s 83 6.1 Introduction 83
6.2 State Estimation 84
6.3 Multi-area Hierarchical State Estimator 88
6.3.1 K-level Hierarchical State Estimator Formulation 89 6.3.2 Two-Level Multi-Area Hierarchical State
Estima-tor Formulation 91
6.3.3 A Two-Level Instance of the Multi-Area Hierar-chical State Estimator 94
6.3.4 Performance Metrics and Results 98 6.4 State Estimator Robustness 99
6.4.1 Conditioning and Stability of State Estimator Op-eration 100
6.4.2 Error Covariance Matrix Manipulation Attack 101 6.4.3 State Estimator Parameter Criteria 101
6.5 Conclusions 102
7 c o n c l u s i o n s a n d f u t u r e w o r k s 103 b i b l i o g r a p h y 105
L I S T O F F I G U R E S
Figure 1 Reductionist entity representation 10 Figure 2 Service entity representation 10 Figure 3 Holistic entity representation 11
Figure 4 A graphical representation of an application for MHR approach 12
Figure 5 Input-output CISIA entity behavior 14
Figure 6 Representation of generic CISIA entity ports 15 Figure 7 The structure of CISIA simulator 15
Figure 8 The considered MV power grid 17
Figure 9 The SCADA network, for the case study 19 Figure 10 The telecommunication network, used in the
case study 20
Figure 11 The online prediction tool configuration 21 Figure 12 The operator panels 23
Figure 13 Example of isolated prevision 24
Figure 14 Example of composition of isolated previsions 24 Figure 15 Reference architecture 31
Figure 16 Integrated Risk Prediction Tool 32
Figure 17 Integrated Risk Predictor database structure 33 Figure 18 Interdependecies among critical infrastructures
considered in the case study 35
Figure 19 The case study modelling within MHR approach 38 Figure 20 Operative level of a RTU agent 39
Figure 21 Operative level of reconfiguration service in the power grid infrastructure. 39
Figure 22 Operative level of a power grid customer. 40 Figure 23 Example of maritime surveillance scenario 46 Figure 24 Example of dynamic Bayesian network for
mar-itime surveillance 47
Figure 25 Example of ANN for maritime surveillance. 48 Figure 26 Examples of MM and HMM for maritime
surveil-lance 49
Figure 27 Examples of assessment of the direction of a ship based on Evidence Theory 50
Figure 28 Evidence Theory knowledge model 68 Figure 29 Evidence Theory model example 68 Figure 30 The proposed approach for integrating impact
assessment via situation awareness 72 Figure 31 Case Study 73
Figure 32 Case Study Model 74
of discernment of five hypotheses
Figure 34 Transmission Line Equivalent Circuit: Medium/Long-Length Line 94
Figure 35 Transmission Line Equivalent Circuit: Short Length Line 95
Figure 36 IEEE 118 Bus Test Network: Sub-Division Ar-eas Schema 99
L I S T O F TA B L E S
Table 1 BBA assignments for the cause classification problem in a telecommunication network 56 Table 2 BBA assignments for each of five agents. 60 Table 3 Output of centralized TBM with incremental
aggregations. 61
Table 4 Temporal edge selection. 61 Table 5 Distributed TBM. 62
Table 6 Mass Assignment for the first example 75 Table 7 Mass Assignment for the second example 76 Table 8 Mass Assignment for the second example,
us-ing the re-distribution approach startus-ing from T5. Values for previous time steps are in Table 7 77
Table 9 Mass Assignment for the third example, using the re-distribution approach starting from T9. Values for previous time steps are in Tables 7 and8 79
Table 10 Mass Assignment for the third example, ap-plying at T13 the new knowledge model. Val-ues for previous time steps are in Tables7and 8 81
Table 11 Aggregate Estimation Accuracy Values 99
I N T R O D U C T I O N
Industrial control system (ICS) is a general term that encompasses several types of control systems, including Supervisory Control and Data Acquisition (SCADA) systems, Distributed Control Systems (DCS), and other control system configurations such as Programmable Logic Controllers (PLC) often found in the industrial sectors and Critical Infrastructures.
Industrial control systems and critical infrastructures’ control cen-ters are able to collect a large amount of data and to elaborate such an information in order to provide the operators with a synoptic view of the ongoing situation. The operator, on the base of such information, is able to understand the ongoing situation and undertake his deci-sions. Such a paradigm, although effective when infrastructures are relatively decoupled, is becoming less and less adequate derived from the increasing degree of dependency and interoperability among in-frastructures. Interdependency arises for many reasons and, in partic-ular, because of geographical, physical, cyber, or logic relations [77].
Helping operator in decisions is one of objective of critical infras-tructure research. The operator panels are an efficient way to display other important information, coming from other interconnected in-frastructures. The data exchange among control centre must be exe-cuted in a secure way, but also using partial information. In the Chap-ter 1, the information is combined at service layer and it is another kind of encryption.
Cyber interdependency, in particular, is becoming more and more pervasive, due to the increasingly use of internet-based technologies and public networks to operate Critical Infrastructures. However, while the Internet has been beneficial to both public and private organiza-tions, the increasing reliance on networked systems has augmented the risk of cyber attacks.
SCADA (Supervisory Control and Data Acquisition) systems, first introduced in the 80’s and 90’s, are still in use. These systems, includ-ing those installed until few years ago, did not consider properly the
security issues due to the usage of public networks. Such systems were conceived with a monolithic structure, isolated from the outside world and based on proprietary standards for the communication be-tween control center and field devices.
Over time, due to the rapid growth of the Internet and telecom-munications networks, SCADA systems have changed, slowly tend-ing to a distributed architecture, with standardized and well doc-umented communication protocols, such as TCP/IP and Modbus. These SCADA systems are usually connected to Corporate Network. In addition, such systems typically exchange data with no encryption or authentication algorithms.
However, in recent years, there is a growing urge to evaluate the performances of SCADA systems also from the point of view of se-curity. This need arises due the great relevance of these systems for the welfare of citizens and nations. In 2010, the discovery of Stuxnet [33] became a concrete proof that cyber attacks on industrial control
systems and SCADA systems are possible. Stuxnet was able to in-fect Windows computers used to supervise industrial control systems, and to recognize and infect such control systems. In 2010 and in 2011, the amount of SCADA vulnerability disclosures and exploits has ex-ploded. Terry McCorkle and Billy Rios found 100 SCADA bugs in 100 days, thanks to free software available on-line [79].
Impact evaluation of cyber attacks and their consequences are very difficult to perform. The complexity of the problem at hand is indeed non-trivial also due to interdependencies. In fact the domino and cas-cading effects are sometimes not easy to find, especially with due to the growing importance of telecommunications that may result in unwanted and unnoticed couplings.
For the above reasons, the impact assessment of faults should also encompass cyber attacks, which are becoming a realistic typology of attack for Critical Infrastructures. The introduction of firewalls, intru-sion detection systems (IDS) and degrees of separation between the Corporate Network and the control system network is a good step to-ward increasing security, but there is still much to be done. In Chapter 2the evaluation of cyber attack impact is included in MHR approach. Another step that may result in an increase of the resilience of facil-ities is the information exchange among governments and infrastruc-ture owners. The information can be shared using national and in-ternational agencies, such as CERTs (Computer Emergency Response Teams), or early warning and alerting networks, as EISAC (European Information Sharing and Alert System), American National Cyber-security and Communications Integration Center (NCCIC) or Aus-tralian Cyber Security Operations Centre (CSOC).
All the agencies listed above were created with the goal of coop-erating with infrastructure operators in the event of a cyber attacks. Each infrastructure, upon suspicion of being under attack, warns its
List of Tables 3
agency or CERT that has the duty to share information with other agencies and infrastructures that may be involved. In addition, they provide mitigation mechanisms and countermeasures.
Evaluating cyber attack impact is a very important feature, but the natural evolution is the attempt to merge cyber and physical infor-mation in order to augment the Situation Awareness. For this reason, the model and methodologies in the Data Fusion context have been analyses in Chapter3.
Evidence Theory is the focuses of Chapters 4 and 5 with its en-hancement. First of all, it has been applied the Evidence Theory frame-work in distributed conditions, with the application of netframe-worked Transferable Belief Model in the Critical Infrastructure domain. The other field is related to the knowledge model and the ability of Evi-dence Theory to change ideas thanks to evolving situations.
Among Critical Infrastructures, great importance is the energy sec-tor and especially the power generation, transmission and distribu-tion. The role of electric power systems has grown steadily in both scope and importance with time, and electricity is increasingly recog-nized as a key to societal and economic progress in many developing country.
Since the fast advancement of computer and communication tech-nologies in the late 1980s, there has been a trend to optimize and con-trol power system in a distributed or hierarchical manner. In the day to day operation and control of large-scale electric power systems, op-erators depend on a measured quantities, such as bus voltage magni-tudes, line flows, and bus loads and injections, in order to monitor the present status of the grid and to initiate control actions. Because the data acquisition process involves a number of complex procedures, the measurements contain errors. The goal of power system state es-timation is to provide reliable, accurate and complete set of data for real-time monitoring and control of power systems. In Chapter 6, hi-erarchical power state estimation is proposed and analysed in order to apply it in smart grids. Further analyses are currently under inves-tigation for data injection attacks in the hierarchical model, in order to understand the differences with the classical model.
The thesis is organized in three major clusters: Chapters 1 and 2 deal with Critical Infrastructures modelling and impact assessment of faults and failures; in Chapters 3, 4 and 5, Situation Awareness problem is described and Evidence Theory is applied to impact as-sessment of cyber and physical damages to interconnected complex systems; in Chapter6the State Estimation module in Energy Manage-ment Systems is described with a hierarchical structure; conclusions and future works are in Chapter ??.
1
M O D E L L I N G I N T E R D E P E N D E N C I E S I ND I S T R I B U T E D C O N T E X T
In the literature many approaches have been proposed to represent interdependency among Critical Infrastructures and their elements; these models, however, are mostly used off-line for simulations and impact analysis.
In this Chapter, an interdependencies modelling is proposed, called Mixed Holistic Reductionist (MHR) Approach, able to evaluate im-pact assessment and manage risk. This model allows combining the holistic method with the reductionist, trying to maintain the bene-fits of both paradigms. Another feature is the assessment of services towards customers and other operators. In fact, stakeholders and op-erators are focused on services and their quality for contract reasons. This approach has been implemented using an agent-based simula-tor, CISIA (Critical Infrastructure Simulator by Interdependent Agent) developed by “Roma TRE” University.
The research innovation is the validation phase of our approach in real and distributed context. In fact, this methodology has been developed for impact assessment in distributed and on-line context, where partial observations are composed into a wider perspective by exchanging only very abstract information, such as the quality of services. The main advantage of such a system is that the operators of the different infrastructures are able to make better decisions, because they are aware of the actual and foreseen unavailability of the services provided by the other infrastructures.
Moreover, due to the structural lack of adequate quantitative data, the interdependency model adopted is based on fuzzy numbers, and is tune-able with linguistic information obtained by stakeholders and experts of the different infrastructures.
The tool has been implemented and tested with respect to a real case study and it has been designed in order to be easily scalable
and extensible, within two FP7 EU projects: MICIE project [1] and
COCKPITCI [3].
1.1 s tat e o f t h e a r t
It is a fact that infrastructures are becoming more and more com-plex, tightly interconnected and mutually dependent, according to many dimensions, such as geographic proximity, cyber connection (i.e., reachability via the web) or resource exchange dependencies [78].
The word “infrastructure” is the ”basic, underlying framework or features of a system or organization” [2]. For the United States, the
general definition of critical infrastructure in the overall US critical infrastructure plan is: “systems and assets, whether physical or vir-tual, so vital to the United States that the incapacity or destruction of such systems and assets would have a debilitating impact on security, national economic security, national public health or safety, or any combination of those matters” [65].
Indeed the problem is complex mainly due to the exponential rel-evance of web based technologies used to control the infrastructures, these systems are becoming more and more interoperable; conversely, due to their complexity, the knowledge of human technicians is be-coming more and more sector-specific. The paradox is that, very often, Critical Infrastructures and their subsystems interact in ways that are hidden and not well understood by the single infrastructures’ experts, while this interaction represents the main cause of coupling among these systems, often leading to cascading failures and domino effects. This is the reason why sector-specific simulators and monitoring sys-tems, although being very sophisticated, fail to capture the behavior of the infrastructures in critical situations, when domino effects arise.
Modeling and simulation (M&S) tools for individual infrastruc-tures are rather well developed today. Many commercial products are available that enable infrastructure owners to operate, and man-age their systems, and to foresee their evolution. However, M&S tools for multiple, interdependent infrastructure are immature by compar-ison.
In the literature many approaches have been proposed to repre-sent the complexity of interdependent critical infrastructures; these methods are, typically, adopted in order to perform “what if?” anal-yses and ex-post simulations, with the aim to understand structural vulnerabilities, to asses and mitigate the risk of domino effects and multiple disruptions and to provide a support to decision-makers.
In [78], the authors emphasize how dependency and
interdepen-dency should be analysed with respect to different dimensions. In particular they catalogue dependencies into four, not mutually exclu-sive, classes:
1.1 state of the art 7
• Physical Dependency. Two infrastructures are physically depen-dent if the operations of one infrastructure depends on the phys-ical output of the other.
• Geographical Dependency. A geographic dependency occurs when elements of multiple infrastructures are in close spatial proxim-ity. In this case, particular events, such as an explosion or a fire in an element of an infrastructure may create a failure in one or more near infrastructures. This link is not generally accepted by all researchers, see for further information [64].
• Cyber Dependency. An infrastructure has cyber dependency if its state depends upon information transmitted through the ICT (Information and Communication Technology).
• Logical Dependency. Two infrastructures are logically dependent if their dependency is generated via control, regulatory or other mechanisms that cannot be considered physical, geographical or cyber.
In order to obtain insight on the behavior of interdependent in-frastructures, a first step is to consider a topological characterization of the infrastructures, representing them as complex networks com-posed of similar basic elements, inspecting emerging behaviors gen-erated by the interconnection of such elements [99,50,80,30].
In [53] a system composed by several homogeneous networks that
interact exchanging loads is analysed; in [61] there is an attempt
in the direction of studying heterogeneous interdependent networks (i.e., formed by infrastructures of different nature) showing that the coupling makes the system more susceptible to large failure. A simi-lar result has been reported in [14] where statistical mechanical and
mean field theory are used to extrapolate steady state solutions in re-sponse to removal of a fraction of nodes. In [91] there is an attempt to
formalize the interdependent dynamics among several heterogeneous infrastructures, considering the interconnection between a power grid and the telephony network and inspecting the effect of node removal. A similar formalism has been proposed in [54] where five types of
in-frastructure interdependencies are presented and incorporated into a network flow framework and tested with reference to the lower Man-hattan region of New York. In [80] the interconnection properties of
an electric grid and a telecommunication network that mimic the Ital-ian situation are studied, relying on the DC Power Flow Model [100]
to represent the electric power flow and considering also the packet routing in the telecommunication network.
The assumption of homogeneity (i.e., the nodes represent entities of similar nature), however, limits the applicability of these method-ologies, since in real cases infrastructures are composed of highly
heterogeneous subsystems; moreover topological methods typically limit their scope to the geographical interaction of subsystems.
A step further is done by adopting a simulative perspective, focus-ing on the representation of the isolated behavior of subsystems and then considering their interaction by means of simulation platforms and tools [73,21,73,46]. The interested reader can refer to the survey
conducted by Idaho National Laboratory [73].
Among the others, the Input-Output Inoperability Model (IIM) [48]
gained large attention. The idea is that each infrastructure is char-acterized by an inoperability qi(t), that represents its percentage of
malfunctioning, while q(t) is the vector of inoperability of all the infrastructures; the infrastructures are then considered as linearly de-pendent according to the following equation
˙q(t) = Aq(t) + c (1)
where c is the induced perturbation and A is the Leontief ma-trix whose coefficients aij represent the coupling between the i − th
and j − th infrastructure. Within this modelling framework, however, the interactions among different infrastructures are modelled with an high level of abstraction, while the behavior of the subsystems underlying the different infrastructures is masked; for instance it is possible to determine that an infrastructure is 50% inoperable, but it is not possible to distinguish whether half of the equipments of the infrastructure are down or the equipments’ working condition is de-graded. Another limitation of the IIM model its the economic origin; the main assumption of the model is in fact that the coupling among infrastructure is proportional to their economic interaction.
In [67] a first step has been done in order to overcome these
limita-tions, decomposing the infrastructures into a set of components and subsystems and considering the exchange of resources among these subsystems, thus allowing to tune the model by means of information elicited by infrastructures’ experts.
Such an idea has been further expanded in Agent Based approaches [82, 67], where infrastructures are decomposed into a set of
interact-ing software agents, each with a dynamic behavior and with hetero-geneous level of abstraction.
In order to enhance the comprehension of highly interdependent scenarios, in [24,21] the agent-based perspective was further enriched,
considering, at the same time, multiple and partly overlapping sentations of the scenario (i.e., physical, functional and global repre-sentations).
As exposed above, limiting the scope to the interaction among sub-systems may lead to crude approximations, in fact, besides being a set of interconnected components, an infrastructure is characterized by emerging functional behaviors and is greatly influenced by human
1.2 mixed holistic reductionist approach 9
behavior and sociological phenomena. When dealing with complex, highly interdependent scenarios, a single perspective may be reduc-tive, as stressed in [37].
An effective approach, then, is to take into account multiple rep-resentations of the same reality, each aimed to highlight a particular class of phenomena.
In [24] Critical Infrastructures are represented according to three
hierarchical layers:
m i c r o-level: represents the physical components that constitute the functional elements of an infrastructures (i.e., electrical equip-ments, gas valves, etc.)
m e s o-level: represents an infrastructure network at the system level (i.e., network nodes and links, power generators and loads, etc.)
m a c r o-level: represents the territory or zone which depend on the service provide by the infrastructure.
Within this framework, each level is considered as a nested subsys-tem, which can be analysed independently. Moreover, the propaga-tion of effects is assumed to spread from the micro to the macro level, neglecting downstream consequences and focusing on the effect of outages and failures on higher levels.
1.2 m i x e d h o l i s t i c r e d u c t i o n i s t a p p r oa c h
Most of the modelling approaches discussed above focus on the over-all, holistic, perspective or deeply inspect the cross-domain interac-tions among elementary, reductionist, elements.
In order to overcome these limits, we introduce a Mixed Holistic Reductionist approach (MHR) [21]. MHR approach is a
methodol-ogy able to modelling interdependencies and Critical Infrastructures, respect to predefined level of quality to customers or other facili-ties. In such a perspective, the best aspects of both approaches are maintained: the interdependencies among elementary components are modelled with the reductionist method, and the relations at high level are modelled through the holistic vision.
MHR methodology contemplates infrastructure modelling at dif-ferent hierarchical levels. The basic idea is to integrate three levels of abstractions, into a single simulator: holistic, reductionist and service.
Peculiarity of the MHR methodology is to combine pros of both the reductionist and the holistic approaches: interdependencies among elementary components are modelled with the reductionist method, and internal relationships, within the single facility, are modelled through the holistic view.
Figure 1: Reductionist entity representation
Figure 2: Service entity representation
Reductionist approach tries to model complex systems into small-est and simplsmall-est pieces. The holistic method reviews complex systems as the whole web of interactions. Both methods have benefits and drawbacks, so we want to apply the methodologies together, in order to overcome disadvantages of holistic and reductionist approaches. Between these two levels, an additional layer, called service layer, has been introduced to connect two opposite methodologies. This is a midway level of abstraction: this layer is necessary to focus particular services vital for customer satisfaction and to disaggregate resources and services from the holistic view into the reductionist equipment.
With a reductionist perspective (see Figure1), each infrastructure is decomposed into a web of interconnected elementary entities (or blocks); these entities receive and generate resources and may prop-agate failures according to proximities of different nature; therefore, their behaviour depends by the (mutual or not) interactions with the other reductionist elements. Moreover, their capability to correctly op-erate depends also by the availability and quality of some aggregate resources (or services) provided by service layer.
Services are introduced as functional blocks (see Figure2) demanded to provide specific, yet high level, functions to reductionist elements
1.2 mixed holistic reductionist approach 11
Figure 3: Holistic entity representation
belonging to the same or different infrastructure. Analogously to reductionist elements, services require and provide (aggregate) re-sources and may suffer and propagate some failures; this allows to model complex and high-level failures (e.g. the effects of cyber at-tacks) that, instead, are very complex to model with a mere reduc-tionist perspective. The operativeness of each service is largely influ-enced by the operative condition of the infrastructures, and by the policies and management strategies adopted in the specific context by the infrastructure’s stakeholders.
Holistic blocks represent the holistic view of the infrastructures (see Figure 3), and they interact with other holistic entities exchanging their operativeness. In this case the failure block allows modelling specifically some events like malicious behaviors, that should be very difficult to model at different abstraction levels. Holistic blocks have the duty to influence the operative conditions of service layer on the base of the feedbacks received from reductionist elements and con-sidering also the overall status of the infrastructure itself. Moreover every holistic node must provide adequate management service to service layer, by means of the definition and execution of adequate control actions (i.e., flow redirections, parameter configuration, event-driven suspension/reactivation/recovery, etc ...) in order to react to adverse events which may cause a degradation or denial of the ag-gregate resources provided by service layer and generate cascading propagation of faults.
Finally, an holistic node must be aware of the operativeness of its own service layer, in order to obtain a complete knowledge of the sta-tus of the infrastructure itself and then update the overall operative-ness accordingly. In Figure 4an example of the elements used inside the model is reported; in this case there are two infrastructures, elec-trical power distribution (ELE) and telecommunications (TLC), that are interdependent at every level.
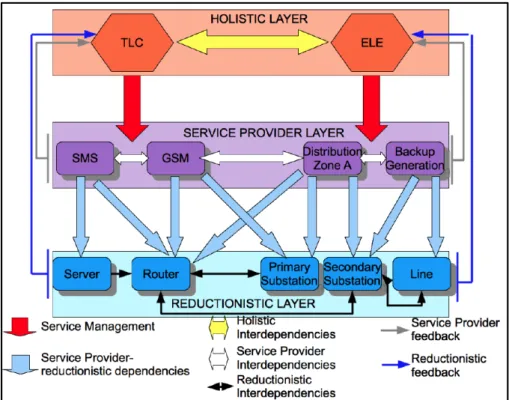
Figure 4: A graphical representation of an application for MHR approach
In Figure4, an application of this approach is depicted, using the CISIA software. We consider two infrastructures interdependent be-tween each others: telecommunication network and power grid. Ini-tially we described the two infrastructures as a unique agents at holis-tic layer. In the service provider layer, we choose services that are necessary to describe the Quality of Service (QoS) to customers: in telecommunication network services can be SMS and GSM, instead for the power grid the services are the ability to fed customer with dis-tribution network and backup power disdis-tribution. At service provider layer, interdependencies are detailed respect to considered services. The interconnections between service of the same facility are always known to operators, instead the interconnections among different in-frastructures are more complex. In this case, GSM equipment are fed by the distribution service in zone A and the backup distribution is always ordered by SCADA control center using telecommunication services. Reductionist layer explains a more detailed level of abstrac-tion, usually considering the equipments. Interdependencies are de-scribed by links among instruments, as the interconnections between power substations and telecommunication routers.
In Figure4are also depicted feedback from reductionist and service layers into holistic layer, as usually happens in control loop, to report faults and alarms. The presence of feedback arrows is not manda-tory and it is usually applied to send “broadcast” information about faults and failures. Data, coming from SCADA systems, are related
1.3 critical infrastructure simulation by interdependent agent (cisia) 13
to reductionist agents (i.e., short-circuit at load level), then they in-fluence holistic nodes and, therefore, services. Due to feedback loops and all possible connections among layers, the distributed approach can be applied. In fact, the transmitted data between control centres is just the one related to services and holistic agents, in order to pre-serve the privacy of the real data in the fields. So services and holistic nodes must affect in some ways also the reductionist equipment.
Notice that, although being a very flexible and powerful formalism, the main drawback of such a methodology is that the effort required to tune the model is directly proportional to the degree of detail re-quired. Nevertheless, this is a common problem of knowledge and system modelling.
A relevant issue is how to reverse the (mono-directional) dependen-cies between services and reductionist elements; in fact, specifying the exact contribution exerted by each single reductionist element on the different services may lead to unmanageable complexity. Indeed such inverse dependencies are mostly hidden and complex from the point of view of the single service; moreover usually the adequate control actions performed in order to grant an acceptable quality of such services are demanded to entities with a wider perspective (i.e., a control room). Hence it is more rational that an service relays on data provided by a management entity with an overall vision, able to filter the huge amount of reductionist data, instead of taking into account the contribute of every single component.
Notice that, in the proposed framework, services are not directly dependent on the reductionist elements, but are dependent on aggre-gate information coming from higher level nodes, which have a wider perspective.
1.3 c r i t i c a l i n f r a s t r u c t u r e s i m u l at i o n b y i n t e r d e p e n -d e n t a g e n t (cisia)
Based on the MHR approach, in this section, the Critical Infrastruc-ture Simulation by Interdependent Agent (CISIA) [21] framework will
be detailed where connections among entities, including in different layers , and the transmission mechanisms are described. CISIA is an agent-based interdependency modeling framework. The overall sys-tem of syssys-tem is decomposed into a set of n entities, and the spread-ing mechanisms of m resource typologies and k classes of failure are considered.
Such framework considers multiple interconnection matrices, which represent the different typologies of interaction; the result is a multi-graph, which allows performing complex topological and dynamical analyses.
Within this approach, all the elements follow a common general model:
Figure 5: Input-output CISIA entity behavior
• Elements exist in order to produce, and transport or consume tangible or intangible resources (goods, services, policies, man-agement, etc);
• Elements may suffer faults or failures;
• Different faults may be propagated, or propagate their negative effects, according to proximities of different nature;
• The capability of each element to provide the required resources may depend on its operative condition, which is based on the availability of the resources it requires and on the severity of the failures that affect it.
Each CISIA entity can be represented as in Figure 5 through an input/output behaviour. The operative level is a quantity which sum-marizes the status of the entities, and which is used to drive the be-havior of such elements. Each entity receives some input resources and some input failures, and generates output resources and failures.
The model is able to take into account an external operativeness re-duction, in order to represent the disruptive phenomena which may cause the inoperability of an element. CISIA entity are then inter-connected by means of different adjacency matrices, whose links are characterized by an attenuation, due to dissipation phenomena, and a time delay.
Moreover, in order to effectively represent the uncertainty of hu-man operators and actors, all the variables describing the dynamics of entities are expressed by Fuzzy numbers (FN) [29]. Fuzzy
num-bers can be seen the most natural way to introduce model and data uncertainty in a technical talk.
The implementation of CISIA has been performed in ANSI C++, strictly following an object oriented approach.
In Figure6 we describe the basic input-output characteristics of a generic element; such a block is composed by a set of N input (or output) ports, each demanded to send or receive some resources or
1.3 critical infrastructure simulation by interdependent agent (cisia) 15
Figure 6: Representation of generic CISIA entity ports
Figure 7: The structure of CISIA simulator
failures. Within such a general model, many configurations are possi-ble; however every element is at least equipped with a “failure” port devoted to send (or receive) failures and an port, called “A” used to forward its operative level.
Within the simulator, a simulation instance is primarily constituted by the entities and the adjacency matrices that interconnect them; in fact there is the possibility to specify, at every abstraction level, mul-tiple graphs, each describing the exchange of a particular resource or the diffusion of a particular class of failure (i.e. geographic, cy-ber, sociological, etc.). Entities and matrices are collected in two main structures, respectively Entity Pool (EP) and Transmission Sub Sys-tem (TSS), both depicted in Figure7.
Each simulation step is driven by the clock, a routine that synchro-nizes the computation steps of the entities with the message
exchang-ing phase, managed by the TSS; at each step entities generate their re-sources and failures and such quantities are routed to other elements according to the multi-scale, multi-graph topology of the framework. Each link can be equipped with a defined delay in terms of time steps required for the transmission of the resource/failure, and with an at-tenuation that represents a dissipation or atat-tenuation of the quantity during the transmission.
Moreover each timed cycle begins with a set of instantaneous cy-cles, in order to depict real-time dependencies; in fact it is not possible that an element within a power grid has to wait some cycles to receive power, such a resource has to be instantly forwarded (and the lack of such a resource has to be instantly noticed). Therefore at the begin-ning of every timed cycle many instant cycles are performed, until the overall system reaches a steady state.
As shown in Figure 7, the Transmission Sub System (TSS) is de-voted to manage the communication between the entities. The TSS stores the matrices which describe the different types of adjacency between the entities, as exposed above. Entities communicate via mes-sage exchanging, where each mesmes-sage contains data about the type and the denormalized quantity of carried resource (or fault), the nor-malizing factor, unit of measurement and the sender port identifica-tion (ID). When the TSS receives the signal from the simulaidentifica-tion clock, it collects the outgoing messages from all the entities and delivers each message to the neighbours of the sender entity, according to the adjacencies described in the matrix associated with the type of the car-ried quantity. If a link between two adjacent entities is characterized by attenuation or delay factors, TSS provides to delay the delivery of the messages routed over that link and to suitable scale the carried quantities.
The Entity Pool (EP) synchronizes the execution steps of the entities and to manage their persistence. EP stores the entities inside a multi indexed vector, keeping also the map between the communication ports and the correspondent entities. When it receives a signal from the simulation clock it keeps the execution control, and spanning the vector which contains the entities, launches the atomistic simulation step on each entity. Once all the entities have run their simulation steps, gives back the control to the clock. After this step the EP waits for the execution of the communication phase, exploited by the TSS. During this phase it works as a mapping interface between the calls of the TSS and the communication routines of the entities.
The CISIA framework, therefore, is a discrete-time, agent-based methodology able to represent the exchange of resources and fail-ures among the entities, considering also the attenuations and delays which may occur during transmission.
Moreover, the interdependency is modelled by means of multiple adjacency matrices, resulting in a multi-graph. Finally, each quantity
1.4 example of interdependent critical infrastructures 17
Figure 8: The considered MV power grid
is modelled by means of Triangular Fuzzy Numbers [29], allowing
to encode vague information and providing an estimation of the cer-tainty of the simulation/prediction.
1.4 e x a m p l e o f i n t e r d e p e n d e n t c r i t i c a l i n f r a s t r u c t u r e s In this section we describe an example of the infrastructures consid-ered in the case study will be outlined, then some results will be provided. However, due to non disclosure issues, the numerical re-sults of this section are very general and are aimed to demonstrate the potentialities of the approach (see the MICIE website [1] for more
details).
The infrastructures considered in the case study are:
1. A portion of a Medium Voltage (MV) power distribution grid; 2. A SCADA system that controls the grid, allowing the
communi-cation among SCADA centers and Remote terminal units (RTUs) that physically operate the network;
3. A fiber optic telecommunication network that is used as com-munication link between the power grid and the SCADA infras-tructures.
The reference scenario explicitly takes into account the set of essen-tial services required for the correct functioning of the systems, the sequences of adverse events that could degrade the quality of such services, in terms of continuity, readiness, performances and time re-sponse. The model of the system of systems is therefore focused on the customer Quality of Services (QoSs) evaluation from the critical infrastructures operator point of view.
The electrical power produced in power generation stations is typi-cally made available to the final customers through the transmission network and the distribution network.
The transmission network is similar to a meshed graph, in which every node is reachable through more than one path. The nodes of the graph represent the substations, while the arcs represent the transmis-sion lines that connect the several substations. This topology make the network high reliable and available, avoiding that the loss of a single generator or a single line causes dangerous consequences.
The distribution network feeds consumers. The structure is mainly operated in a radial topology. The loads are connected to their sub-stations in a star or in a ring with the aim of reducing service in-terruptions as a result of a major fault. The portion of electric MV distribution grid belonging to the current reference scenario is shown in Figure8.
The main elements that constitute such infrastructure are the fol-lowing:
• Two substations in which the electric power is transformed from 161 KV to 22 KV and splits to feed several customers. In our case, there are thirteen customers, of which six public, five com-mercial and two industrial customers;
• The electrical trunks which feed the final customers, connecting the substations to them.
The following interconnections in the MV electrical infrastructure, constituted by the electrical grid at 22 KV, are:
1. RTUs interface the portion of the MV power distribution grid with SCADA system;
2. Substations interconnect the portion of the MV distribution net-work to the portion of High Voltage (HV) transmission netnet-work. The SCADA system consists of Motorola SCADAs that interfaces with Moscad TCP/IP Gateways and Field Interface Units (FIU) which manage the communication with RTUs, through elements such as Radio Frequency (RF) modem, called also MOSCAD, which convert wired signals to radio signals towards RTU.
The SCADA system is responsible for command and control oper-ation on MV grid via graphical displays of switch operoper-ations and list of alarms.
The main SCADA functions are:
1. Acquisition and alarm of the Change of State of the MV switches; 2. Polling of the RTUs from the control center upon scheduled
time, operator’s request, and pre-defined event;
3. Graphical presentation of the current status of the MV switches; 4. Store of the history of Change of State of the MV switches.
1.4 example of interdependent critical infrastructures 19
Figure 9: The SCADA network, for the case study
The other elements of the SCADA system reported in Figure9are described briefly.
The MCP-T is a gateway which converts the TCP/IP protocol in the Motorola proprietary protocol (MDLC) performed on the system. The MOSCAD FIU is a specific device dedicated to RTU interrogation and to the routing of data messages to/from the central. The FIU comprises RF modems. Each modem includes two VHF radio units, allowing field RTUs to reach SCADA centre on either channels. The Store & Forward Repeater is a special RF modem.
It is worthwhile to notice that SCADA is fully redundant. The topol-ogy of SCADA is reported in 9. The following interconnections have been discovered:
• With the MV power distribution grid by means of SCADA RTUs; • With telecommunication network by means of the links between
SCADA control centre and SCADA RTUs;
• The bus in SCADA control Centre is interconnected with telecom-munication network;
• SCADA elements, such as RTUs and Control Centers are pow-ered by the MV power distribution grid, adequately interfaced with a LV power grid and by means of an emergency power supply, typically constituted by UPS.
Usually, a telecommunication network is made of a core, a metro access and a customer access network.
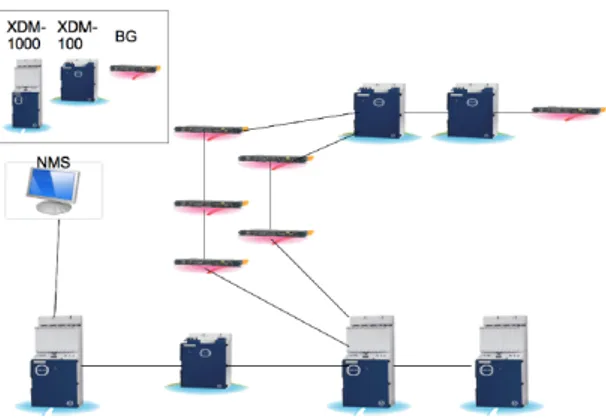
The topology of telecommunication transmission network is re-ported in Figure10. The network includes elements of the backbone, which are interconnected by Wavelength Division Multiplexing (WDM)
Figure 10: The telecommunication network, used in the case study
technology, elements of the metro access network, with SDH/STM-16 technology, and elements of customer access network with SDH/STM-4technology.
The core network is based on ECI Telecom’s XDM-1000s. These equipments are massive traffic concentrators which are installed in the heavy loaded metro-core junction. They support a wide range of data services. The metro access network is based on the ECI’s XDM-100s. This network is characterized by the increasing demand by residential and business customers for higher bandwidth to sup-port voice, data and video services.
The customer access network is based on ECI’s BG equipments which are linked with other network by SDH technology. They deliver a mix of Ethernet, SDH and PDH services.
The Network Management System (NMS) enables efficient manage-ment of the communication transmission network. The NMS provides monitoring and supervision of the three levels of the communication network, by means of:
• Monitoring the fiber optical;
• Monitoring and managing transmission equipment network; • Monitoring and managing the access network.
The following interconnections have been discovered:
• Some equipment of the customer access network are located into power grid substations, for example the substations (geo-graphic interdependency);
• Some elements of the telecommunication network are powered by portion of the electrical infrastructure, constituted by the elec-trical grid at 22 KV, shown in8, adequately with a Low Voltage (LV) power grid and by means of an emergency power supply, typically constituted by Uninterruptable Power Supply (UPS).
1.5 online prediction tool 21
Figure 11: The online prediction tool configuration
1.5 o n l i n e p r e d i c t i o n t o o l
The online prediction tool is a flexible and decentralized software tool that allows to connect different interdependent infrastructures and to compose the domain specific information of each sector in or-der to obtain a global estimation of the actual and future behavior of the System of Systems, based on a set of partial observations; each distributed tool, attested in a given infrastructures’ control room, is equipped with an MHR model of the overall system and the model can be used to perform a short and medium term prevision of the working condition of the infrastructure and its subsystems. The un-derlying idea of this approach is that the single infrastructure, con-sidering only its sector specific information may provide incomplete previsions, that do not take into account the interaction with the oth-ers.
For instance a power grid analysis software, although being aware of the disruptions occurring across the network, is not able to de-termine the congestion of a telecommunication network used to op-erate and reconfigure the electric branches remotely; conversely the telecommunication management software may be aware of the rout-ing and packet flow, but is not able to forecast the occurrence of black-outs that may influence the working capability of telecommunication nodes.
Such a composition of information may also help discover domino effects and cascading failures; for instance a network congestion may interfere with the ability of the power grid to reconfigure the loads, leading to blackouts and thus exacerbating the critical situation of the telecommunication network and so on, in an ascending climax.
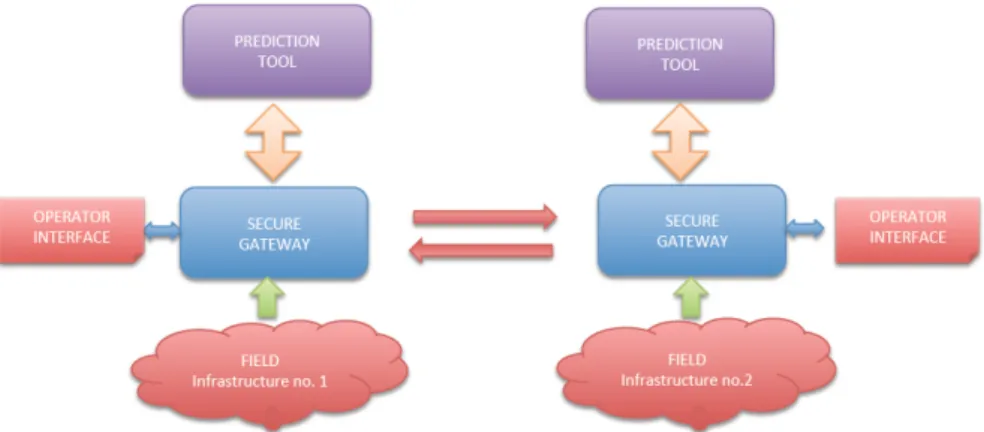
Figure 11 depicts the general structure of the online tool, whose main components are:
1. Field: each tool is attested in a given infrastructure and is fed with sector specific real- time data coming from the specific field; for instance the tool attested in the power grid
infrastruc-ture is aware of the state of transformers, generators and electri-cal customers, or the telecommunication infrastructure knows the traffic congestion, the operativeness of the equipments and the routing tables. The focus of the system is on the exchange of information and the synchronization of prediction; therefore the procedure for the retrieval of real time inputs used to feed the model was intentionally neglected and, in the case study, each tool used the original sensors and management systems of the particular infrastructure.
2. Secure Gateway: in order to avoid disclosure of sensible infor-mations and to protect the information exchange among the tools, a secure gateway has been implemented for each tool. The gateway filters the huge quantity of information retrieved from the field and is responsible of the secure communication with the other tools and with the prediction tool; to this end a suite of security protocols have been implemented and the gateway adopts a web-service architecture based on the WS02 Carbon framework (www.wso2.com) and on X.509 [6] security protocol
for the communication between the tools. Finally an ip filtering and an IPSEC [27] protocol has been set up for the
communi-cation between the field and the gateway and between the gate-way and the prediction tool (for more details refer to the MICIE Project Deliverables [1]).
3. Prediction Tool: the prediction tool is the core module of the sys-tem, and it is responsible of the computation of the expected evolution of the system, based on the field data and on the data received by the other tools. At this level the discording data coming from the different information sources are com-posed and, once a consensus is reached among the prediction tools, the data is fed to the actual MHR interdependency model, computing a prediction of the state of the whole system (e.g., the power grid computes also the expected evolution for the telecommunication infrastructure, based on the data available, in order to capture interdependency phenomena that could not be captured by the single sector specific system).
4. Operator Interface: the interface is a set of linked graphical pan-els that summarize the actual and near future evolution of the system. The GUI offers different kinds of representations; an high-level interface is provided, where only the general state of the infrastructure (and of the other infrastructures as it is estimated locally by the tool), is represented. The interface of-fers also a comprehensive view of the reductionist components of the infrastructures; as shown in Figure 12, the operator has information about the actual state of the component (e.g., the component is marked with a red cross if it is down) and an
1.5 online prediction tool 23
Figure 12: The operator panels
information about the expected state in the short (S), medium (M) and long (L) period, by means of three color indicators for each component, which act like traffic lights. In this way, besides noticing the actual failures, the operator is warned for possible future disruptions: for instance an orange medium time warn-ing for an element in a secondary communication path in the telecommunication network, when the default route is not work-ing may represent an expected congestion.
The proposed architecture therefore is aimed to compose partial observations by filtering the data coming from each infrastructure and exchanging information by means of a secure communication network; the distributed and peer to peer nature of the single tools allows great scalability in the case of multiple infrastructures.
Mathematically, this approach has been studied using the distributed consensus of arrays of systems with fuzzy variables, for further infor-mation [66,68].
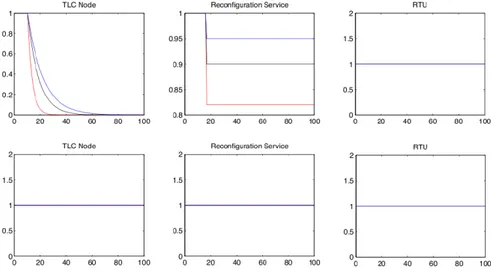
Figure13represents the case where the electrical infrastructure and the telecommunication infrastructures do not exchange data. In the example, for the sake of clarity and simplicity, only three entities are considered: a telecommunication node, the electrical reconfiguration service and an RTU.
Figure 13: Example of isolated prevision
Figure 14: Example of composition of isolated previsions
The plots in the first row of Figure13represent the evolution of the state of the three entities seen by the telecommunication infrastruc-ture, while the second row is the perception of the electrical infras-tructure.
If at a given time instant a failure is detected on the telecommu-nication node by the telecommutelecommu-nication infrastructure, the working condition of the corresponding entity in the MHR model attested in the telecommunication infrastructure degrades; subsequently the model is able to predict a reduction in the working capability of the reconfiguration service, that is used by electrical technicians to op-erate remotely the power grid. Notice that, obviously, the electrical infrastructure does not receive information.
A completely different case is depicted in Figure 14, where the infrastructures communicate by means of the online framework. Be-sides agreeing on the severity of the failure on the
telecommunica-1.6 conclusions 25
tion node and on the degradation of the Reconfiguration service, the proposed approach explicitly takes into account cascading failures and exacerbations; in fact the information received allows the electri-cal infrastructure to forecast a reduction in the working capability of the RTU. Such a new information, besides being passed back to the telecommunication infrastructure, generates further failures and ex-acerbates the existing failures, as shown by the Figure14. Moreover it is possible to notice the presence of a slight delay due to the commu-nication and consensus. Finally, note that the fuzzy formalism allows to take into account complex situations, where the best and worst cases are not symmetric; in the Figures the red, black and blue lines represent the evolution of the left endpoint, of the peak value and of the right endpoint of the triangle, respectively, and are associated to the best, mean and worst case. Notice that the distance between the curves is not regular, meaning different expectations for the best and worst cases. In this example the blue curve is always closer to the black one with respect to the red one, meaning that the best case is much more unlikely then the average and worst case.
1.6 c o n c l u s i o n s
This Chapter details the Mixed Holistic Reductionist Approach, based on CISIA software, in Sections 1.2and1.3. The main step is the vali-dation of this methodology in a real on-line case study, described in Section1.5.
A further enhancement has been the possibility of different struc-tures: the centralised approach and the decentralised one. In the last case, the exchanged information among Prediction Tools is just the one related to services and highest node, i.e., holistic agents. In this way, the protection on real performance of infrastructures is achieved.
2
I M PA C T A S S E S S M E N T O F C Y B E R T H R E AT SRecently issues about cyber-war have gained relevant attention, espe-cially because of gravity of damages that could be caused by cyber attacks to strategic targets, mining security of citizens. Examples of targets might include national civil and military airports, command and control systems of civil and military transportation means elec-tronic military systems for national defence, national infrastructures for water and electricity distribution, industries and also hospitals or fire-fighters informatics systems.
The risk of cyber attacks for the mentioned systems and infras-tructures has grown because of the introduction of general-purpose and open (not proprietary) communication protocols, widely inter-connecting systems and services.
With this regard, it is of great importance the problem of evaluat-ing the impact that cyber attacks could generate and to select effective countermeasures to protect military and civil heterogeneous and in-terconnected systems.
The validity of MHR model has been already tested within the con-text of Critical Infrastructure Protection. In this Chapter, the effective-ness of the model is studied with regard to government infrastructure protection from cyber attacks and, with this regard, an explicative case study is presented.
This Chapter also proposes an innovative SCADA security test-bed that incorporates a Mixed Holistic Reductionist (MHR) methodology with SCADA network equipment. This technique performs an im-pact assessment keeping into account the existing interdependencies among Critical Infrastructures, controlled and supervised by SCADA systems. The main enhancement is the whole test-bed: a SCADA sys-tem with an impact assessment tool, able to visualize the forecasting outcome. The main effort has been on the finding the impact of differ-ent cyber attacks on the physical power grid: for example, how much the DoS can affect the behaviour of a breaker.
An application of the experimental framework to a sample scenario is presented in order to demonstrate the response of the system start-ing from detection of cyber attacks to impact evaluation of services delivered by each interdependent system.
2.1 c y b e r t h r e at s
Improving decision-maker situational awareness within the cyber do-main is not greatly different than enabling Situation Awareness in more traditional domains. The need of gaining Situation Awareness (SAW) (see also Chapter3) arises when users deal with the problem of identify, understand and project situations, occurring in a specific domain, or even in complex and cross-domain contexts. Situations of interest depend on the context, as mentioned before, but also on the environment and on roles and goals of decision makers involved in the SAW process, anyway SAW methodologies can be defined in order to support any domain.
In this Chapter, Situation Awareness is considered in its broadest sense, as perception, comprehension and projection of the status of a system, following Endsley’s definition [31]. For effective Cyber
Sit-uation Awareness [92], a crucial task is the identification of those
activities individual decision makers are interested in and need to maintain awareness of over time. Once the activity of interests are identified and modelled, the observations necessary to identify the activities need to be defined. Another relevant aspect, besides to pro-cess analysis and model building, is the evaluation of the effective-ness of the SAW process implemented. The evaluation cannot rescind from the improvement of the cognitive process and decision making support. Anyway, measuring effectiveness for the proposed approach is still an open area of research.
Situation Awareness must be addressed to maintain users and oper-ators not only informed of what is going in facility, but also conscious of the events. This process can be realized in two ways:
1. Model possible cyber attacks, define possible observations and in on-line mode try to recognize same attacks displaying events and already known information;
2. Model entire system, simulate in off-line mode some possible attacks, evaluate impacts or vulnerability on system and take into account the countermeasures to protect the on-line system from the most dangerous vulnerabilities and attacks.
In this Chapter, the framework proposed refers to the second ap-proach mentioned. The methodology presented is called Mixed Holis-tic Reductionist approach (MHR) and it allows to model heteroge-neous systems and to evaluate impacts of faults and attacks, through
2.1 cyber threats 29
the definition of different agents and their dependencies. The simu-lation model was originally thought to design critical infrastructures and their interdependencies, and to analyse their vulnerabilities in emergency situations as crisis after natural events (like earthquake or tsunami) or after some rare events that can lead to large outages for customers.
Within Critical Infrastructure Protection, cyber interdependencies are mainly due to the presence of SCADA systems, that make use of wide telecommunications networks to interconnect control rooms and the generic RTUs (Remote Transmission Units) in the field. In the past, SCADA systems employed proprietary, closed and specific protocols, as the Motorola MDLC. Recently, because of the develop-ment Internet, SCADA systems employ open telecommunications net-works, such as the Internet itself, for the transportation of specific and relevant packages between the control room and RTUs.
All these changes in Industrial Control Systems increases the prob-lem to protect these control system from cyber attacks and not only from the physical attacks. This issue is growing importance, also due to real experiences demonstrating how cyber attacks can affect also critical infrastructures.
The most popular attack is known as Stuxnet. Stuxnet [33] is a
computer worm designed to affect industrial systems. Stuxnet in-fected Windows-based computers on industrial control systems. The worm is very complex, and its final goal was to reprogram Indus-trial Control Systems, hiding the changes to the operator. Stuxnet main features includes: zero-day exploits, Windows rootkit, first ever PLC (Programmable Logic Controller) rootkit, antivirus evasion tech-niques, complex process injection, hooking code, network infection routines, peer-to-peer updates, and command and control interface.
Other kinds of cyber attacks are those propagated from “inside”: the infection starts in a workstation of the business/corporate net-work and then reaches the control system netnet-work and the control room. Another very common attack is carried out by compromise the Web-based interfaces to control room management systems ex-posed on Internet, by means of simply search engines like Google or ShodanHQ.
Cyber security government agencies, like Department of Homeland Security (DHS) and Australian Department of Defense Intelligence and Security, focus their attention on strategies for improving control system security and for mitigating cyber intrusions. These strategies provide guidelines for administrators on steps to take to ensure secu-rity confidence.
Infrastructures owners and operators are forced to act in accor-dance with national guidelines. Each facility should require a vulner-ability assessment process to assess insecurities and make decisions about operating risks, and to make progress towards reducing risks
associated with control system operations. Vulnerability analysis pro-vides a method of prioritizing the criticality of assets, threats and countermeasure strategies.
In recent years, researchers are focused on the power grid, and es-pecially on the control system of power grids. Sridhan in [89] models
a specific cyber attack related to data integrity attacks on a specific control area in SCADA power system. The approach extends cyber se-curity attack concepts to control systems in an electric power system, especially on the Automation Generation Control (AGC) loop. Amin in [7] models stealth attacks on generic systems connected among
them by telecommunication network, using game theory framework. This approach is independent from the specific facilities implemented in each node of the game theory.
Usually, the reference protocol is IEC 61850, which provides some generic features like the packet length and structure, for packet run-ning on SCADA networks. In [75] authors described different kind of
cyber attacks with possible countermeasures, specific for IEC 61850 transmission protocol. In [85], authors use the dynamic game theory
to evaluate impact of several strategies for cyber network defences. A tool has been proposed in order to enhance understanding of cyber-network defence.
2.2 r e f e r e n c e a r c h i t e c t u r e
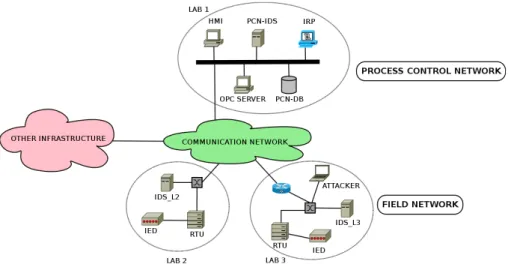
The network topology of the proposed SCADA security testbed is based on common SCADA network employing components such as Programmable Logic Controllers (PLCs), Remote Terminal Units (RTUs), Intelligent Electrical Devices (IEDs), Human Machine Interface (HMI) based on client/server architecture. All components are connected through an appropriate communication network. Innovative compo-nents consist of the Integrated Risk Predictor system (IRP) and a set of Intrusion Detection Systems (IDSs) that contribute to the task of im-pact evaluation of cyber risks on physical components of the SCADA system. The overall network for SCADA security experimentation is distributed over the Internet to emulate the geographic extension of large SCADA systems and consists of three different labs located at University of “Roma Tre” and ENEA premises. Figure 15 shows the topology of the proposed SCADA security testbed.
The reference architecture consists of the following components: • Process control network: This network is the connection layer
among equipment of the SCADA control centre. A database (PCN-DB) stores information about equipment in the field. Data and information are visualized to operators through a specific HMI. Those information can be retrieved by means of a OPC (Open Platform Communication) server to other operators but also to the IRP (Integrated Risk Prediction Tool) which performs