Volume 40, Issue 1
Measuring the impact of financial crisis on quality of life in Europe
Gianni Betti
University of Siena
Antonella D'Agostino
University of Naples "Parthenope"
Giulio Ghellini
University of Siena
Sergio Longobardi
University of Naples "Parthenope"
Abstract
Improving and monitoring Quality of Life is becoming one of the most important goals of European Union policies. However, its measurement is complex and multi-faceted, as an individual's current and future state of wellbeing depends upon a great number of variables. Moreover, there is no doubt that crisis impacted differentially in European countries. Against this background, the aim of this article is to provide a better understanding of the changes in quality of life in European countries and the role of receiving contexts in influencing these outcomes. In order to achieve it, the paper proposes a multidimensional and fuzzy approach to measure Quality of Life and investigate the evolution of different dimensions of quality life over time by use a propensity score method for isolating the effect of crisis from the net change.
Citation: Gianni Betti and Antonella D'Agostino and Giulio Ghellini and Sergio Longobardi, (2020) ''Measuring the impact of financial crisis on quality of life in Europe'', Economics Bulletin, Volume 40, Issue 1, pages 292-307
Contact: Gianni Betti - [email protected], Antonella D'Agostino - [email protected], Giulio Ghellini - [email protected], Sergio Longobardi - [email protected].
Submitted: June 19, 2019. Published: February 05, 2020.
Submission Number: EB-19-00569
Measuring the impact of financial crisis on quality of life in
Europe
Gianni Betti
Antonella D'agostino
University of Siena
University of Naples "Parthenope"
Giulio Ghellini
Sergio Longobardi
University of Siena
University of Naples "Parthenope"
Abstract
Improving and monitoring Quality of Life is becoming one of the most
important goals of European Union policies. However, its measurement is
complex and multi-faceted, as an individual’s current and future state of
wellbeing depends upon a great number of variables. Moreover, there is
no doubt that crisis impacted differentially in European countries. Against
this background, the aim of this article is to provide a better understanding
of the changes in quality of life in European countries and the role of
receiving contexts in influencing these outcomes. In order to achieve it,
the paper proposes a multidimensional and fuzzy approach to measure
Quality of Life and investigate the evolution of different dimensions of
quality life over time by use a propensity score method for isolating the
effect of crisis from the net change.
1
Introduction
Over the past few years, citizens’ quality of life (QoL) has become an important goal of policies in the European Union (EU). This concept, which is strongly related to the idea of pursuing the “good life” for individuals and societies, was of particular political importance from 2008 onwards because of the economic crisis, the rapid social disruption, and the consequent increase in social inequality. Furthermore, measurement of QoL is complicated and multifaceted since an individual’s current and future state of well-being depends upon a myriad of variables (Shek, 2007). For this reason, objective indicators that provide information about who is doing well or badly and subjective components are particularly useful for conceptualizing QoL as happiness or affect, and they offer a comprehensive representation of the impact of the economic crisis on the “good life” of individuals and societies. What we learn from several QoL indicators can clearly help in monitoring and mapping the living conditions of people in different countries, regions, and social groups and thus can inform policy design and assessment (Dolan and Metcalfe, 2012). Undoubtedly, the crisis had differential impacts on European countries. Against this background, the goal of this article is to provide a better understanding of the changes in the QoL in European countries and their role in influencing these outcomes. Indeed, unlike previous comparative research, which is primarily concerned with some aspects of quality of life, our aim is to measure the impacts of the crisis on several crucial dimensions of QoL. The major novelty of this paper is the methodology proposed to isolate the effect of the crisis from underlying and on-going societal changes when data come from independent cross-sectional surveys. The interesting study by Betti (2017) based on the same data was limited to measuring the net change in QoL. Thus, inspired by this contribution, this study builds on the existing and mature assessment of QoL with a more accurate measure of the impact of the financial crisis on QoL in Europe using the same multidimensional perspective. Our concrete empirical strategy adds to the current knowledge. It starts with the range of dimensions defined by Betti (2017), which should not be aggregated any further to adequately capture life’s complexity, and then uses the propensity score method (PSM; Rosenbaum and Rubin, 1983) to properly measure the effects of the financial crisis. Moreover, we also investigate whether the estimated changes in QoL during the crisis are related to their respective changes in growth. Our micro data come from the European Quality of Life Surveys (EQLS) for 2007 and 2012, and the macro data come from the Eurostat database.
2 Background
2.1. Measuring the Quality of Life
Over the past few decades, the measurement of quality of life (QoL) has been extended to many contexts, such as health, justice, the economy, or the environment. Despite its importance, several authors stress that no consensus has been reached on its definition or proper measurement (Pinto et al., 2016; Moons et al., 2006; Meiselman, 2016). Actually, the concept of QoL varies widely, and the literature is characterized by a plurality of approaches because it is a complex concept with a multifaceted nature that is not easy to define and measure. Moreover, the definition of this term depends on the research objectives and context of analysis, as such disciplines approach the concept differently. In this paper, we use social indicators to define and assess the QoL of the general population and measure its changes over time due to the economic crisis. For this reason, the conceptualization of QoL refers to objective (based on material aspects) and subjective (which concern how people assess their lives) indicators of living conditions (Glatzer, 2006). This approach dominates almost all research on QoL, and usually, it is common to arrange simple indicators into various dimensions to represent specific aspects of QoL (Mauro et al., 2018). Actually, we do not intend to offer a full discussion of the
general literature on the definitions and models of QoL, but we embrace the idea that people’s QoL should be understood based on their experience and perspective. Because QoL is not only a difficult but also a vague concept to define, we adopt the multidimensional and fuzzy-set approach proposed by Betti et al. (2016) as a conceptual framework, which in turn is based on the seminal contributions of Nussbaum and Sen (1993), Eurofound (2003, 2010), and Phillips (2006). Accordingly, to organize our research and classify our QoL conceptualization, we use the eight dimensions articulated by Betti (2016, 2017), and in Table 1, we set out the 48 individual variables used in the empirical analysis arranged along these dimensions.
Table I: Dimension and items of Quality of Life index (QoL)
QoL1 quality of relations
q25a Poor and rich people
q25b Management and workers
q25c Men and women
q25d Old people and young people q25e Differentracial and ethnic groups q25f Different religious groups
QoL2 trust in people and
institutions
q28a The parliament q28b The legal system q28c The press q28d The police q28e The government
q24 Generally speaking, would you say that most people can be trusted, or that you can’t be
QoL3 access to services
q47a Distance to doctor’s office / hospital/medical centre q47b Delay in getting appointment
q47c Waiting time to see doctor on day of appointment q47d Cost of seeing the doctor
QoL4
quality of public services
q53a Health services q53b Education system q53c Public transport q53d Child care services q53g State pension system
QoL5 subjective well-being
q40a Your education
q40c Your present standard of living
q40d Your accommodation
q40e Your family life q40g Your social life q29e I feel left out of society
q30 Life satisfaction
q41 Happiness
QoL6 housing quality
q59a Keeping your home adequately warm q19b Rot in windows, doors or floors q19c Damp or leaks in walls or roof q19d Lack of indoor flushing toilet q19e Lack of bath or shower
q19f Lack of place to sit outside (e.g. garden, balcony, terrace)
QoL7 standard of living
q19a Shortage of space
q59b Paying for a week’s annual holiday away from home q59c Replacing any worn‐out furniture
q59d A meal with meat, chicken, fish every second day if you wanted it q59e Buying new, rather than second‐hand, clothes
q59f Having friends or family for a drink or meal at least once a month q60a Rent or mortgage payments for accommodation
q60b Utility bills, such as electricity, water, gas inc_ind Income deciles
QoL8 health
q40f Could you please tell me on a scale of 1 to 10 how satisfied you are with your health? q42_in In general, would you say your health is …
q43_44 Chronic physical or mental health problem, illness or disability
These dimensions cover a wide range of crucial aspects of QoL: the quality of social relations, trust in people and institutions, access to services, the quality of public services, subjective well-being, housing quality, standard of living, and health. The “quality of social relations” concerns individuals’ social relations with other people and is measured by the degree of tension between some specific social groups, which could be important in the individual’s social development. “Trust in people and institutions” is a key dimension of social capital. Different studies have linked trust to well-being and have usually found a positive impact (see Helliwell and Putnam, 2004; Helliwell, 2006; Bjørnskov, 2008). Therefore, it is an important aspect of quality of life that needs to be studied over time. “Access to services” groups several important aspects related to the difficulty in gaining access to medical services. The “quality of public services” concerns the subjective perception of the quality of some relevant public services. “Subjective well-being” measures satisfaction with some important items concerning individual life. “Housing quality” represents the housing context related to physical housing conditions that may intersect with individual health. “Standard of living” reflects the individual ability to buy or obtain basic goods and services. Finally, “health” measures satisfaction with personal health and attitude towards the future, which are crucial aspects of individual well-being.
2.2. Quality of Life and the Financial Crisis in Europe
The economic crisis, which began in late 2007, had devastating effects on the economic systems in both EU member states and the rest of the world. The impacts of the crisis started to become apparent in 2010, and figures reported by Eurostat (2013) provided evidence of the extent to which the financial and economic crisis affected the European Union. As highlighted in the Europe 2020 strategy, “the crisis has wiped out years of economic and social progress”,
resulting in falling gross domestic product (GDP) and rising unemployment in many Member States.” It was also fairly clear that not all European countries suffered the negative
consequences of the crisis with the same intensity. In particular, a strong decrease in the gross domestic product (GDP), which was accompanied by an increase in unemployment, characterized the PIIGS (Portugal, Italy, Ireland, Greece, and Spain) countries, where the national debt crisis played a catalytic role in the consequences of the economic and financial crisis. Some of the new member states also suffered similar effects. The heterogeneity among countries regarding the effects of the economic crisis can also be explained by the different abilities of EU countries to adapt their national social policies to the rapid changes in the global economic situation. Taking this perspective, Eurofound (2014) conducted a meta-analysis of the economic literature on this topic, which led to the classification of European countries according to the flexibility of their national family policies with respect to the effects of the economic recession. Four groups of countries1 have been identified: most flexible; mixed, mainly flexible; mixed, mainly traditional; and most traditional. This classification is particularly relevant since it shows that the more flexible countries—characterized by a high female employment rate, a high rate of part-time work, good child-care provision, and generous leave and benefits—are also less vulnerable to the effects of the economic crisis. With this in mind, this classification can be considered to be a valuable tool for analyzing and interpreting changes in the levels of quality of life in European countries. Nevertheless, especially over the past decade, substantial concerns over performance, based only on current macroeconomic figures, are increasing, and several researchers agree that these indicators have to be
1 The EU member states are grouped as follows: “most flexible”: Belgium, Denmark, Finland, the Netherlands,
Sweden, and the UK; “mixed, mainly flexible”: Austria, Cyprus, Germany, France, Ireland, Luxembourg, Portugal, and Slovenia; “mixed, mainly traditional”: the Czech Republic, Hungary, Latvia, Malta, Poland, Romania, and Slovakia; and “most traditional (family-oriented)”: Bulgaria, Estonia, Greece, Spain, Croatia, Italy, and Lithuania.
complemented by supplementary indicators that reflect people’s QoL (see, e.g., Costanza et al., 2009, 2014; Maggino, 2016; Sabbadini and Maggino, 2018). Empirical evidence supports and stresses this multidimensional perspective in measuring the consequences of the economic crisis. Indeed, the economic crisis led to a deterioration in people’s QoL because it affected, at different magnitudes, individual aspects that constitute the multidimensional concept of quality of life (see, e.g., Suhrcke and Stuckler, 2012; Laparra and Pérez, 2012; OECD, 2013). In particular, Eurofound (2012) stressed that “the financial and economic crisis has led to
deterioration in living and working conditions, with significant negative impacts on the everyday lives of some citizens”. Eurofound (2014) showed that the economic crisis increased
inequality between countries and groups of people and identified the types of families with children that need to be targeted by policy makers in order to limit their vulnerability. The Organization for Economic Development and Cooperation (OECD, 2013) provided a comprehensive overview of the effects of the global economic and financial crisis by comparing the levels of many indicators of economic well-being (GDP, employment, health, social connection, etc.) in the pre- and post-crisis periods. Ivaldi et al. (2016) measured the effect of the crisis on people’s well-being. This aspect in particular has been thoroughly investigated by Somarriba Arechavala et al. (2015), who used a spatial approach to evaluate the relationship between the negative economic consequences of the crisis and the changes in the QoL in the EU. They used 31 variables, with data from the EQLS, Eurostat, and Eurobarometer, and analyzed the evolution of the QoL over the period from 2007-2011. Betti (2017) evaluated the net changes in the QoL that occurred over the period from 2007 to 2012.
3. Methodology
Since 2003, the EQLS has been conducted every four to five years to provide an accurate and comprehensive picture of the quality of life of people living in Europe. Indeed, this survey overcomes the definition of well-being mainly focused on economic aspects by using several variables that measure subjective well-being and individual perceptions of the quality of life. In this light, the survey can be considered a valid tool for measuring the multidimensional concept of the quality of life from a cross-sectional and dynamic perspective, respectively. In this paper, we use a subset of 30 European countries that participated in both the 2007 (34,634 observations) and 2012 (39,558 observations) EQLS cross-sectional waves. The 48 variables used in the empirical analysis are summarized in Table 1.
3.1. Multi-Dimensional and Fuzzy Approach to Quality of Life
We apply the statistical methodology proposed by Betti (2016) to study quality of life. The main feature of this approach is the assumption that “quality of life” is indeed a vague concept with different shades and degrees rather than an attribute that is simply present or absent for individuals in a society. Moreover, it has several aspects that provide a comprehensive understanding of human well-being. From a methodological point of view, this approach is strictly related to the statistical methodology known as latent variable models (Bartholomew and Knott, 1999). The main idea in this methodology is that the theoretical concept is not directly observable (quality of life); rather, it is latent (hidden), and the observed social indicators are partial/imperfect measures of this underlying theoretical concept. Beginning with the set of observed social indicators, which are grouped in the eight QoL dimensions (see Table 1), and a membership function with values in the interval [0,1], we define the dimensions of each quality of life (factor analysis is typically used to group indicators into dimensions). This function is a quantitative specification of the individual degrees of quality of life. Accordingly,
a membership function’s value is 0 for the lowest level of quality of life and 1 for the highest level. Membership function values between 0 and 1 indicate intermediate degrees of well-being. Because a membership function is defined for each quality of life dimension, for the sake of simplicity, let s (s = 1, …, S) be the sth dimension of quality of life in the set of S quality of life dimensions. We use ��� to indicate the membership function of each sth dimension. Each dimension s is composed of a different number of single indicators Ik (k = 1, …, Ks), as shown
in Table 1. Each single indicator Ik represents a transformation of the categories of each social
variable so that the categories of each item are converted into the interval [0,1]. Each membership function is calculated separately for each country i (i = 1, …, 30) and year (t = 2007, 2012). Therefore, let j (j = 1, …, ni) be the jth individual in country i. If ��� = , the
jth individual has the highest level of quality of life, whereas if ��� = , the jth individual has the lowest level of quality of life. Accordingly, as values increase from 0 to 1, the well-being of the jth individual for the corresponding dimension increases. Formally, in order to obtain ��� , a first aggregation over the set of single indicators in a particular dimension s is as follows:
��� = ∑ � � / ∑ � (1)
where � is the weight of the kth single indicator in the sth dimension computed as � = � ∗ � . The first factor is the coefficient of variation of Ikin dimension s, and the second
factor is a measure based on the correlations among indicator Ik and all the other indicators in
dimension s. This second factor gives less weight to single indicators more correlated with others, and in this way, it reduces the effects of redundancy and arbitrariness in the choice of the original indicators (Betti and Verma, 2008). A comprehensive measure of the QoL of each individual j in each country and year is obtained as the unweighted mean over the S dimensions of the dimension-specific ��� :
��� =∑ ��� �
� (2)
The (sample) weighted means (���̅̅̅̅̅ , s = 1,…,S and ���̅̅̅̅̅ ) of these individual values in equations (1) and (2) give the measures of the degree of quality of life observed at the country level in each dimension s and for all dimensions as a whole.
3.2. The Propensity Score Method: Inverse Probability of Treatment Weighting For each dimension s, we compare the distributions of the membership function ��� (s = 1, ...,8) between populations at two distinct periods: individuals not affected by the crisis (2007) and individuals who were affected by it (2012). Because these two populations are different, appropriate methodologies are needed to isolate the impact of the crisis on the multidimensional quality of life indicators. The PSM improves the comparability of the two populations by using observed characteristics (named confounders) to reduce the bias in measuring the effect estimates (Rosenbaum and Rubin, 1983). As already noted, the two survey waves (EQLS data in 2007 and 2012) are independent, and thus we need to adjust for this in our analysis. The PSM we applied is the so-called inverse probability of treatment weighting (IPTW) (Lunceford and Davidian 2004; Sato and Matsuyama, 2003). Empirically, the average treatment effect (ATE) has been estimated as follows. Each individual j can be described by a vector (��� , , � , ) consisting of the membership function ��� , vector X of individual characteristics and treatment T, where = 1 if j is in the treated group (year = 2012) and = if j is in the control group (year = 2007). A simple definition of the ATE can be written as follows:
� � = �(��� , | = , ) − �(��� , | = , ), � = � … (3)
where E(.) represents the expectation in the population and ��� , and ��� , represent the membership functions in 2012 and 2007, respectively. Therefore, ATEs is the average effect of
dimension s that would have been observed if everyone in the treated and control groups received the treatment, compared with the situation in which no one in either group received the treatment (Harder, Stuart, and Anthony, 2010). In the empirical analysis, equation (3) has been computed for each dimension s and the total index in each country i. In the literature, the propensity score can be defined as the probability of assignment to the treatment (year = 2012), conditional on a vector of observed covariates X, which is written as P(T=1|X=x). Conditional on the propensity score, the distribution of the observed covariates is the same for T = 1 and T = 0, and as proposed by Rubin (1997), it approximates the randomization of individuals to these groups. In this way, the estimated propensity score �̂ is the predicted probability under a � � logit model. The weighting system, which is based on the predicted score, is able to balance the distributions of the QoL indicators in 2007 and 2012 (i.e., it changes the distribution of the confounders in both the treated and untreated subjects) so that they are the same as the distribution in the entire sample (Rosenbaum, 1987). To estimate the ATE, each unit in the treatment group (T = 1) is weighted by the factor /�̂ � , while each unit in the control � � group (T = 0) is weighted by � / − �̂ , where � is the survey weight. The jackknife � � repeated replication (JRR) has been used to account for the sampling variability and assess the statistical significance of ATEs computed using equation (3). The propensity score has been
calculated for each individual in the treated (year = 2012) and the comparison group (year = 2007) samples using a standard logit model. Different practices have been adopted to choose a suitable specification of this model in each country (DuGoff et al., 2014). The underlying principle has been to include the logit regression variables2 that are not influenced by the treatment in order to meet the conditional independence assumption (CIA). Common support or overlap conditions have been graphically checked in each country. Under the common support hypothesis, covariate distributions should not be different between the two rounds of data. In countries that had regions with overlapping support, we restricted our analysis to subjects with “common support.” Moreover, a Hosmer–Lemeshow test was performed to check the goodness of fit of the logistic regression for each country. The null hypothesis of a good fit was accepted in each country at a 5% significance level. Finally, we checked the balance between the treated and untreated subjects after weighting. We found that both sets of weights markedly improved the balance of all covariates3.
4. Results
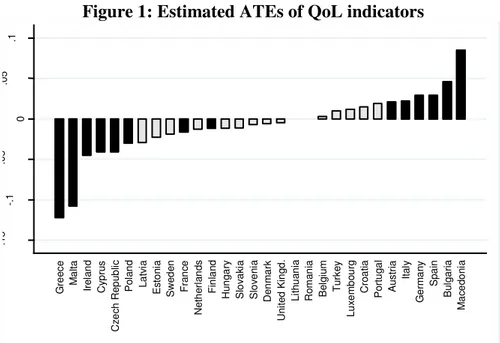
We observed significant differences between 2007 and 2012 in the overall QoL fuzzy indicator in only 16 out of 30 countries after adjusting for the comparability of the two populations. The obtained results are consistent with those in Betti (2017) and are more accurate because they truly represent the impacts of the economic crisis. Our findings suggest that the strength of the negative effect of the crisis was very high in Greece, Malta, Ireland, Cyprus, the Czech Republic, and Poland (see Figure 1).
2 Table A1 summarizes the variables used.
Figure 1: Estimated ATEs of QoL indicators
When we extended the analyses by looking at the impact of the crisis according to each different dimension, our results in Table 2 show that in five out of eight dimensions, Greece is at the top of the negative ranking (the results from all countries and fuzzy indicators are given in Appendix Table A2).
Table II: Top three countries with negative and positive variations of the quality of life index
Quality dimension Countries with greater
significant negative changes
Countries with greater significant positive changes
QUALITY OF RELATIONS FS1 Cyprus Turkey Malta Luxembourg Macedonia (FYROM) Italy TRUST IN PEOPLE AND
INSTITUTIONS FS2 Greece Romania Slovakia Germany ACCESS TO SERVICES FS3 Greece Malta Poland Portugal SPAIN Macedonia (FYROM) QUALITY OF PUBLIC SERVICES FS4 Malta Poland Estonia Turkey Cyprus Macedonia (FYROM) SUBJECTIVE WELL-BEING FS5 Malta Greece Cyprus Austria Bulgaria Macedonia (FYROM) HOUSING QUALITY FS6 Czech Republic Malta Latvia Lithuania Romania Macedonia (FYROM) STANDARD OF LIVING FS7 Greece Cyprus Lithuania Macedonia (FYROM) Turkey HEALTH FS8 Greece Czech Republic Ireland Austria Bulgaria Latvia
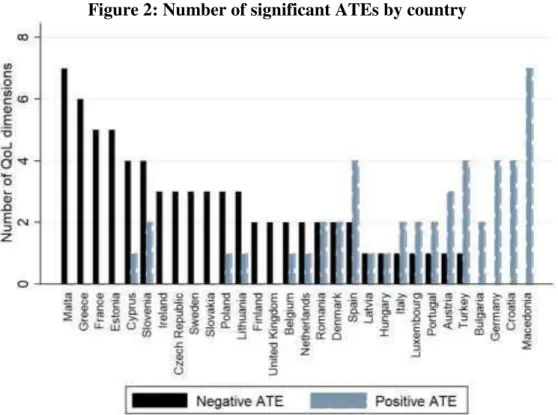
People lost trust in people and institutions, in access to services, in subjective well-being, in their standard of living, and in health. Overall, among the EU-30 countries (see Figure 2), Malta
-. 1 5 -. 1 -. 0 5 0 .0 5 .1 G re e c e M a lt a Ire la n d Cy p ru s Cz e c h Re p u b lic P o la n d L a tv ia E s to n ia S we d e n F ra n c e Ne th e rl a n d s F in la n d Hu n g a ry S lo v a k ia S lo v e n ia De n m a rk Un it e d K in g d . L it h u a n ia Ro m a n ia B e lg iu m T u rk e y L u x e m b o u rg Cro a ti a P o rt u g a l A u s tri a It a ly G e rm a n y S p a in B u lg a ri a M a c e d o n ia
had the worst performance, followed by Estonia and France. Here, significantly negative ATEs range from 5 to 7. By contrast, Croatia and Turkey had the best performance. They achieved improvements in approximately half the subdimensions of the overall QoL index.
Figure 2: Number of significant ATEs by country
Macedonia deserves particular attention. It significantly improved on almost all QoL dimensions, and no dimensions experienced a statistically significant and negative ATE variation. In addition, in many countries, the effect of the crisis on QoL was less intense both because the number of dimensions that significantly worsened is small and because in many countries decreases in some aspects are offset by increases in others. Using the Eurofound classification of EU countries, which was described in the section 2.2, we can reach some interesting conclusions. The most flexible countries (Belgium, Denmark, Finland, the Netherlands, Sweden, and the UK) seem to be very homogeneous; indeed, they have average negative changes in two out of eight dimensions. The mixed, mainly flexible countries (Austria, Cyprus, Germany, France, Ireland, Luxembourg, Portugal, and Slovenia), on the contrary, can be grouped into two main sets. France, Ireland, and Slovenia faced significant deterioration in more than three dimensions of QoL whereas the other countries improved over the period. The mixed, mainly traditional countries (the Czech Republic, Hungary, Latvia, Malta, Poland, Romania, and Slovakia), with the exception of Hungary and Latvia, generally were negatively affected by the financial crisis in many dimensions. Finally, the most traditional (family-orientated) countries, such as Bulgaria, Estonia, Greece, Spain, Croatia, Italy, and Lithuania, made up a very heterogeneous group despite having similar welfare states. Looking at the results from another perspective, we can draw equally important conclusions. Figure 3 reports
the radar charts for each QoL dimension and the signs of the observed changes. The effects of the crisis seem quite heterogeneous with respect to both country and the type of dimension observed. Some dimensions have significantly decreased for many countries, while for others, the variations have been positive, albeit to a smaller extent. In particular, for the majority of the countries (over 63%), a significant decrease is seen in the dimension "trust in people and institutions," probably because citizens hold the governments and their institutions responsible for the crisis. Similarly, the "standard of living" dimension has significantly decreased in almost
50% of the countries, probably because this is the dimension most directly related to the economic and financial conditions of households and is therefore more “sensitive” to the recession period.
Figure 3: Radar charts reporting QoL dimensions for negative and positive ATE
Negative ATE Positive ATE
However, in nine countries, the dimension “quality of relations” has significantly increased, perhaps because the crisis has led people to focus more on social and emotional ties rather than on the consumption of goods and services. To investigate further, we decided to focus on whether the changes in QoL over time in a crisis can be understood in relation to the changes in growth. To simplify the results, we focus only on the overall QoL indicator. A positive association was found between the overall estimated ATE, namely, the ATE was related to the overall QoL fuzzy indicator and the percentage of variation in GDP over the period 2007-2012 in Europe, as shown in Figure 4.
Figure 4: Change in the overall fuzzy indicator of quality of life and GDP over the period 2007-2012.
Qol1: Quality of relations
Qol2: Trust in people and institutions
Qol3: Access to services
Qol4: Quality of public services
Qol5: Subjective well-being Qol6: Housing quality
Qol7: Standard of living Qol8: Health 4 8 12 16 20
Qol1: Quality of relations
Qol2: Trust in people and institutions
Qol3: Access to services
Qol4: Quality of public services
Qol5: Subjective well-being Qol6: Housing quality
Qol7: Standard of living Qol8: Health
4
8
The estimated coefficient of correlation is 0.36. Figure 4 shows a cluster of countries in which the economic recession caused the QoL of their citizens to decline over the same period. The most negative ATE in Greece shows the disastrous consequences of the economic crisis there. Therefore, Greece is an outlier in this cluster, which is otherwise characterized by very homogeneous behavior in the other countries. All these countries had economic growth from 2007 to 2012, and the quality of life also improved. Macedonia and Bulgaria can be considered examples of relatively poorer societies in which growth leads to an enhanced QoL. The pattern observed in Poland and Malta confirms the shift in the paradigm from the expansion of wealth—of which GDP is a symbol—to sustainably maintaining QoL. These two countries experienced positive economic growth, so their QoL decreased. A large part of the responsibility for this seems to be due to a depletion of access to services and the quality of public services in Poland, whereas in Malta, more dimensions contributed to this result, such as a decline in the quality of relations and in housing quality. Finally, the results in Italy and Spain are very interesting. Although both countries faced a sharp downturn because of the financial crisis, the QoL of their citizens does not appear to have decreased over time.
5. Conclusion
The main findings highlight the heterogeneous impacts of the economic crisis on the QoL of European countries. In particular, by analyzing the QoL fuzzy indicator at the European level, we highlighted that the impacts of the crisis were very high, especially in Greece and Malta, because they have the most significant negative changes in their estimated ATEs. This pattern at the aggregate level above calls for recognition that the Greek and Cypriot sovereign debt crisis and the implications of the Cypriot sovereign debt crisis on Malta affected the quality of life of their citizens. We found the opposite result in Macedonia, where the QoL seems to have improved after the crisis. This result can probably be explained by the short-lived impact of the economic recession in the country that started at the end of 2008; fortunately, modest growth of 0.7% was achieved by 2010 (Nenovski and Smilkovski, 2012). Nevertheless, further investigations are needed to obtain a more accurate understanding of these findings. The analysis continues with a discussion of the findings based on the scatterplots used as an exploratory method to study, from a descriptive point of view, the degree of association between the estimated ATEs (based on the overall index of QoL) and contextual factors. The contextual factor was operationalized here in the form of the percentage of variation in per-capita GDP from 2007 to 2012. From this perspective, we provided a first look at these bivariate data, in which we identified clusters of points and outliers. Even if this part is based on ATEs that showed significant differences between the two periods, we can draw interesting conclusions. We found a modest correlation between QoL and GDP growth. This modest correlation is probably mainly due to the different starting levels of QoL in 2007 and the consequent different expectation in 2012. The great increase in Macedonia and the significant reduction in Malta are surely evident examples. Another strong—although expected—result of the analysis is the great reduction in trust in institutions and subjective well-being over the economic crisis, confirming the positive relationship between these two dimensions, as was also stressed in recent empirical analyses in Europe, such as D’Agostino et al. (2018). This paper makes two contributions to the literature. We addressed the current gap in the literature by providing a comprehensive picture of QoL in Europe that takes into account the peculiarity of the concept. In so doing, we have also conducted a PSM to attempt to measure the effect of the crisis over the period, which is in contrast to earlier studies that measured the net change. From this point of view, although the PSM provides several improvements to the assessment of this net change, it is not without limitations. Thus, last, but not least, this analysis should be seen as a preliminary research with
limited data for causal analysis in its strict sense. Namely, we correct for the fact that demographically different people were surveyed in these two waves, but it is also important to note that we can only partially attribute all these changes to the economic crisis because other factors could have impacted the results as well. Indeed, underlying and ongoing societal changes (e.g., pension, fiscal or health reforms), although not necessarily correlated with the perceived quality of life, may have affected the correct measurement of this net effect in some countries. In addition, we might hypothesize that the crisis was certainly a crucial factor affecting QoL in this five-year period and check the robustness of our assumption in a future research analysis by comparing the QoL in Europe from 2012 to 2016 using the new EQLS. Nevertheless, we hope that this analysis consolidates and extends the knowledge on methodological developments in this area and inspires policy makers to continue to monitor QoL, which is a crucial aspect of social sustainability, in the future.
References
Bartholomew, D.J., and Knott, M. (1999) Latent Variable Models and Factor Analysis, 2nd ed. New York: Edward Arnold.
Betti, G. (2016) “Fuzzy measures of quality of life: a multidimensional and comparative approach” International Journal of Uncertainty, Fuzziness and Knowledge-Based Systems, 24, Suppl. 1, pp. 25-37.
Betti, G. (2017) “What impact has the economic crisis had on quality of life in Europe? A multidimensional and fuzzy approach”Quality and Quantity, 51(1), pp. 351-364.
Betti, G., Soldi, R., and Talev, I. (2016) “Fuzzy multidimensional indicators of quality of life: The empirical case of Macedonia” Social Indicators Research, 127(1), pp. 39-53.
Betti, G., and Verma, V. (2008) “Fuzzy measures of the incidence of relative poverty and deprivation: A multi-dimensional perspective” Statistical Methods and Applications, 12(2), pp. 225-250.
Bjørnskov, C. (2008) “Social capital and happiness in the United States” Applied Research
Quality Life, 3(1), pp. 43-62.
Costanza, R., Hart, M., Posner, S., and Talberth, J. (2009) Beyond GDP: The Need for New
Measures of Progress. Boston: Boston University Press.
Costanza, R., Kubiszewski, I. Giovannini, E., Lovins, H., McGlade, J., Pickett, K.E., Ragnarsdóttir, K.V., Roberts, D., De Vogli, R., and Wilkinson, R. (2014) “Development: Time to leave GDP behind” Nature, 505, pp. 283–285.
D’Agostino, A., Grilli, G., and Regoli, A. (2018) “The determinants of subjective well-being of young adults in Europe” Applied Research Quality Life, 14, pp. 85–112.
Dolan, P., and Metcalfe, R. (2012) “Measuring subjective well-being: Recommendations on measures for use by national governments” Journal of Social Policy, 41(2), pp. 409–427. DuGoff, E. H., Schuler, M., and Stuart, E. A. (2014) “Generalizing observational study results:
Applying propensity score methods to complex surveys” Health Services Research Journal, 49, pp. 284–303.
Eurofound (2003) Monitoring quality of life in Europe. Office for Official Publications of the European Communities, Luxembourg.
Eurofound (2010) Subjective well-being in Europe. Luxembourg: Office for Official Publications of the European Communities.
Eurofound (2012) Third European Quality of Life Survey—Quality of life in Europe: Impacts of the crisis, Publications Office of the European Union, Luxembourg.
Eurofound (2014) Third European Quality of Life Survey—Quality of life in Europe: Families in the economic crisis, Publications Office of the European Union, Luxembourg.
Glatzer W. (2006) “Quality of Life in the European Union and the United States of America: Evidence from Comprehensive Indices” Applied Research in Quality of Life, 1(2), pp 169– 188.
Harder, V. S., Stuart, E. A., and Anthony, J. C. (2010) “Propensity score techniques and the assessment of measured covariate balance to test causal associations in psychological research” Psychological Methods, 15, pp. 234-249
Helliwell, J.F. (2006) “Well-being, social capital and public policy: What's new?” Economic
Journal, 116(510), C34-C45.
Helliwell, J.F., and Putnam, R.D. (2004) “The social context of well-being” Philosophical
Transactions of the Royal Society B, 359, pp. 1435-1446.
Ivaldi, E., Bonatti, G., and Soliani, R. (2016) “The construction of a synthetic index comparing multidimensional well-being in the European Union” Social Indicators Research, 125(2), pp. 397-430.
Laparra, M., and Pérez, B. (2012) “Crisis and Social Fracture in Europe: Causes and Effects in Spain” Social Studies Collection no. 35, Barcelona: “La Caixa” Welfare Projects.
Lunceford, J. K., and Davidian, M. (2004) “Stratification and weighting via the propensity score in estimation of causal treatment effects: A comparative study” Statistics in Medicine, 23(19), pp. 2937–60.
Maggino, F. (2016) A Life Devoted to Quality of Life. Festschrift in Honor of Alex C. Michalos, Switzerland: Springer International.
Mauro, V., Biggeri, M. and Maggino, F. (2018) “Measuring and monitoring poverty and well-being: A new approach for the synthesis of multidimensionality” Social Indicators Research, 135(1), pp. 75-89.
Meiselman, H.L. (2016) “Quality of life, well-being and wellness: Measuring subjective health for foods and other products” Food Quality and Preference, 54, pp. 101-109
Moons, P., Budts, W. and De Geest, S. (2006) “Critique on the conceptualization of quality of life: A review and evaluation of different conceptual approaches” International Journal of
Nursing Studies, 43, pp. 891–901.
Nenovski, T. and Smilkovski, I. (2012) “Macedonian economy before and after the global financial and economic crises” Procedia: Social and Behavioral Sciences, 44, pp. 417—427 Nussbaum, M., and Sen, A. (eds.), (1993) The Quality of Life, Oxford University Press, Oxford. OECD (2013), How’s Life? 2013 Measuring Well-being, OECD, Paris.
Phillips, D. (2006) Quality of Life: Concept, Quality, Practice, Routledge, London.
Pinto, S., Caldeira, S. and Martins, J. (2016) “A systematic literature review towards the characterization of comfort” Holistic Nursing Practice, 30, pp. 14–24.
Rosenbaum, P. R., and Rubin, D. (1983) “The central role of the propensity score in observational studies for causal effects” Biometrika, 70(1), pp. 41-55.
Rosenbaum, P. R. (1987) “Model-based direct adjustment” Journal of the American Statistical
Association, 82, pp. 387–394.
Rubin, D. (1997) “Estimating causal effects from large data sets using propensity scores”
Annals of Internal Medicine, 127, pp. 757-763.
Sabbadini, L.L., and Maggino, F. (2018) “Quality of life in Italian official surveys” Social
Indicators Research, 135(3), pp. 1043-1055.
Sato, T., and Matsuyama, Y. (2003) “Marginal structural models as a tool for standardization”
Epidemiology 14, pp. 680–686.
Shek D.T.L. and Lee B.M. (2007) “A Comprehensive Review of Quality of Life (QOL) Research in Hong Kong” The Scientific World JOURNAL, 7, 1222–1229
Somarriba Arechavala, N., Zarzosa Espina, P., and Pena Trapero, B. (2015) “The economic crisis and its effects on the quality of life in the European Union” Social Indicators Research, 120(2), pp. 323-343.
Suhrcke, M., and Stuckler, D. (2012) “Will the recession be bad for our health? It depends”
Appendix
Table A-I: Variables used for propensity score matching
Label Variable abbreviation
Variable in EQLS integrated dataset (2007 and 2012) Description Education level prim_educ Y11_Education 1=primary level 0=otherwise
tert_educ 1=tertiary level
0=otherwise Gender of the
respondent female Y11_HH2a
0=male 1=female
Marital status nopartner Y11_Q31
0=married or living with partner 1=otherwise (separated, widowed, no
partner)
Number of childrens nochild Y11_Q32 1=no children 0=otherwise
Household size (incl.
children) family4 Y11_HHsize
1=4 or more person household 0=otherwise
Age of the
respondent age Y11_HH2b age
Citenzship immigrate Y11_Q67_1/Y07_Q69 1=immigrate 0=native Area in which the
respondent lives vill_country Y11_Q49
1=village or country 0=otherwise
Table A-II: ATE estimates in fuzzy indicators of Quality of Life, EQLS 2007–2012
(Bootstrap std. error in parenthesis)
Country QoL overall indicator Qol1: Quality of relations Qol2: Trust in people and institutions Qol3: Access to services Qol4: Quality of public services Qol5: Subjective well-being Qol6: Housing quality Qol7: Standard of living Qol8: Health Austria 0.021** (0.009) (0.015) 0.010 -0.035** (0.016) 0.058*** (0.014) (0.014) 0.017 0.067*** (0.012) (0.014) -0.003 (0.018) 0.014 0.048*** (0.01) Belgium (0.007) 0.003 (0.018) -0.006 -0.043*** (0.011) 0.033** (0.013) -0.021** (0.01) -0.013* (0.007) -0.016 (0.01) (0.014) 0.004 (0.011) -0.013 Bulgaria 0.046** (0.021) 0.036 (0.025) 0.024 (0.017) 0.028 (0.02) 0.013 (0.017) 0.074*** (0.015) 0.007 (0.018) 0.015 (0.023) 0.049*** (0.014) Croatia (0.012) 0.015 (0.02) 0.022 (0.014) -0.008 0.048** (0.019) 0.041*** (0.014) 0.037*** (0.012) 0.029*** (0.01) (0.023) -0.037 (0.013) 0.015 Cyprus -0.041*** (0.013) -0.122*** (0.025) -0.113*** (0.014) (0.021) 0.028 0.083*** (0.02) -0.054*** (0.015) (0.017) -0.005 -0.121*** (0.026) (0.017) -0.018 Czech Republic -0.041** (0.018) -0.046 (0.033) -0.005 (0.024) 0.000 (0.038) -0.025 (0.027) -0.037* (0.021) -0.061*** (0.016) -0.084*** (0.026) -0.078*** (0.016) Denmark -0.006 (0.01) 0.063*** (0.019) -0.052*** (0.012) 0.005 (0.011) -0.010 (0.015) -0.004 (0.01) 0.033** (0.013) -0.035** (0.015) -0.008 (0.009) Estonia (0.014) -0.023 0.032* (0.017) -0.044*** (0.012) -0.044*** (0.015) -0.082*** (0.013) -0.051*** (0.013) (0.021) 0.023 -0.061*** (0.019) (0.015) -0.016 Finland -0.012** (0.005) 0.018 (0.011) -0.044*** (0.007) -0.006 (0.012) -0.038*** (0.009) -0.006 (0.006) -0.001 (0.012) -0.004 (0.015) -0.008 (0.01) France -0.016*** (0.006) (0.009) 0.011 -0.053*** (0.007) -0.025*** (0.009) -0.030*** (0.007) -0.029*** (0.006) (0.009) -0.006 -0.028*** (0.009) (0.008) -0.01 Germany 0.029*** (0.006) 0.086*** (0.011) 0.028** (0.011) (0.01) 0.000 0.070*** (0.009) (0.008) 0.001 -0.016* (0.008) (0.012) 0.014 0.018** (0.009) Greece -0.122*** (0.016) -0.048** (0.022) -0.174*** (0.011) -0.182*** (0.028) -0.031* (0.015) -0.062*** (0.013) -0.02 (0.018) -0.148*** (0.021) -0.125*** (0.013) Hungary (0.015) -0.012 (0.024) 0.000 (0.018) -0.019 (0.024) 0.038 -0.016 (0.02) (0.012) 0.001 0.033** (0.016) -0.051** (0.024) (0.014) -0.007 Ireland -0.045*** (0.015) (0.028) 0.017 -0.102*** (0.018) (0.018) -0.013 (0.022) -0.006 (0.011) -0.005 (0.012) 0.006 -0.093*** (0.02) -0.041*** (0.015) Italy 0.022** (0.009) 0.102*** (0.016) -0.058*** (0.010) 0.068*** (0.017) -0.003 (0.013) 0.005 (0.008) -0.005 (0.01) 0.015 (0.015) 0.005 (0.009) Latvia (0.022) -0.029 (0.035) 0.039 (0.019) 0.001 (0.026) 0.041 (0.024) 0.027 (0.014) 0.004 -0.038* (0.021) -0.083** (0.033) 0.066*** (0.019) Lithuania (0.033) 0.000 (0.024) 0.033 -0.092*** (0.023) (0.03) 0.012 -0.057** (0.027) (0.033) 0.012 0.052** (0.024) -0.100*** (0.029) (0.024) -0.009 Luxembourg 0.012 (0.011) 0.092*** (0.017) 0.012 (0.011) 0.012 (0.01) 0.032** (0.012) -0.04*** (0.009) 0.01 (0.015) -0.006 (0.014) -0.006 (0.011) Macedonia (FYROM) 0.085*** (0.017) 0.097*** (0.03) 0.016 (0.019) 0.116*** (0.024) 0.132*** (0.023) 0.096*** (0.019) 0.056*** (0.02) 0.051** (0.02) 0.037** (0.018) Malta -0.108*** (0.015) -0.049** (0.022) -0.066*** (0.016) -0.087*** (0.022) -0.096*** (0.012) -0.073*** (0.013) -0.057*** (0.014) -0.087*** (0.024) (0.009) -0.007 Netherlands -0.013* (0.007) 0.045*** (0.011) -0.031*** (0.006) (0.009) 0.002 (0.008) 0.002 (0.006) -0.006 (0.014) 0.001 (0.012) -0.013 -0.036*** (0.008) Poland -0.03*** (0.009) 0.008 (0.013) -0.02** (0.01) -0.051*** (0.014) -0.084*** (0.011) -0.013 (0.008) 0.023** (0.009) -0.003 (0.016) 0.009 (0.011) Portugal 0.019 (0.015) 0.02 (0.024) -0.073*** (0.011) 0.085*** (0.02) 0.049*** (0.013) 0.002 (0.014) 0.017 (0.016) -0.028 (0.025) -0.007 (0.011) Romania (0.016) 0.000 (0.024) -0.030 -0.125*** (0.014) (0.019) 0.035* -0.048*** (0.016) 0.054*** (0.009) 0.055** (0.021) (0.023) 0.023 (0.01) 0.002 Slovakia -0.011 (0.012) 0.014 (0.019) -0.118*** (0.013) -0.016 (0.023) -0.08*** (0.014) -0.012 (0.012) 0.022* (0.012) -0.019 (0.025) -0.034*** (0.012) Slovenia -0.007 (0.01) 0.031** (0.014) -0.079*** (0.009) (0.019) 0.025 (0.013) -0.020 -0.021*** (0.008) 0.043*** (0.011) -0.039** (0.016) -0.036*** (0.011) Spain 0.029*** (0.01) 0.085*** (0.019) -0.097*** (0.012) 0.112*** (0.012) 0.037*** (0.011) -0.004 (0.01) 0.033** (0.016) -0.07*** (0.015) -0.017* (0.009) Sweden -0.019* (0.01) 0.003 (0.03) -0.022 (0.017) 0.02 (0.015) -0.035** (0.013) -0.023** (0.011) 0.000 (0.013) -0.028 (0.022) -0.038*** (0.014) Turkey (0.014) 0.010 -0.053*** (0.02) (0.012) -0.017 (0.018) -0.001 0.082** (0.017) 0.039*** (0.012) (0.017) 0.004 0.072*** (0.02) 0.048*** (0.009) UK -0.005 (0.01) (0.012) 0.016 (0.009) -0.001 (0.009) 0.000 (0.012) 0.017 -0.013* (0.008) -0.013 (0.01) -0.038*** (0.014) -0.021*** (0.007)