Equity in healthcare financing in Italy
Facoltà di Economia
XXXI Edition PhD in Economics
Dr. Domenico De Matteis
Supervisor
Co-Advisor
3
Summary
EXECUTIVE SUMMARY ... 5
INTRODUCTION ... 5
REFERENCES ... 15
VERTICAL EQUITY IN HEALTHCARE FINANCING: A SYSTEMATIC REVIEW OF METHODS AND EVIDENCE ... 19
1.
INTRODUCTION ... 20
2.
METHODS ... 20
3.
RESULTS ... 24
3.1 Methods for measuring vertical equity in health ... 28
3.2 Evidence on vertical equity in OECD countries ... 29
3.3 Evidence for the Non-OECD countries ... 32
4.
DISCUSSION ... 36
5.
CONCLUSIONS ... 37
REFERENCES ... 38
APPENDIX 1–MEASURING VERTICAL EQUITY WITH THE KAKWANI PROGRESSIVITY INDEX ... 44
APPENDIX 2–THE SEARCH STRATEGY KEYWORDS. ... 47
VERTICAL EQUITY IN HEALTHCARE FINANCING IN ITALIAN REGIONS ... 50
1.
INTRODUCTION ... 51
2.
SOURCES OF HEALTHCARE FINANCING ITALY ... 52
3.
DATA AND METHODOLOGY ... 54
4.
RESULTS ... 60
5.
DISCUSSION ... 65
REFERENCES ... 67
APPENDIX 1–KAKWANI INDEXES USING TOTAL CONSUMPTION AS A PROXY FOR ABILITY TO PAY ... 70
INEQUALITY OF ACCESS TO ITALIAN PUBLIC HEALTH ANALYSED WITH THE HIERARCHY STOCHASTIC MULTIOBJECTIVE ACCEPTABILITY ANALYSIS ... 73
1.
INTRODUCTION* ... 74
2.
THE REASONS FOR CO-PAYMENT, THE ISSUES OF HEALTH INEQUALITY, AND THE NEED FOR A MULTI -CRITERIA APPROACH ... 75
2.1 Co-payment ... 75
2.2 The Italian co-payments system ... 76
2.3 Health inequality definitions ... 76
2.4 Measuring access ... 77
2.5 Measuring inequality ... 78
3.
THE DATA ... 79
4.
METHODOLOGY ... 80
5.
RESULTS ... 84
6.
POLICY IMPLICATIONS ... 87
7.
CONCLUSIONS ... 88
REFERENCES ... 90
LISTOFABBREVATIONS ... 95
AKNOWLEDGEMENTS ... 96
5
EXECUTIVE SUMMARY
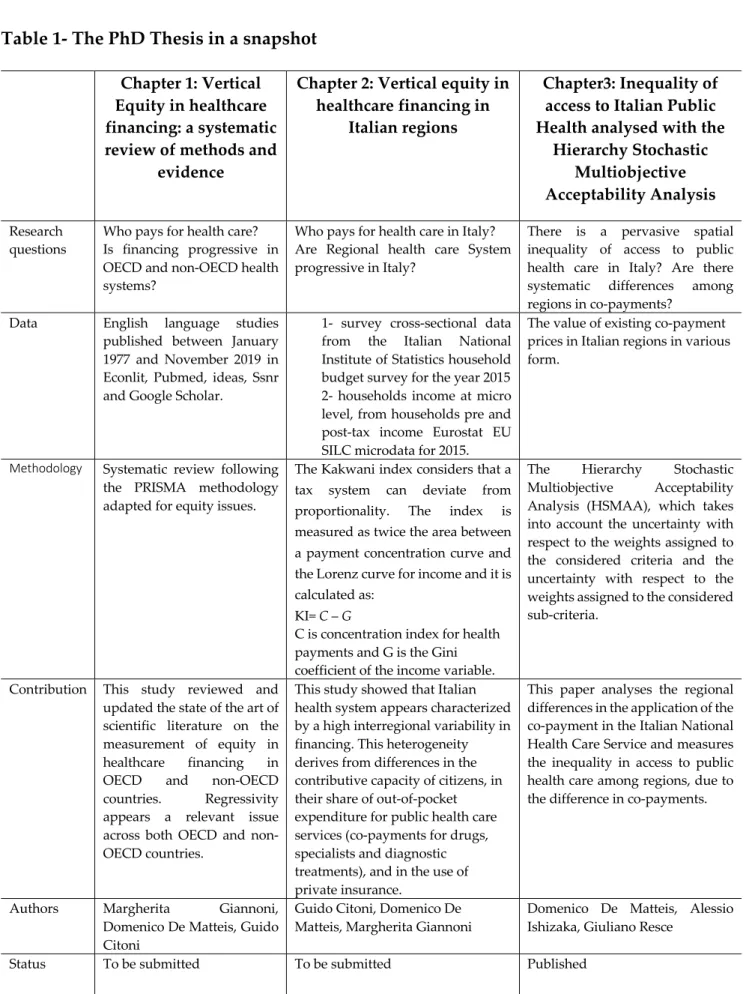
This Ph.D. dissertation discusses equity in healthcare financing in Italy. Each of the three chapters of this dissertation constitutes an independent research output, answering stand-alone research questions. Chapter 1 is a systematic review on equity in healthcare financing in OECD and non-OECD countries. This deals both with the methodology used and the evidence around the world on vertical equity in healthcare financing. Chapters 2 and 3 report empirical evidence from Italy. Chapter 2 analyses the progressivity of healthcare financing in the Italian system and focuses on Italian regions, performing a comparison of progressivity of the healthcare financing across regional systems. Chapter 3 provides an assessment of how differences in co-payments between the Italian regions contribute to growing inequalities in access to public health care services in Italy. A common ground among chapters is the measurement of equity and inequalities in health financing, with particular reference to differences among the Italian regions.
INTRODUCTION
The regionalization of the Italian Health Care System (SSN- Servizio Sanitario Nazionale) dates back to the beginning of this century. The aims of the reform, adopted under pressure from political parties representing the Northern, more economically advanced regions, were both to improve the efficiency of public spending in health care and to obtain a better representation of specific needs and preferences of citizens, due to commitment of regional political bodies to territorial specificities. Though, any regional autonomy brings with it the risk of widening differences between Italian citizens, both in quantity and quality of care received, and in the resources needed to finance essential levels of care. A concern for equity has lagged for long, mainly because the reform was coupled in the first years with a soft budget constraint, allowing each region to increase the amount of resources available for their regional health services. After the 2008 global financial crisis, problems increased tremendously, because resources were reduced in real terms (and in some years, even financially) the burden of financing health care shifted to private resources either in the out-of-pocket form or through a growing sector of supplementary funds, strongly encouraged by central political bodies, but unevenly distributed in the regions, and mainly financed by firms, whose location was almost entirely concentrated in northern regions.
This work stems from the desire of assessing the relevance of income-related inequalities among Italian citizens with respect to specific health care equity issues of the SSN. In order to evaluate if a health care system is equitable, several types of inequities could be measured each referring to different equity concepts (Wagstaff and van Doorslaer [27]; Fleurbaey and Schokkaert [7]). A widely used approach measures income-related inequities in health care access (or use), inequities in healthcare financing and, ultimately inequities in health status [27]. The mainstream public economics literature focuses on the concept of horizontal equity when dealing with access/use of
health care services (ibid.). This would imply that individual citizens with the same needs should receive the same amount of care, i.e. irrespective of their socioeconomic status, particularly their ability to pay for such services [27]. This implies verifying if there are, e.g., for any given type of health care service, unacceptable differences based on income, or on education race, area of residence, sexual orientation or on other individual characteristics that could be considered as unacceptable sources of inequalities in services access or use. The evidence for Italy is mainly focused on the measurement of income-related horizontal inequities in health care use and access [9] and on the socioeconomic determinants of inequalities in health, particularly at the regional level [22]. Newly, this thesis deals with the less explored issue for Italy of measuring vertical inequities in financing. The underlined inequity concept is intended as the violation of the vertical equity principle of paying more for health care the richer you are, i.e., the higher the ability to pay for that [12],[27],[18]. We will refer therefore to this concept derived from the public economics literature. In our case, the aim will be to measure if the inhabitants of different Italian regions face the same pattern of progressivity/ regressivity in financing costs, both private (voluntary choices) and public (compulsory financing). The mainstream approach in the measurement of vertical inequities in health system financing is to use an index of progressivity, the Kakwani index1. By using such index
in assessing the progressivity of healthcare financing in different regions, significant differences emerged, though probably not so wide as in health care utilization. Sometimes it is a matter of decimals, preserving the sign of the index for a specific source of financing in all the regions, other times we have a change in sign, implying a shift from progressivity to regressivity and vice versa, other times our assessment is rather tentative or cannot be subject to an easy interpretation. The last is mostly true when we have to deal with pocket payments or co-payments. In fact, out-of-pocket expenditure, if progressive, implies not only higher payments for the rich but also more utilization, while progressivity in public sources of financing is mostly independent from the use of services. A suitable concept, then, could be to assess the net benefit progressivity, i.e. if the difference between benefits and payments shows any definite pattern, correlated with the ability to pay. As data on health care services' benefits were not available this method could not be applied. Nonetheless, an effort was made to analyse another aspect of financing, closely related to the concept of catastrophic payments: the fact that having to pay high co-payments prevents needed consumption of services, acting as a barrier to access.
We know that, in economic theory, the rationale for co-payments is that they are the most effective way to fight ex-post moral hazard, though if they are used mainly as a source to raise money in an undifferentiated way, without taking account users' ability to pay and without using the tool of exemptions, they can affect the use of services when needed, fostering higher expenditures in the future.
1Other approaches may be used to measure vertical equity in health financing as, e.g., those derived from the health
7
In Italy, along with regionalisation, there has been a devolution of governance on public co-payments (tickets) to regions. At the end of the past century, a political cycle was clear looking at the use of co-payments' rebates before national polls (and new increases afterwards). In the new century, the evidence is not clear-cut, as increases in co-payments (supertickets) are often associated with regional financial crises and to deficit reduction plans (piani di rientro). The amount and distribution of co-payments was then very scattered between regions, becoming a source of big differences in access, and a territorial bias is expected, as they were heavily concentrated in Southern regions.
In the last part of the research, the differences between regions in access to services were measured. It was found that our country, although equipped with a theoretically universal and egalitarian public system, does show forms of socio-economic inequalities in access to health services.
The first paper to be submitted to Applied Health Economics and Health Policy with M. Giannoni and G. Citoni co-authoring, is a systematic review of the international evidence on the measurement of equity in healthcare financing, i.e. of vertical equity. We refer to the vertical equity concept as above mentioned. There is increasing evidence showing inequities in healthcare financing [27],[7],[22]. However, there is a lack of updated studies systematically reviewing evidence on this topic by looking at both OECD and non-OECD countries. The main aims are: 1) to identify the main methods used; 2) to draw lessons for the Italian case, particularly looking at regionally decentralized systems. A systematic review of the literature was conducted and reported in line with the Preferred Reporting Items for Systematic Reviews and Meta-Analysis with a focus on health equity [29]. Preliminary search terms were identified and pre-tested on Google Scholar. The results were used to refine the search terms. The following electronic databases were searched: EconLit, Ideas, SSRN, PubMed, and Google Scholar. Based on the eligibility criteria, studies were selected through systematic screening made up of the following processes: exclusion of duplicates; screening based on titles; scrutiny of abstracts and finally a review of full articles. This process was conducted by a single reviewer and repeated by a second reviewer to ensure reliability. Each article has been independently reviewed and for each article the methodology has been critically examined. Disagreement was resolved through a refereed decision. Key study characteristics that were extracted include: author(s) and dates of publications, objectives of the study, the country where the study was carried out, study design, equity variables measured and key findings and conclusions. Moreover, reference lists of selected articles were manually searched in order to identify relevant publications for inclusion. The search was limited to English written peer-reviewed studies. The number of articles that met all the criteria for inclusion of the review was 32. The time frame of the articles included ranges from January 1977 to November 2019 (Table 1). For each article, we critically reviewed and compared methods. We followed PRISMA methodology extended with a focus on health equity. We reviewed the evidence for both OECD and non-OECD countries, with the aim of drawing lessons for countries where healthcare financing is heavily decentralized, such as Italy. This work contributes to the existing literature by adding recent years to the analysis and by taking into considerations both OECD and non-OECD countries. Newly, we have reported the results in a map
that gives a big picture of regressivity around the world and makes the interpretation of the results more intuitive.
This study can also contribute both to advancing the knowledge on methodologies aimed at measuring vertical equity in healthcare financing and to illustrate the great variability of inequity measures of financing across countries. We found that the most widespread method used is the Kakwani index. Studies that analyse equity at both national and decentralized level seem more precise and give a more detailed equity picture useful for policy makers. Aggregate results very often portray the average progressivity and therefore can conceal different results at the disaggregated level. Therefore, it would be important to have more evidence for decentralized health care systems. The overall levels of progressivity appear very variable across countries, given the high variability in the relative shares of the different sources of financing. For non-OECD countries, the main source of equity concerns are out-of-pocket expenses given the relevance of direct payments in the majority of low-income countries. This has led to increasing inequalities and it has been found that more and more people are falling into poverty due to high health costs. Direct payments show to be regressive even in OECD countries, but occupy a less substantial portion of total financing, and the overall financing system is influenced by other less regressive sources. Predominantly tax-financed systems are slightly progressive, particularly in the poorest countries, where often health financing relies heavily on out-of-pocket (OOP) expenses. In OECD countries, direct payments are often regressive, but occupy a less substantial part of total financing. In OECD countries, systems funded mainly through general taxation, tend to be proportional or moderately progressive, while social insurance systems appear moderately regressive, whereas systems based on private financing are the most regressive. In some countries, such as Italy, the introduction of VAT as a source of health financing has led tax financing to become regressive, whereas previously it appeared progressive. Results show the importance for Non-OECD countries of improving equity in healthcare financing by reducing the relative weight of direct household’s payments source of financing. This appears also to be a growing challenge for decentralized OECD countries where, after the global economic crisis, the relative share of direct payments increased due to cost containment policies. The COVID-19 pandemics is making even more evident that the health systems of countries affected by vertical inequities need urgently to be further reformed.
The overall degree of progressivity, in Italy, appears mildly positive [25]. Italy’s health care system has been reformed several times, particularly after the introduction in 1996 of fiscal federalism in healthcare financing and with legislative decree n.56/2000. There is evidence that this process introduced an increase in horizontal income-related inequities in health and health care utilization, both between countries at European level [24] and within Italy, between regions [16],[8]. Today, the system appears to be heavily decentralized at a regional level, with varying financing rules across regions, particularly in terms of co-payments on public health care services for drugs, specialist and diagnostic care [2]. Wagstaff et al [25] estimated concentration indices and progressivity indices, based on the Kakwani [12] methodology at country level in Europe. Regarding direct taxes, they found that Italy is the country with the lowest degree of progressivity. Regarding indirect taxation,
9
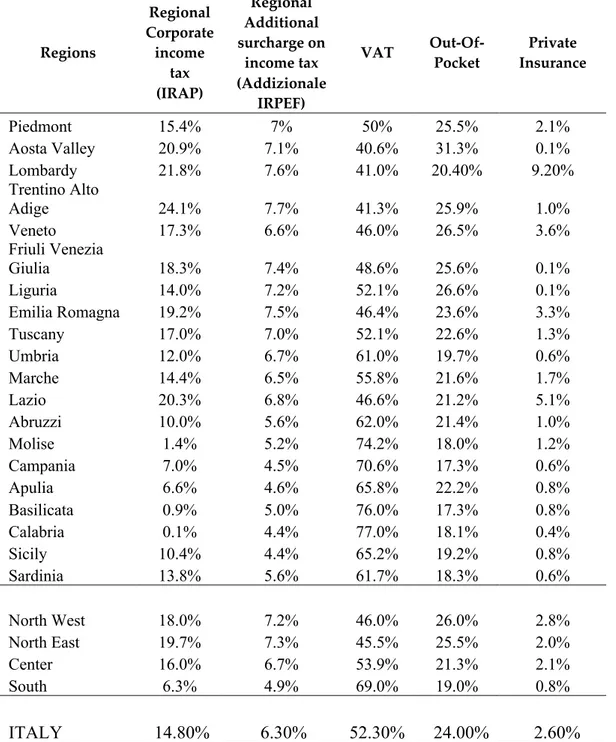
instead, Italy was one of the few progressive countries. Wagstaff et al [25] found that out-of-pocket payments tend to be highly regressive in general. Along the line of these works, we wanted to estimate the concentration index and Kakwani index for Italian regions. In Italy, the central question is that the principle of equity was not on the agenda of policy-makers when the regional reorganization of the national health system started. The complex mechanism resulting from the combined provisions of Legislative Decree 56/2000 (abolition of the national health fund) and of the Constitutional Law 3/2001 (reform of Title V of the Constitution) only marginally took into account funding according to the real needs of the population. Italian funding at the regional level was based on different sources, whose real distributional effect was not a matter of concern: such sources were partly redistributed among regions by using a sharing mechanism, such as for VAT revenue (value-added tax) and excise duty on petrol (later eliminated) and partly handed directly to regions were the amount were cashed, such as the regional additional surcharge on the personal income tax, and IRAP (regional tax on productive activities).
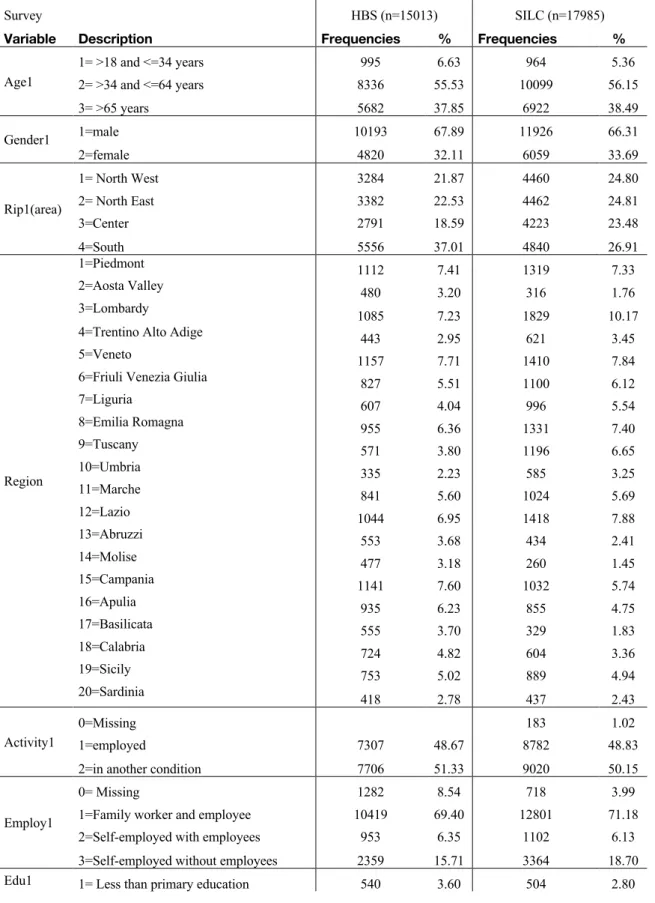
For these reasons the second paper, to be submitted to the review European Journal of Health Economics with G. Citoni and M. Giannoni, analyses the progressivity of healthcare financing in the Italian system and focuses on Italian regions, performing a comparison of progressivity of the healthcare financing across regional systems. Until now, there was no such evidence for Italian regions [25],[26], and it is important to fill this gap as the Italian health financing system has changed during the last years. This paper presents the first comprehensive and consistent analysis of the distribution of healthcare financing contributions in relation to ability to pay in the 20 Italian regions. The analysis of the progressivity of the Italian regional health care systems is conducted in three steps. In the first step, the progressivity of each source of finance: direct taxes (IRAP and additional IRPEF), indirect taxes (VAT), out of pocket and private health insurance is estimated. In the second step, in order to define the financing mix, for each region the relative weight of each source of financing is calculated. In the final step, the overall progressivity for each region is estimated by using the financing mix. In this way, it is possible to compare the indices between regions [19]. Two types of data are required: 1) survey data, in order to establish the distribution of payments across households; 2) aggregate data, in order to estimate the macro-weights for each financing source. The most suitable source of survey data is usually based on household income and expenditure survey, which contains data on our two central variables, namely payments for health care and ability to pay [19]. Unfortunately, no such comprehensive survey is available for Italy. Therefore, we were forced to perform a matching of two datasets. We matched microdata from the 2015 wave of the Italian households' budget survey (HBS, n=15013 households) with the Eurostat EU-SILC (European Statistics on Income and Living Conditions) cross-sectional wave for 2015 (n= 42987 individuals/ 17985 households). HBS dataset contains information on household expenditures for goods and services according to their main social, economic and territorial characteristics. The matching procedure between HBS and EU-SILC is based on a mixed strategy. We first utilized exact matching with hot ranking [3]. As matching variables, we used the following grouping characteristics of the head of the household: age group (4 classes), gender (2), educational level (5), employment condition
(3), activity (2), main geographical areas (4) and whether the second member of the household earns any income (2). We coupled in such a way 12647 HBS households, out of 15013 with "similar" households from the EU-SILC. The unmatched 2366 households of HBS, were imputed income and tax variables from EU-SILC, by using propensity score matching [23]. At the end of the two-stage procedure, all HBS households had the required variables. The final dataset contained 15,013 records. In order to measure equity in financing, we used the Kakwani index [12] as described in their application to vertical equity in healthcare financing by O’Donnell et al. 2008; Wagstaff et al. 1992 and Wagstaff et al. 1999. This is the most widely used summary measure of progressivity in both taxation and Public health finance literature. The Kakwani index (KI) is twice the area between a payment concentration curve and the Lorenz curve for income and it is calculated as:
KI= C – G
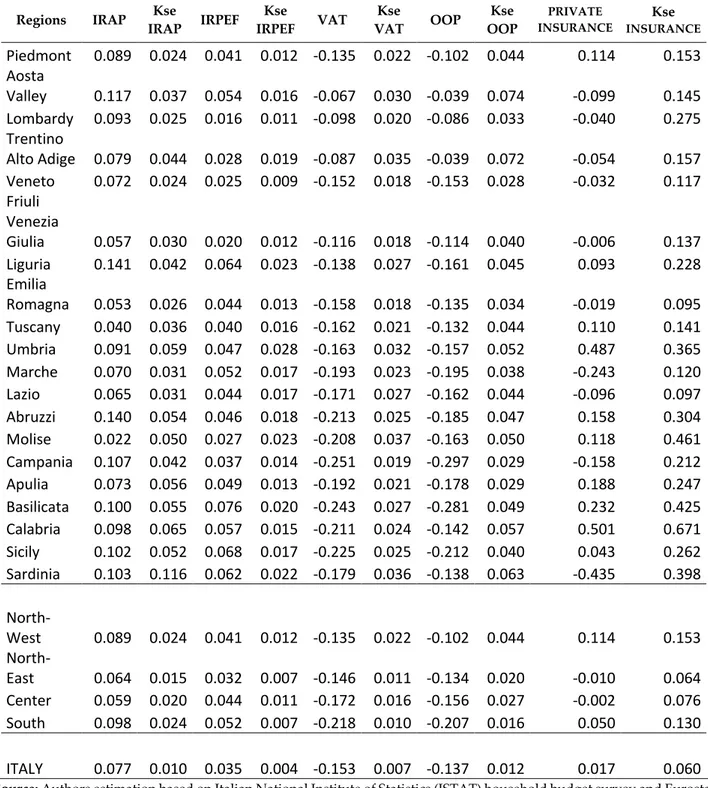
where C is the concentration index for health payments and G is the Gini coefficient of the income variable. The value of KI ranges from –2 to 1. A negative number indicates regressivity. A positive number indicates progressivity, the value 0 indicates a proportionality. The Kakwani index is based on the fact that a tax system can deviate from proportionality. The coefficient of Gini (G) is always positive by construction and varies between 0 and 1. The concentration index (C) varies between -1 and +1, depending on whether the total amount of tax seriously affects the poorer or the richer tax payers relatively more [19]. Results show that there are regional inequalities in healthcare financing. Kakwani are reported by region and by main health financing sources. VAT and Out-of-Pocket index are negative in all regions, but they are relatively more regressive in the regions of Southern Italy. IRAP and additional IRPEF always show progressivity. Private insurance plays a relatively minor role in most regions, and the results are far from reliable. Its index is progressive at a national level, but at a regional level the results are mixed. Today, the Italian system appears to be heavily decentralized. This heterogeneity derives from differences in the ability to pay, in out-of-pocket share on public health care services (like, e.g., in copayments for drugs, specialist and diagnostic treatments), and in the use of private insurance. Previous evidence showed increasing regional horizontal inequities in health care utilization [16],[9] with the health care system failing to comply with Article 32 of the Italian Constitution, asserting the irrelevance of geographic location as discriminant for health care utilization. From this work, it appears that there are problems also in the progressivity of healthcare financing, particularly for Southern regions, confirming the existence of the "questione meridionale” [6].
The third paper has been published together with Alessio Ishizaka (AI) and Giuliano Resce (GR), in “Socio-Economic Planning Sciences” [5]. This work aims to measure inequalities in access to public health care services between regions that are due to differences in co-payments. According to Waters [28], an appropriate indicator for estimating the equity of the health system is access to services. The term access is defined in Mooney [17] as an opportunity and, more specifically, ‘the use of this
11
opportunity’. Le Grand [14] defines access as costs incurred in receiving health care services. The cost must be interpreted in terms of money and time that individuals may incur using services. However, Klomp and De Haan [13] suggest that multidimensionality is intrinsic in the definition of health provided by the World Health Organization. Therefore, we propose to deal with inequality in access to health care by means of a Multi-Criteria Decision Analysis approach. We propose measuring the inequality of opportunities by evaluating only the barriers to accessing public health care services. Regardless of the unknown real needs and use, we assume that inequality of access to public health care is related to cost. Therefore, in our model, the index of inequality of opportunities is given by the sum (weighted by the uncertainty) of co-payment prices. From a methodological standpoint, we use the idea of Greco et al. [11], where the SMAA approach is used to take into account a large sample of randomly extracted vectors of weights to rank regions. Italy is well suited for this measurement, as the level of co-payments varies among regions. This work aims to measure inequality in access to public health care services between regions due to differences in co-payments. This problem has been analysed with a Multi-Criteria Decision Making approach. From a methodological perspective, a recent new development of the Stochastic Multiobjective Acceptability Analysis (SMAA) was introduced. We used the model proposed in Angilella et al. [1], hereafter Hierarchy Stochastic Multiobjective Acceptability Analysis (HSMAA). The HSMAA method allows to take into account both the uncertainty with respect to the weights assigned to the considered criteria as well as the uncertainty with respect to the weights assigned to the considered sub-criteria. This innovative approach allowed to estimate a new index of inequality of access in regional public health care in the absence of information about people's real health care needs. Results show that, regardless of real needs, there is evidence that differences in co-payments create a pervasive territorial segregation among citizens living in different Italian regions. Applying for the first time HSMAA in measuring inequality allows us to estimate a unique index for each region and to rank them. Our analysis is conducted using secondary data collected from four different sources: official website of the regions, the National Agency for Health Care Services (AGENAS), the National Federation of Pharmacists (FEDERFARMA), and the online newspaper for the Italian health care sector (Quotidiano Sanità). From these surveys, we derived the level of existing co-payments in Italian regions. We estimate territorial inequalities in access to public health care in 21 Italian regions.
Results show that Campania in Southern Italy is by far the worst-performing region, being the only region with its mode and median on the first rank. Campania exhibits the highest level of co-payments for public health care and, therefore the highest inequality in access. The Province of Bozen, Calabria, Piedmont, and Lombardy follow the Campania disaster, with a certain distance. Indeed, these four regions can achieve the first rank, and they have the mode and median above the fourth rank. On the top of the ranking, Friuli Venezia Giulia exhibits the highest level of equity of access, with the lowest co-payments. At some distance, Aosta Valley, Abruzzo and Molise follow, proving to be cheaper in public health care provision in terms of co-payments. There are different levels of co-payments for the same health services among different regions, and this is associated
with strong spatial inequalities. This challenges the National Health Service (NHS) target aiming at guaranteeing the same standard in healthcare to all citizens, wherever they live by providing the basket of the so-called “Essential Levels of health care” (Livelli Essenziali di Assistenza) uniformly across Italy. This work showed that regionally varying co-payments are associated with territorial inequalities in access to health care across the country. In Italy, deep interregional differences in health care expenditure aggravated the existing socioeconomic inequalities in health care among regions [8],[10]. One of the major consequences is that part of the population cannot afford higher quality health care, and this undermines the fundamental principle of universality of health care. Despite limitations, from our three papers it seems possible to conclude that the overall equity of the Italian NHS is nowadays challenged regarding vertical equity in financing. Increasing autonomy in health financing is associated to high regional inequities in financing. Moreover, it appears that the regional variability in the levels of co-payments is a source of inequalities in access to public health care. Overall, the "questione meridionale" is still central for the health care sector. Therefore, it seems important to intervene in the sources of finance that are regressive, and to reduce regional differences. There is the need of reforming Italian healthcare financing system, because VAT and out-of-pocket are always regressive and this makes the system inequitable.
The SSN is a sub-system of the welfare state, which aims for the same standard health care of the citizens of a country, wherever they live. The main problem is that, since 2002, regional co-payment revenues are used to finance spending. This is shown by the fact that regions with financial stability plans have higher copayments (see Piedmont, Lazio, Campania, and Calabria for specialist visits). The analysis done showed that there is a problem of regional variation in copayments. In addition, the tariffs applied in some regions are likely to violate the universality principle of the National Health Service laid down in Article 32 of the Italian Constitution, accentuating the risk of serious inequalities in accessing the essential levels of care. To draw further policy implications from the work on vertical equity in Italian regions is rather tentative, because there are at least two big caveats on private insurance incidence and on IRAP. The first one is that private insurance has KI (Kakwani indices) that are never significant. Inferring something for specific regions is worthless. Regarding IRAP, we had a procedure of calculation that is the only one apparently viable with households' and individuals' surveys, being the tax base (Value Added) calculated at the firm level. Moreover, we had to perform further approximations because of the widespread exemptions accorded to professional and self-employed. Let us assume that our results do make sense. Being the KI indices regressive both at national and at regional level for the overall financing, we guess that it could be useful to reduce such regressivity. Now, IRAP is a progressive source of finance: in the current policy debate, there is a discussion about abolishing such a source. We believe it is not a sound idea, unless it is replaced by a more progressive source, such as IRPEF. The second implication of our work is that it affects the discussion about the "second pillar" (that, in fact, is a third pillar) of the Italian health care system, i.e. the Supplementary Health Care Funds (Fondi Sanitari Integrativi) [20]. Looking at the work of Marenzi et al. [15] we see that the enrolment in such Funds is heavily concentrated among the rich and that the distribution of tax-benefits for the Funds are heavily
pro-13
rich too. Suppose then there were two possible strategies of expansion of Funds: 1) eroding SSN stance as all-purpose third payer; 2) forcing for a replacement of out-of-pocket expenditure by Supplementary Funds either compulsory or obtained through unfair competition. The first option has been on the agenda in the past years. However, now it seems more difficult to be pursued. This both because of a change of politicians' perspective, as well as because trade unions are starting to realize that even if Supplementary Funds financed by firms can help, in the short run, in finding an agreement on new contracts, in the long run, they can undermine the SSN stability and performance. If pursued, this option would worsen regional disparities, both because of the unequal geographical distribution of Supplementary Funds and because they are concentrated on richer and healthier individuals [4]. Moreover, a slimmer SSN would also entail a lower amount of redistribution of resources from the richest Northern regions to the poorest Southern regions: given our result on the incidence of VAT in different regions, the lower redistribution would imply a lower reduction of Kakwani index for Italy. Instead, the second option is fully pursued by private actors, interested in widening the market for Supplementary Funds. The "mantra" is that there is a high level of inappropriate utilization concealed in out-of-pocket expenditure, while in health care financed by Supplementary Funds such inappropriate consumption is avoided. Discussing this issue goes beyond the scope of this work. However, as suggested by health economics theory, ex-post moral hazard (one source of inappropriate consumption) is not there if there is out-of-pocket payment, and it is higher the lower is the co-payment required by a third party payer [21]. Finally, even if Supplementary Funds would replace out-of-pocket payments a worsening of the regressivity in health financing may reasonably occur. This would be due to tax exemptions for Supplementary Funds, as premia are deducted by income, at progressive tax rates, thereby favoring the rich people. A further negative effect can be expected if one would choose, in order to discourage out-of-pocket consumption, to abolish existing 19% tax-allowances, while keeping instead income deductions for Supplementary Funds.
Table 1- The PhD Thesis in a snapshot
Chapter 1: VerticalEquity in healthcare financing: a systematic review of methods and
evidence
Chapter 2: Vertical equity in healthcare financing in
Italian regions
Chapter3: Inequality of access to Italian Public Health analysed with the
Hierarchy Stochastic Multiobjective Acceptability Analysis
Research
questions Who pays for health care? Is financing progressive in OECD and non-OECD health systems?
Who pays for health care in Italy? Are Regional health care System progressive in Italy?
There is a pervasive spatial inequality of access to public health care in Italy? Are there systematic differences among regions in co-payments?
Data English language studies published between January 1977 and November 2019 in Econlit, Pubmed, ideas, Ssnr and Google Scholar.
1- survey cross-sectional data from the Italian National Institute of Statistics household budget survey for the year 2015 2- households income at micro level, from households pre and post-tax income Eurostat EU SILC microdata for 2015.
The value of existing co-payment prices in Italian regions in various form.
Methodology Systematic review following the PRISMA methodology adapted for equity issues.
The Kakwani index considers that a tax system can deviate from proportionality. The index is measured as twice the area between a payment concentration curve and the Lorenz curve for income and it is calculated as:
KI= C – G
C is concentration index for health payments and G is the Gini coefficient of the income variable.
The Hierarchy Stochastic Multiobjective Acceptability Analysis (HSMAA), which takes into account the uncertainty with respect to the weights assigned to the considered criteria and the uncertainty with respect to the weights assigned to the considered sub-criteria.
Contribution This study reviewed and updated the state of the art of scientific literature on the measurement of equity in healthcare financing in OECD and non-OECD countries. Regressivity appears a relevant issue across both OECD and non-OECD countries.
This study showed that Italian health system appears characterized by a high interregional variability in financing. This heterogeneity derives from differences in the contributive capacity of citizens, in their share of out-of-pocket expenditure for public health care services (co-payments for drugs, specialists and diagnostic treatments), and in the use of private insurance.
This paper analyses the regional differences in the application of the co-payment in the Italian National Health Care Service and measures the inequality in access to public health care among regions, due to the difference in co-payments.
Authors Margherita Giannoni, Domenico De Matteis, Guido Citoni
Guido Citoni, Domenico De
Matteis, Margherita Giannoni Domenico De Matteis, Alessio Ishizaka, Giuliano Resce Status To be submitted To be submitted Published
15
References
1.
Angilella, S, Corrente S, Greco S, Słowiński R (2016), Robust Ordinal Regression and StochasticMultiobjective Acceptability Analysis in multiple criteria hierarchy process for the Choquet integral preference model, 63: 154-169.
2. Armeni P, Fenech L, Furnari A, Longo F, Petracca F, Ricci A (2016), Rapporto OASI, Osservatorio sulle aziende e sul sistema sanitario italiano, Università Commerciale Luigi
Bocconi, Milano.
3. Budd E (1971), The creation of a microdata file for estimating the size distribution of income, Review of Income and Wealth, 4:317-333.
4. Citoni G, Piperno A (2019), Terzi paganti in sanità: assicurazioni e fondi sanitari. Stato dell'arte, effetti ed implicazioni di policy, Politiche Sanitarie 20(1), pp. 14-32
5. De Matteis D, Ishizaka A, Resce G (2017), The “postcode lottery” of the Italian public health bill analysed with the hierarchy Stochastic Multiobjective Acceptability Analysis, Socio-Economic Planning Sciences.
6.
Del Monte A D, De Luzenberger R D (1989), The effect of regional policy on new firm formation in Southern Italy. Regional Studies 1989; 23(3), 219-230.7. Fleurbaey M, Schokkaert E (2012), Equity in health and health care, In Handbooks in Health Economics, volume 2 ed. Pauly MV, McGuire TG and Barros PP, 1003–1092, Amsterdam, Netherlands: North Holland.
8.
Franzini L, Giannoni M (2010), Determinants of health disparities between Italian regions.BMC Public Health, 10:296.
9.
Giannoni M, Casucci P, Ismail Z (2012), Disuguaglianze di salute ed equità nel ricorso ai servizi sanitari da parte dei cittadini stranieri nelle regioni italiane, Franco Angeli.10. Giannoni M, Hitiris T (2002), The regional impact of health care expenditure: the case of Italy,
Applied Economics, 34: 1829-1836.
11. Greco S, Ishizaka A, Matarazzo B, and Torrisi G (2017), Stochastic Multiattribute Acceptability Analysis: an application to the ranking of Italian regions. Regional Studies; 1-16.
12. Kakwani N C (1977), Measurement of Tax Progressivity: An International Comparison,
Economic Journal, 87: 71-80.
13.
Klomp J, de Haan J (2010), Measuring health: a multivariate approach. Social indicatorsresearch, 96(3), 433-457.
14.
Le Grand J (1982), The Strategy of Equality, London.15. Marenzi A, Rizzi D, Zanette M (2019), Dimensione ed effetti redistributivi dei benefici fiscali dei fondi sanitari integrativi, Politiche Sanitarie 20(1), pp. 40-54.
16. Masseria C, Giannoni M (2010), Equity in access to health care in Italy: A disease-based
approach, European Journal of Public Health, 20: 504-510.
17.
Mooney G (1983), Equity in health care: confronting the confusion. Effective Health Care, 1(4), 179-185.18.
Morgan M, Gulliford M (2003), Access to health care, Routledge.19. O’Donell O, van Doorslaer E, Wagstaff A et al. (2008), Analyzing Health Equity Using Household Survey Data: A guide to techniques and their implementation, The World Bank
Institute, Washington, USA.
20. Petretto A (2013), On the Fuzzy Boundaries between Public and Private in Health-Care Organization and Funding Systems, Rivista di Politica Economica, 102: 327-370.
21. Piperno A, Citoni G (2018), Secondo pilastro in sanità e tutela della salute: rischi, opportunità e scenari possibili, Politiche Sociali 2, pp. 293-298.
22. Rostampour M, Nosratnejad S (2019), A Systematic Review of Equity in Healthcare Financing in Low and Middle-Income Countries, Value in Health Regional Issues, 21:133-140.
23. Sisto A (2006), Propensity Score Matching: un’applicazione per la creazione di un database integrato ISTAT-Banca d’Italia, WorkingPaper n°63, Università del Piemonte Orientale.
24. van Doorslaer E, Wagstaff A, et al. (1997), Income-related inequalities in health: some international comparisons, Journal of Health Economics, 16: 93-112.
25. Wagstaff A, van Doorslaer E (1992), Equity in the Finance of Health Care: Some International Comparisons, Journal of Health Economics, 11: 361-388.
26. Wagstaff A, van Doorslaer E, et al. (1999), Equity in the Finance of Health Care: Some Further
17
27.
Wagstaff A, van Doorslaer E (2000), Equity in Health Care Finance and Delivery, In North Holland Handbook in Health Economics, ed. Culyer A and Newhouse J, 1804–1862, Amsterdam, Netherlands: North Holland.28.
Waters H R (2000), Measuring equity in access to health care. Social Science & Medicine.29.
Welch V, Petticrew M, Tugwell P, Moher D, O'Neill J, Waters E et al. (2012) PRISMA-Equity 2012 Extension: Reporting Guidelines for Systematic Reviews with a Focus on Health Equity. PLoS Med 9(10): e1001333. https://doi.org/10.1371/journal.pmed.1001333.Vertical Equity in healthcare financing: a systematic
review of methods and evidence
Abstract
There is growing evidence on equity in healthcare financing at the international level. We conducted a systematic review of the evidence on vertical equity in healthcare financing with the aim of: 1) identifying the main methods used; 2) compare evidence across countries and drawing lessons particularly looking at regionally decentralized systems. Based on PRISMA methodology extended with a focus on health equity, we searched EconLit, Ideas, Google Scholar, PubMed and SSRN databases (time frame: 1977-2019). Of all the articles found (893), 32 were eligible for inclusion. We reviewed the evidence for the two main groups of OECD and non-OECD countries.
Results: 1-The most frequently used and effective methodology is the Kakwani index 2- Overall, equity in healthcare financing seems to have worsened over time. There are similar progressivity levels by specific source of financing within the two main groups of countries. However, the average levels of equity vary across countries, given the high variability in the relative shares of the different sources of financing. Direct payments are the most regressive source of financing. OECD economies show comparatively higher levels of equity. However, equity in tax-based decentralized health care systems appears undermined by direct payments increases due to cost containment. It is important to monitor vertical equity both between and within countries.
Keyword: Vertical Equity in healthcare financing, Progressivity, Kakwani index, Health Care
Financing.
1. Introduction
Fair financing is a key objective of health care systems [49]. There is increasing evidence showing inequities in healthcare financing [51]. However, there is a lack of updated studies systematically reviewing evidence on this topic by looking at both OECD and non-OECD countries. This paper presents the results from a systematic review of the evidence on vertical equity in healthcare financing with the aim of updating knowledge on vertical equity in financing for both Non-OECD and OECD countries. A previous study reviewed evidence for middle-income countries up to the years 2016 and found that the insurance system (individual and social) is the most equitable method of financing, whereas out-of-pocket (OOP) were the most inequitable source of financing [37]. Our work adds by adding more recent years to the analysis and by taking into considerations both OECD and non-OECD countries excluding any income limitation. In addition, recently compared to previous tests, we have reported the results in a world map that makes the interpretation of the results more intuitive. Vertical inequities in health financing can be intended as the violations of the principle according to which an individual should pay more for health care the richer she is and this implies that contributions to health financing should be based on person’s ability to pay/income [49],[51]. The objective of vertical equity measurement is therefore to assess the progressivity/ regressivity of the main health financing sources [51]. Health systems are typically financed through different types of sources. On one hand, general taxation and social insurance are based on state-financing; on the other hand, OOP and private insurance are private sources falling on the responsibility of the users. In the lack of financial protection often catastrophic payments may result [51]. The importance of equity in healthcare financial contribution and of protecting households against catastrophic payments becomes evident especially when OOP represent a main source of health financing and there are high income inequalities in a country [51]. This appears particularly relevant given the ongoing economic recession and global COVID-19 pandemics. In particular, we aim at drawing lessons for countries, such as Italy, were healthcare financing is heavily decentralized and there is evidence of horizontal inequities in the delivery of health care [28]. The paper is organized as follows. Section 2 describes the methodology used. Section 3 shows the results from the review of the evidence on: the methods used (section 3.1); OECD countries (section 3.2) and Non-OECD countries (section 3.3). Section 4 is a discussion. Section 5 concludes.
2. Methods
A systematic review of the literature was conducted and reported adapting the Preferred Reporting Items for Systematic Reviews and Meta-Analysis (PRISMA) with a focus on health equity [53]. Preliminary search terms were identified and pre-tested on Google Scholar. The results were used
to refine the search terms. The following terms were finally used: Vertical equity health OR equity healthcare financing OR progressivity health OR vertical out-of-pocket equity health.
The following electronic databases were searched: EconLit, Ideas, SSRN, PubMed, and Google Scholar. Moreover, the reference lists of the selected articles were manually searched in order to identify relevant publications for inclusion. The search was limited to English written peer-reviewed studies.
Our literature search was carried out in two separate phases. Following PRISMA approach, we firstly identified the main literature containing methods and evidence on measuring equity in healthcare financing. Initially, the literature needed to begin the study were searched for and found[33],[44],[48],[50]. From this, it appears that the mainstream, in the measurement of vertical inequities in financing is to use the Kakwani index of progressivity (KI). This methodology is further described in Appendix 1. We then searched for further methods and evidence by conducting an extended review of literature. The following electronic databases were searched:
● Pubmed
● Econlit-EBSCO ● Ideas
● Google Scholar ● SSRN
Based on the eligibility criteria, studies were selected through systematic screening made up of the following processes: exclusion of duplicates; screening based on titles; scrutiny of abstracts and final review of full articles. This process was conducted by a single reviewer and repeated by a second reviewer to ensure reliability. Each article was independently reviewed and for each article the methodology was critically examined. Disagreement was resolved through a discussion between the two reviewers and where the disagreement persisted, a third reviewer refereed the decision. Key study characteristics that were extracted include: author(s) and dates of publications, objectives of the study, country where study was carried out, study design, how equity was measured and key findings and conclusions.
Original studies that assessed equity in healthcare financing were eligible for inclusion. Studies were considered eligible according to the following criteria:
1. The studies examined health vertical equity financing through data collected for the general population.
2. The studies analysed vertical equity of the overall country health financing system. When this was not available, at least two main types of source of healthcare financing. Particularly, articles analysing the progressivity of OOP component were included only in a context of the overall health financing vertical equity assessment. We made two exceptions for two countries: China and India. For China, we reported evidence available at regional level, given the relative lack of country-wide studies and the fact that there are important differences among areas. For India, we reported the
available evidence even if it was mainly based only on OOP, as this was the most important health financing component at that time.
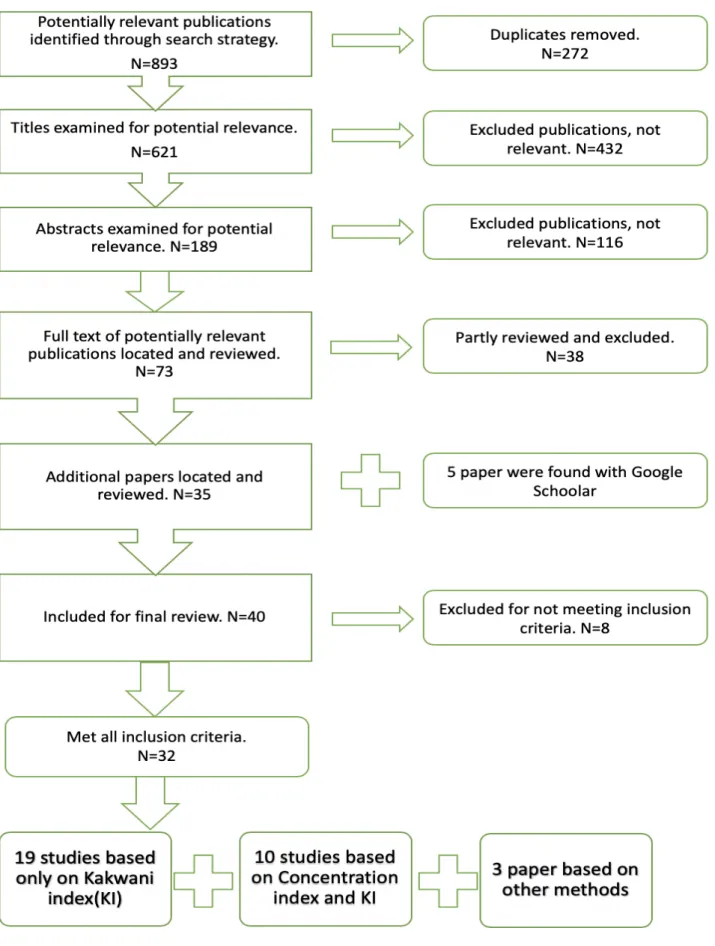
The quality of articles was assessed according to the following stages. After searching the databases, all duplicates were eliminated. The remaining articles were investigated based on titles and abstracts, and irrelevant papers (based on the inclusion criteria) were deleted. We assessed the full-text of remaining articles according to the inclusion criteria and the discrepancy between them resolved through discussion. Moreover, reference lists of selected articles were manually searched in order to identify relevant publications for inclusion. The search was limited to English written peer-reviewed studies. The articles that met all the criteria for inclusion in the review were 32. The time frame of the articles included ranges from January 1977 to November 2019. For each article, we critically reviewed and compared methods. We reviewed the main methods used and the evidence for both Non-OECD and OECD countries, particularly drawing lessons for countries where healthcare financing is heavily decentralized. Figure 1 illustrates the selection process and the main results. The search strategy keywords and results are detailed in Appendix 2.
Figure 1: search for papers for systematic review
3.
Results
Of all the papers found (893), 189 papers were selected based on the abstract (Figure 1). We included all articles measuring vertical equity in healthcare financing in both OECD and Non-OECD countries, the main topic of our work (n=73).
Articles dealing only with measuring horizontal equity were excluded, while works dealing with both vertical and horizontal equity were included. Most of the selected works were based on the Kakwani index (KI) method for measuring vertical equity. Therefore, all articles based on KI methodology have been included. Following this criterion, out of the 73 texts analysed, 40 were selected as relevant for research purposes and fully examined. After the analysis, 32 articles were selected: 19 papers are based on KI; 10 are based on KI in combination with the concentration index and/or other inequity indices; 3 are based on other methods than KI (Figure 1).
Table 1 shows a taxonomy of the reviewed articles categorizing results according to the methodology used and the country analysed, the type of data used and the level of analysis, the design type, the methods used, the years of analysis, the type of publication. In order to grasp the differences between health financing structures, results are reported by distinguishing between OECD and Non- OECD countries. A group of seminal studies compared vertical equity in health financing in OECD countries, considering the various sources of financing, generally divided into: out-of-pocket, private insurance, direct and indirect taxation and social security contributions (first six cases described in Table 1).
Table 1: Reviewed studies on vertical equity in healthcare financing: evidence from OECD and non-OECD
countries
a) Including results from v. Doorslaer et al (1999) [12] (b) Including results from Wagstaff et al. (1999) [9]; Jansen and van Doorslaer (2002) [21]; Klavus and Hakkinen (1998) [25]; Van Camp and Van Ourti (2003) [41]; (c) Including results from previous studies van Doorslaer, O'Donnell, Rannan-Eliya, et al. [42], Wagstaff [47].
Data source: international literature databases (Pubmed, Econlit, Google Scholar, SSRN, Ideas)
Legend: AFR= Ghana, South Africa, Tanzania; ASI1=Bangladesh, China, Hong Kong, Indonesia, Japan, Korea Rep., Kyrgyz Rep., Nepal, Philippines, Punjab, Sri Lanka, Taiwan, Thailand; ASI2=Hong Kong, Japan, Korea, Singapore, Taiwan; OECD1= Denmark, France, Ireland, Italy, Netherlands, Portugal, Spain, UK, US; OECD2= Denmark, Finland, France, Germany, Ireland, Italy, Netherlands, Portugal, Spain, Sweden, Switzerland, UK, US; OECD3= Belgium, Denmark, Finland, France, Germany, Italy, Portugal, Spain, Sweden, Switzerland, The Netherlands, United Kingdom and USA
Data type: PAN = panel data; CR = cross-sectional data; RCR = repeated Cross-sectional data Level of analysis: AGG = aggregate; HOU = household; IN = individual.
Analysis method: KI= Kakwani index; OT = other Publication type: PA= peer-reviewed article. Design: all reported studies are observational
Country Data Level Methods Years
OECD countries:
Wagstaff and van Doorslaer. 1992 OECD1 CR HOU KI from 1980 to 1987, different for each country Lairson et al. 1995 Australia CR HOU KI 1988-1999
Klavus. 1998 Finland CR HOU KI/0T 1990
Wagstaff et al. 1999 (a) OECD2 CR HOU KI from 1981 to 1993, different for each country De Graeve and Van Ourti. 2003 (b) OECD3 CR HOU KI 1987-1997
Smith and Normand. 2009 Ireland CR HOU OT 2004 Vork et al. 2009 Estonia PAN HOU KI/0T 2000-2007
Smith. 2010 Ireland RCR HOU KI 1987-1988; 1999-2000; 2004-2005 Crivelli and Salari. 2014 Switzerland RCR HOU KI 1998-2005
Hajizadeh et al. 2014 Australia RCR IND KI 1973-2010 Ketsche et al. 2015 United States CR HOU KI 2004 Quintal and Lopes. 2016 Portugal CR HOU KI 2010-2011
Non-OECD countries:
Yi et al. 2005 China RCR IND KI 1993-1999 Roy and Howard. 2007 India CR HOU OT 1995-1996 Yu et al. 2008 Malaysia CR HOU KI 1998-1999 O'Donnell, Wagstaff et al. 2008 Egypt CR HOU KI 1997
O'Donnell et al. 2008 (c) ASI1 CR HOU KI from 1995 to 2001, different for each country Mataria et al. 2009 Palestine CR HOU KI/0T 2004
Connelly et al. 2010 Iran RCR HOU KI 1995-1996; 2006-2007 Yu et al. 2011 Malaysia CR HOU KI 1998-1999
Akazili et al. 2012 Ghana CR HOU KI/0T 2005-2006; 2008 Ataguba. 2012 South Africa CR HOU KI/0T 2005-2006 Chen et al. 2012 China RCR HOU KI 2003; 2008 Mills et al. 2012 AFR PAN HOU KI/0T 2008 Munge and Briggs. 2013 Kenya CR HOU KI 2007 Almasianka et al. 2015 Iran CR HOU KI/0T 2012 Kwesiga et al. 2015 Uganda CR HOU KI/0T 2009-2010 Homaie Rad and Khodaparast. 2016 Iran CR HOU KI 2012 Ali Molla and Chili. 2017 Bangladesh CR HOU KI 2010 Chen et al. 2017 China CR HOU KI/0T 2013 Mulenga and Ataguba. 2017 Zambia CR HOU OT 2010 Qin el al. 2017 China RCR HOU KI/0T 2009; 2013
Since then, based on these seminal studies and on the World Bank's diffusion of the methodology and related tools, evidence has grown also for Non-OECD countries (twenty cases described in Table 1). Twelve articles analyse OECD countries, four compare the progressivity indices of health financing between some European countries and the United States. Twenty articles deal with Non-OECD countries or countries without a National Health System/Social Security (Table 1). We found evidence for many OECD countries, namely Australia, Belgium, Denmark, Estonia, Finland, France, Germany, Ireland, Ireland, Italy, Japan, Korea, The Netherlands, Portugal, Spain, Sweden, Switzerland, the UK and the US (Table 1). Figure 2 shows the results by country in a world map where we report results for those countries for which an assessment of the overall progressivity level was available. It appears that in most European countries, in Australia and Japan the health systems were progressive, whereas in others like, e.g., the US and Switzerland the health system was regressive (Figure 2). However, it is important to stress that the evidence for most OECD countries is not recent, whereas for the non-OECD countries the evidence is more recent (Figure 3).
Among the non-OECD countries, we found evidence for several Asian countries (Bangladesh, India, Malaysia, China, Hong Kong, Indonesia, Kyrgyz Rep., Nepal, Philippines, Punjab, Sri Lanka, Taiwan, Thailand, Japan, South Korea, Singapore) [2],[8],[9],[33],[38]; for middle-Eastern countries/areas (Iran, Palestine) and for some African countries (Ghana, Kenya, Uganda, Zambia, South Africa, Tanzania) (Table 1, Figure 3) [19],[26],[29],[30],[31],[32]. The analysed African systems were mostly progressive, whereas in Asian and the Middle-Eastern there is a majority of regressive systems (Figure 2). Regarding China the evidence is mixed and often relative to specific areas of the country (Table 1). Overall, as further described hereinafter, most recent results for the areas of China indicate regressivity. From this it appears that most analysed health systems had vertical equity issues. Regressivity was present in several OECD countries, in Asia in the Middle East and in Africa. It seems, however, worth noting that the data are relative to different years and that most results obtained for the OECD countries were obtained from data recorded during the 1990s and the early 2000s, whereas in most non-OECD countries there is more recent evidence (Table 1). Despite limitations, this is a rather new way of showing results as having an overall big picture is more intuitive and useful to summarize results.
Figure 2: Vertical equity by country.
Data Source: last available estimates from the literature reported in Table 1. Figure 3: Year of the last available estimates by country
The following sections describe the results. Section 3.1 surveys on the main methods used for measuring vertical equity. Section 3.2 and 3.3 discuss on the evidence found at country level by distinguishing between OECD and Non-OECD countries.
3.1 Methods for measuring vertical equity in health
The analysis of Lorenz dominance is the most general method for measuring progressivity [50]. However, it does not provide a measure of the magnitude of progressivity, which can be useful when comparing equity across countries or, within a country, across regions [33]. This is why the Kakwani index is the most used measure of progressivity in both tax literature and health financing [22]. The method estimates how the distributional effect of taxation is influenced by changes in tax rates while progressivity is held constant, and vice versa. Furthermore, the method allows to estimate the relative contribution of individual taxes and expenditure items to the overall progressivity of the system [22]. The first estimates available in the literature were comparative analysis at European level based on various sources of national microdata, predominantly surveys on household consumption. The progressivity indices were estimated at the national level based on the Kakwani methodology [43],[49]. This was further updated in terms of both methodology and data [45],[50].The methodology was improved by considering households of different sizes and structures, as well as by obtaining a greater comparability of the variables representing income and healthcare financing sources [12]. Furthermore, a better classification of the different types of health care payments was adopted and data on the financing mix of the various countries were updated [12].
In more recent years, there has been growing evidence for Non-OECD countries [33]. Financing of health care in low-income countries is characterized by the dominance of direct payments, given the relative lack of advanced payment mechanisms, such as tax-based systems and health insurance. Therefore, unlike with the case of OECD countries, many studies focus on the incidence of catastrophic out-of-pocket expenditure [54]. Households without complete health insurance coverage run the risk of incurring huge medical costs if they get sick. This uninsured risk reduces well-being. In addition, if a family member becomes ill, the direct purchase of medical care could compromise the material standard of family life. If health costs are high compared to the resources available to the family, this worsening of living standards can be considered catastrophic. In this sense, the concept of equity in healthcare financing implies that households should be protected against such catastrophic medical expenditures [38],[54]. As the target of this analysis is to collect evidence on vertical equity, studies analysing catastrophic health care expenditures were included in the survey only when they were part of an assessment of the vertical equity of the overall health financing system. Finally, one paper we scrutinized for inclusion in the review is based on the Atkinson method [52]. An alternative way of measuring equity is based on the Atkinson [52] methodology aiming at: (1) measuring fairness in the accessibility to health services; and (2)
measuring the impact of health insurance programmes on equity. As this method is not strictly linked to the progressivity of health services financing sources, we decided to exclude it, but we chose to mention its methodology here briefly as it could be used for linking both the use of health care services and its financing. Appendix 1 provides details on the surveyed methods.
3.2 Evidence on vertical equity in OECD countries
The first inter-country comparison based on the method developed by Kakwani is an application of the analysis of tax progressivity in four OECD countries: Australia, Canada, the UK and the US [22]. Results show that there were relatively small differences in the degrees of income inequality both before and after tax with the exception of the US showing markedly higher levels [22]. The degree of tax progressivity was variable across countries. The results clearly showed an appreciable decline in the degree of tax progressivity in all countries, the fall being greatest in the UK [22]. Based on KI methodology, Wagstaff, van Doorslaer [49] in their first work compare healthcare financing systems and their progressivity characteristics in 10 OECD countries.
This work distinguishes among three types of health systems: those mainly financed through general taxation such as Denmark, Portugal and the UK; those mainly based on social insurance (France, The Netherlands and Spain); those that are predominantly private (Switzerland and the US). Results show that the first financing method tends to be proportional or moderately progressive, while the second appears moderately regressive; finally, the third type of financing is mostly regressive. Overall, the study shows that in most countries the out-of-pocket component of health financing is highly regressive [49]. Wagstaff et al. [50] extends in a number of directions for the years between 1987-1993, on the progressivity of healthcare financing systems. This paper improves on the methodology used, obtains a greater degree of comparability between countries in the definitions of the variables and include two more countries in the analysis. Progressivity is still measured by using KI. The results confirm previous findings, with the difference that in Denmark and Spain direct taxes appear more progressive than in previous studies [50]. In contrast, direct taxes in Sweden and Switzerland appear to be less progressive than before. Indirect taxes in Denmark, the Netherlands and Sweden appeared to be less regressive than before, while they become more regressive in Switzerland [50]. In Spain indirect taxes become regressive as a result of value added tax among sources of financing, while in previous results they appeared as progressive [50]. Overall, in all countries except one (Spain), the KI for private insurance decreased. In all countries except Sweden, the KI for out-of-pocket payments had fallen in size [50]. In a companion paper published on the same issue of JHE, van Doorslaer and Wagstaff [45], starting from the total redistributive effect calculated from KI obtained in the previous work [50], decomposed with the AJL method [4], the overall effect in vertical, horizontal and reranking components. Results show that the vertical effect (unequal treatment of unequals) is far more important, in terms of redistributive effect, than differential treatment, but for private sorces of financing.
Lairson et al. [27] analyse the equity in healthcare financing in Australia and compare it with Europe and the United States. Vertical equity is measured via a concentration index estimated for both income and health care payments using data for the period 1998-1999. The financing system appears to be slightly progressive, despite about 30% of the payments coming from regressive private sources [27]. The equity levels are similar to those of many European countries and higher than in the US. Ketsche et al. [23] use the Annual Social and Economic Supplement to the Current Population Survey (CPS) from March 2005 and 2006 to estimate Kakwani measures of progressivity for 2004 and compare progressivity overall and across payment sources (e.g. federal versus state, public versus private) to previous results for the US system [50]. The overall incidence of US healthcare financing was still regressive but with a lower KI (ranging from 0.0 to 0.06 in 2004 vs -0.13 in 1987). The reason for this according to the Authors was that the share of total financing that is public has grown between 1987 and 2004 and at the same time there has been a marked decline in the OOP share of funding. The public sector component of financing was progressive (0.15) because of the dominance of federal spending (0.20) over state spending (0.03). Oppositely, PHI (-0.12) and OOP (-0.40) burden was higher for low income populations and represented 42% of all spending being responsible for the overall system regressivity trend. At the state level the KIs appear different from the measures for the overall burden of the system. The lowest quintile of the population in California and New York showed a higher absolute financial burden than in Florida and Texas. The authors stress the need of monitoring state variations in vertical equity after the introduction of the Patient Protection and Affordable Care Act (PPACA) of 2010 revising on the light of the new types of taxes, the subsidies for private premia and OOP, and the changes in coverage levels created through the reform.
Oppositely to the US case, healthcare financing in Finland in the early 1990s was distributed progressively [24]. This result is due to the dominance of the two progressive sources: direct taxation and sickness insurance contributions over the regressive (OOP and indirect taxation).
Hajizedeh et al. [18] analyse the distribution of healthcare financing in Australia for nearly four decades using data from Australian Taxation Statistics and Household Expenditure Surveys for the period between 1973-2010. The authors estimate the KIs for four sources of healthcare financing: general taxes, family payments for the Medicare programme, additional payments to Medicare and direct payments from consumers; and estimate the effects of major policy changes on them. The results show that the first three of these sources of healthcare financing are progressive, while the distribution of direct payments is regressive [18]. Furthermore, neither the introduction of "Medicare" in Australia in 1984 nor the "Extended Medicare Safety Net" in 2004 had significant effects on the progressivity of healthcare financing in Australia [18]. Instead, the Lifetime Cover- introduced in 2000 to encourage people to buy and hold private health insurance - has had a progressive effect on healthcare financing [18].
De Graeve and Van Ourti [15] review the distributional implications of alternative healthcare financing arrangements in European countries and the US by using KI methodology, at the household level. The period of analysis ranges from 1987 to 1997. In most European OECD countries,