Contents
Foreword 6
The ideal tensile strength of tungsten and tungsten-rhenium alloy by
first-principles calculations 7
S. Giusepponi, M. Celino
Structure of metal dioxide nanoparticles and investigation on the origin of
their structural disorder 13
R. Grena
Ab-initio modeling of methane adsorption at Ca impurities on a carbon
nanotube side-wall 17
F. Gala, G. Zollo
A Generalized Turbulent Combustion Model for Large Eddy Simulation of
Turbulent Premixed Flames 32
E. Giacomazzi, D. Cecere, F. R. Picchia, N. M. Arcidiacono
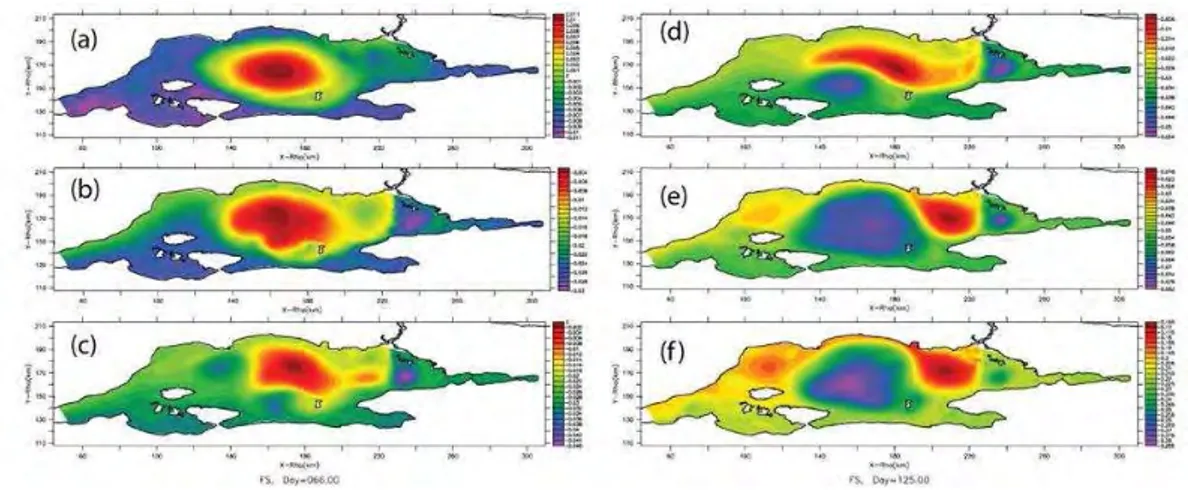
Modelling the exchange flow dynamics through the Turkish Strait System 37
G. Sannino, A. S¨ozer, E. ¨Ozsoy
Voting Dynamics as an Open Problem in Non–equilibrium Statistical
Me-chanics 42
F. Palombi, S. Toti
Benchmark of the CPMD code on the CRESCO clusters in ENEA-GRID
environment 49
R. Vujasin, J. G. Novakovic, N. Novakovic, S. Giusepponi
Activities made by the MoLNaC (Molecular Lab for Nanomaterials and
Catalysis) 56
L. Cavallo, G. Milano, A. Correa, R. Credendino, M. Byskin, A. De Nicola, F. Ragone, L. Falivene, A. Pizzirusso, A. Poater
Simulation of the adsorption mechanism of titanium-binding peptide to
TiO2 anatase surface 61
L. Agosta, C. Arcangeli, F. Buonocore, M. Celino, F. Gala, G. Zollo
CFD investigation of advanced cooling techniques in gas turbine blades 67
D. Borrello, F. Rispoli, P. Venturini, A. Salvagni
Direct Numerical Simulation of a premixed CH4/H2− Air slot flame 72 D. Cecere, E. Giacomazzi, F. R. Picchia, N. Arcidiacono
Nuclear Analysis of the ITER Cryopump Ports 80
F. Moro, R. Villari, D. Flammini, S. Podda
Structural and energetical analysis of a prismatic cadmium sulfide
nan-ocluster 86
E. Burresi, M. Celino
First principles study of the stability of Graphane deposited on a copper
surface using QUANTUM-ESPRESSO on CRESCO HPC 91
F. Buonocore
First-principle study of amorphous germanium under pressure 97
G. Mancini, M. Celino, A. Di Cicco
Icosahedral structure and mean-square displacement in Cu64Zr36 metallic
glass 106
J. Zemp, M. Celino, J. F. L¨offler, B. Sch¨onfeld
Particle simulation of Alfv´en mode dynamics in nuclear fusion devices 112
S. Briguglio, G. Fogaccia, G. Vlad, X. Wang
Structural, electronic and optical properties of low dimensional systems 117
A. Mosca Conte, C. Violante, V. Garbuio, I. Kupchak, M. Marsili, P. Gori, O. Pulci
Validation of the Monte Carlo model of TAPIRO Fast Reactor using
MC-NPX on ENEA-GRID/CRESCO facility 122
N. Burgio, A. Santagata, M. Frullini
Benchmark performances of CRESCO4 HPC system 129
F. Ambrosino, A. Funel, S. Giusepponi, G. Guarnieri, G. Ponti
The new ENEA CRESCO3 and CRESCO4 HPC systems 144
F. Ambrosino, G. Bracco, A. Colavincenzo, A. Funel, G. Guarnieri, B. Mas-troianni, S. Migliori, G. Ponti
Progress on Inertial Confinement Fusion studies 152
A. Schiavi, A. Marocchino, S. Atzeni
Application of the MINNI Atmospheric Model System (AMS) at high
res-olution over Italy 155
M. Adani, G. Briganti, A. Cappelletti, M. D’Isidoro, M. Mircea, L. Vitali
Electronic properties at complex interfaces 163
Dynamical Downscaling of GCM Seasonal Forecasts over the Greater Horn
of Africa 168
S. Calmanti, M. V. Struglia
Synchronization phenomena in complex networks 174
J.A. Almendral, S. Boccaletti, R. Guti´errez, I. Leyva, J. M. Buld, A. Navas, I. Sendi˜na-Nadal
Use of Monte Carlo to Evaluate Signal and Radiation Damage to Corium
Detector in PWR Severe Accident Scenario 179
K. W. Burn
Boosting conformational sampling in lipid bilayer simulations using
Hamil-tonian Replica Exchange 183
C. Cardelli, A. Barducci, P. Procacci
Nuclear Analysis for ITER TBM PORT #16 192
B. Caiffi, R. Villari
Simulation of a Square Boiling Channel Using NEPTUNE CFD 198
A. Cervone
CFD testing of a conventional gas turbine burner operating in oxy-fuel
combustion 203
G. Calchetti, A. Di Nardo
Contributions to CRESCO Annual Report 2013 208
F. Paglia, D. Schiariti
Sodium fast reactor core design using MCNPXTMcode and CRESCO HPC
infrastructure 212
C. Parisi, G. Abbate, B. Fresilli
Hydrogen diffusion in rutile TiO2 217
R. Vujasin, J. G. Novakovi´c, S. Giusepponi, N. Novakovi´c
CeO2 electronic properties from first principles: an introductory study 223 F. Rizzo, G. de Marzi, L. Morici
Magneto-Thermo-Structural optimization of the Large-Bore 8T
Supercon-ducting Magnet for the Nafassy Test Facility 229
Foreword
During the year 2013 CRESCO high performance computing clusters have provided more than 27 million hours of ”core” computing time, at a high availability rate, to more than one hundred users, supporting ENEA research and development activities in many relevant scientific and technological domains. In the framework of joint programs with ENEA researchers and technologists, computational services have been provided also to academic and industrial communities.
This report, the fifth of a series started in 2008, is a collection of papers illustrating the main results obtained during 2013 using CRESCO HPC facilities in various fields as material science, computational fluid dynamics, climate research, nuclear technology, plasma physics, complex system physics and biophysics. The report shows the variety of the applications of high performance computing, which has become an enabling technology for science and engineering.
ENEA Portici Research Centre near Naples is the location hosting the main ENEA com-putational resources since 2008. This is a result of the CRESCO Project (Comcom-putational Centre for Research on Complex Systems), co-funded, in the framework of the 2001-2006 European Regional Development Funds Program by the Italian Ministry of Education, University and Research (MIUR).
The Project CRESCO provided the resources to set up the first HPC x86 64 Linux cluster in ENEA, achieving a computing power relevant on Italian national scale (it ranked 126 in the HPC Top 500 June 2008 world list, with 17.1 TFlops and 2504 CPU cores). It was later decided to keep CRESCO as the signature name for all the Linux clusters in the ENEAGRID infrastructure which integrates all ENEA scientific computing systems, and is currently distributed in six Italian sites.
In 2013 the ENEAGRID computational resources attained the level of 6000 computing cores (in production) and other 5000 in the final test phase. The raw data storage reached 900 TB. Both values show an increase of factor 3 in respect to the past and the increase was made possible by various projects, LAMRECOR, IT@CHA, TEDAT and VIS4FACTORY - funded by MIUR in the framework of the 2007-2013 European Regional Development Funds Program. More specifically, in 2013 the cluster CRESCO3, 2016 AMD cores, was opened to users and a new cluster CRESCO4, 4864 Intel cores, 100 TFlops peak, was installed and certified, being ready for service in 2014.
The success and the quality of the results produced by CRESCO stress the role that HPC facilities can play in supporting science and technology for all ENEA activities, national and international collaborations, and the ongoing renewal of the infrastructure provides the basis for a similar role in the forthcoming years.
Unit`a Tecnica Sviluppo Sistemi per l’Informatica e l’ICT Il Gruppo di Lavoro CRESCO
The ideal tensile strength of tungsten and
tungsten-rhenium alloy by first-principles
calculations
Simone Giusepponi1∗, Massimo Celino2
1ENEA, UTITC-HPC C.R. Casaccia
Via Anguillarese 301, 00123 Rome, Italy
2ENEA, UTMAT-DIAG C.R. Casaccia
Via Anguillarese 301, 00123 Rome, Italy
Abstract. Both mechanical and structural properties of bcc crystal tungsten in presence of different concentrations of rhenium substitutional defects has been investigated by using accurate first-principles total energy methods based on density functional theory.
1
Introduction
There is a widespread consensus in considering tungsten (W) and W alloys as good candi-dates for structural and shield material in the future nuclear fusion reactors [1, 2]. Indeed W alloys are characterized by thermal properties, such as good thermal conductivity, high melting temperature and low sputtering erosion, of great interest in fusion applications. The main requirement on tungsten materials for structural applications is to be ductile within the operation temperature range. An armor material needs high crack resistance under extreme thermal operation conditions [3, 4] and compatibility with plasma-wall interaction phenomena [5].
Thus a deep understanding of the mechanical properties of W and of their atomic-scale modifications in presence of impurities is unavoidable step for the use of W under extreme conditions. In this framework, the determination of the ideal tensile strength, that is an inherent property of materials, can help to identify those aspects of mechanical behavior that are tightly linked to crystal structure and bonding. However, the ideal tensile strength represents the stress at the elastic instability, thus only an upper limit to the yield strength in real materials mainly affected by the complex interplay of defects, such as dislocations and cracks.
Figure 1: Simulation cell of the crystalline structure, tungsten atoms are the gray spheres, rhenium atoms are the red spheres: a) crystalline tungsten b) one substitutional Re atom; c) two 1NN substitutional Re atoms; d) two 2NN substitutional Re atoms.
2
Computational details
The first-principles PWscf (Plane-Wave Self-Consistent Field) code of the Quantum Es-pesso suite has been used [6, 7] to accurately characterize W properties. PWscf performs many different kinds of self-consistent calculations of electronic-structure properties within Density-Functional Theory (DFT), using a Plane-Wave (PW) basis set and pseudopoten-tials (PP) [8, 9]. A reliable physical model for W has been developed to accurately compute lattice parameters, bulk modulus, enthalpy of atomization and ideal tensile strengths of W and W alloy with different concentrations of Re. We used the W and Re Goedecker norm-conserving pseudopotentials [10, 11, 12] with Perdew-Burke-Ernzerhof (PBE) [13] approximating GGA exchange–correlation potential, available in the Quantum Espresso library [7]. 6 and 7 electrons are explicitly taken into account in the wave functions for tungsten and rhenium atoms respectively. All the calculations are performed in the su-percell approximation with periodic boundary conditions meant to mimic an infinitely extended system. We considered a cubic supercell composed by a 4×4×4 array of bcc conventional cells and 128 W atoms. The electronic wave functions were expanded in a plane-wave basis set with a kinetic energy cut-off equal to 80 Ry and a 3×3×3 Monkhorst-Pack mesh of k points was employed [14]. We used Marzari-Vanderbilt smearing [15] with a width of 0.008 Ry. The kinetic energy cut-off, the k sampling and the smearing width were optimized by preliminary calculations on tungsten and rhenium pseudopotentials.
As shown in Fig.1, the role of rhenium substitutional defect in tungsten bulk is investigated removing one and two W atoms respectively.
Thus we considered four systems:
a) Tungsten without defects: a supercell of 128 W atoms (Fig. 1a);
b) One substitutional defect case: a supercell of 127 W atoms in which a W atom is replaced with one Re atom (Fig. 1b);
c) Two substitutional defects 1NN case: a supercell of 126 W atoms in which a couple of first–nearest–neighbor (1NN) W atoms are replaced with two Re atoms (Fig. 1c). The replaced atoms are in the [1 1 1] direction at distance √23a0;
d) Two substitutional defects 2NN case: a supercell of 126 W atoms in which a couple of second–nearest–neighbor (2NN) W atoms are replaced with two Re atoms (Fig. 1d). The replaced atoms are in the [1 0 0] direction at distance a0.
a0 is the lattice constant of the W bcc crystal structure at zero temperature and zero loading.
By using first-principles zero–temperature total energy calculations we computed lattice constant a, bulk modulus B, enthalpy of atomization Ha as described in Ref. [16]. More-over, repeating the procedure used in Ref. [16], we calculated the ideal tensile strength σm plotting the energy per atom E − E0 versus strain ǫ (see Fig. 2), where E0 is the ground-state energy of the unloaded material. E is the total energy of the loaded system in the relaxed condition. The relaxed condition for the crystalline structure is achieved when, after elongation along the loading axis by a fixed amount ǫ (unrelaxed condition), except that in the tensile direction (relaxed condition) all the others components of the stress tensor vanish. This procedure is adopted for the test-cases to ensure optimal uniaxial loading.
This approach was repeated for bcc tungsten and for tungsten with different concentration of rhenium, to obtain the total energy-strain relations shown in the Fig. 2. The ideal tensile strength σm corresponds to the maximum of the stress-strain relation, and it is related to the inflexion point in the total energy-strain relation. We fitted total energy-strain relation with a polynomial cubic function to determine its inflexion point (by vanishing of the second order derivative) corresponding to the the strain ǫm, and then the σm value. The behavior of the energy per atom E − E0 versus ǫ along the loading axis is shown in Fig. 2. Green symbols are the energies in unrelaxed conditions, black symbols are the energies in relaxed conditions and black solid lines are the cubic fitting functions.
2.1 Results and discussion
The calculated equilibrium lattice parameter for bcc W is a0= 3.23 ˚A and the cal-culation for the bulk modulus gives B= 282.2 GPa. The enthalpy of atomization is Ha= 882.9 kj/mol and the values of the ideal tensile strength and related strain in the [0 0 1] direction are σm= 26.34 GPa and ǫm= 13.6% respectively. The full set of our results
0 0.4 0.8 a) b) 0 0.1 0.2 0.3
ε
0 0.4 0.8E - E
0
(eV)
c) 0 0.1 0.2 0.3 d)Figure 2: Total energy E − E0 per atom versus strain ǫ for uniaxial deformation: a) crystalline tungsten; b) one substitutional Re atom; c) two 1NN substitutional Re atoms; d) two 2NN substitutional Re atoms. E0 is the ground-state energy of the systems. Energies for unrelaxed conditions are shown in green symbols, those for relaxed conditions are shown in black symbols. Solid lines are the fitting functions.
for tungsten are reported in the first row of the Table 1. Having checked the reliability of our numerical model, we study the structural and mechanical properties of tungsten with different concentrations of rhenium to understand their effects on bulk properties.
In all the considered cases the substitution of tungsten atoms with rhenium atoms does not cause variation in the sizes of the systems. The value of the lattice parameter remains the same a0= 3.23 ˚A. The enthalpy of atomization is slightly influenced by the point defects, the values of Ha are in the range 882.9-883.4 kj/mol. However, we observe an increase of Ha with the number of substituted atoms. On the contrary the presence of substitutional defects affects the values of bulk modulus B, ideal tensile strength σm and related strain ǫm.
In the case b) in which a single W atom in replaced with a Re atom, the bulk modulus B is reduced of about 0.2%: from 282.4 GPa for pure W system to 281.8 GPa. We also observe a decrease of about 1.3% in the ideal tensile strength σm: from 26.34 to 26.01 GPa. The results are reported in the second row of the Table 1. The behavior of the energy per atom versus strain along the crystallographic axis [0 0 1] is shown in Fig. 2b.
When two first neighbours W atoms are removed in [1 1 1] direction to create the 1NN sub-stitutional Re atoms cluster, the reduction of the bulk modulus B from 282.4 to 281.4 GPa is raised with a decrease of about 0.35% (see third row of the Table 1). Also the reduction
Table 1: Calculated values of lattice parameter a, bulk modulus B, enthalpy of atomization Ha, ideal tensile strength σm and related strain ǫm for the four systems of Fig. 1.
system a (˚A) B (GPa) Ha (kj/mol) σm (GPa) ǫm (%)
a) 3.23 282.4 882.9 26.34 13.6
b) 3.23 281.8 883.2 26.01 12.9
c) 3.23 281.4 883.3 25.62 11.9
d) 3.23 281.4 883.4 25.68 11.5
of the ideal tensile strength σm is valuable of consideration: from 26.34 to 25.62 GPa (about 2.7%). In Fig. 2c it is shown the dependence of the energy versus the strain along the crystallographic axis [0 0 1].
The final case is when we remove two W atoms in [1 0 0] direction to have the 2NN substitutional Re atoms cluster. The value of the bulk modulus B= 281.4 GPa is the same as that of the 1NN substitutional Re atoms case. Also the ideal tensile strength σm= 25.68 GPa is close to the previous case with a decrease of about 2.5% compared to the tungsten system without point defects (see fourth row of the Table 1). In Fig. 2d it is shown the dependence of the energy versus the strain along the crystallographic axis [0 0 1].
In conclusion the substitution of tungsten atoms with rhenium atoms causes a variation in the mechanical properties of the material. The reduction in the values of the bulk modulus B are less than 0.5%, more evident are the decreases in the values of the ideal tensile strength σm that are in the range 1.3-2.7%. Moreover, it is interesting to note the linear increase of the value of the variations with the number of substituted atoms.
References
[1] Rieth M. et al. J. Nuc. Mater. 442 (2013) S173. [2] Rieth M. et al. J. Nuc. Mater. 432 (2013) 482. [3] Wittlich K. et al. Fusion Eng. Des. 84 (2009) 1982.
[4] Hirai T., Pintsuk G., Linke J., Batilliot M. J. Nucl. Mater. 390-391 (2009) 751. [5] Roth J. et al. J. Nucl. Mater. 390-391 (2009) 1.
[6] Giannozzi P. et al. J. Phys.: Condens. Matter. 21 (2009) 395502. [7] www.quantum-espresso.org
[9] Kohn W., Sham L. J. Phys. Rev. 140 (1965) A1133.
[10] Goedecker S., Teter M., Hutter J. Phys. Rev. B 54 (1996) 1703. [11] Hartwigsen C., Goedecker S., Hutter J. Phys. Rev. B 58, (1998) 3641. [12] Krack M. Theor. Chem. Acc. 114 (2005) 145.
[13] Perdew J. P., Burke K., Ernzerhof M. Phys. Rev. Lett. 77 (1996) 3865. [14] Monkhorst H. J., Pack J. D. Phys. Rev. B 13 (1976) 5188.
[15] Marzari N., Vanderbilt D., De Vita A., Payne M. C. Phys. Rev. Lett. 82 (1999) 3296 [16] Giusepponi S., Celino M. J. Nucl. Mater. 435 (2013) 52.
Structure of metal dioxide nanoparticles and
investigation on the origin of their structural
disorder
Roberto Grena∗
ENEA UTRINN-PCI C. R. Casaccia, Via Anguillarese 301, 00123 Rome (Italy)
Abstract. The structure of nanoparticles with a diameter around 2 nm of three metal dioxides (TiO2, ZrO2, CeO2) is investigated, checking two hypotheses for the different
levels of structural disorder found in the three nanoclusters.
1
Introduction
Metal dioxide nanoparticles attracted much interest due to studies and applications in var-ious fields, such as electronics, energy generation, use as additives in nanofluids or other materials, and study of their biological effects. However, the structure of oxide nanoclus-ters of size lower than few nanomenanoclus-ters remains elusive. Beside the complex polymorphism often shown by bulk metal dioxides, another cause of difficulties is the unusual form of structural disorder that can appear below a certain size, and substantially modifies the properties of the material, so that clusters cannot simply be considered as small pieces of bulk material. The problem of determining the structure of nanoparticles is far from being solved to date [1]. In particular, the structural deviations relative to the ideal structure are not well characterized because no experimental techniques, X-ray and neutron diffraction for instance, can give univocal information for such small objects [2]. Consequently, this problem cannot be tackled with experimental methods only but needs extra-information coming from theoretical modeling methods. An example of the difficulties and variability of the nanocluster structure can be observed considering the difference between ZrO2 and TiO2nanoclusters. TiO2is a well-studied material for catalysis and energy applications; it is a well known fact that, despite the greater stability of rutile structure for bulk material, nanoparticles assume anatase structure, maintaining a fairly ordered crystalline structure. The anatase structure is clearly recognizable even for extremely small clusters (¡ 1 nm), as shown by computations [3]. The situation is completely different for ZrO2: despite the similarity of the chemical properties of Zr and Ti, recent studies [4] shows that small clusters (around 1.3 nm) of ZrO2 does not preserve any regular structure, and the most stable configurations seems to be amorphous.
Different hypotheses can be made on the origin of the different behaviour: from structural considerations (anatase structure is very different from the tetragonal structure favoured by ZrO2 clusters of larger size), to chemical considerations (Ti, beside the ”natural” oxi-dation number 4, can easily assume oxioxi-dation number 3, while Zr with oxioxi-dation state 3 is more unstable). So, in order to investigate the question, an oxide with structural properties similar to ZrO2 of a metal which can easily assume oxidation number 3 should be consid-ered: if the nanocluster results disordered the first hypothesis (structural differences) is the most likely one, while if the cluster retains its order the second hypothesis (chemical differences) is corroborated. The choice fell on CeO2. So, the study of three nanoclusters (TiO2, ZrO2, CeO2) was started. A stoichiometric, roughly spherical nanoparticle, with a size slightly below 2 nm, was chosen for each of the three materials. The nanoparticles are quite ”large” for ab-initio simulations (342 atoms for TiO2, 314 atoms for the other two oxides) and are near the upper limit of the computational possibilities with standard DFT (no linear-scaling) methods. The choice of ”large” clusters was made for two reason: the first reason is the desire to study existing objects (metal oxide nanoparticles below 1.5 nm are not realistic), the second reason is to emphasize the different behaviours of the materials (with smaller clusters all the materials exhibit a certain amount of amorphiza-tion, and larger clusters become fairly ordered for all the materials; a size around 2 nm is in the range in which the different behaviours are more striking). The comparison among the results will give an indication on the origin of the structural disorder.
2
Methods
The study of the clusters was made using Car-Parrinello molecular dynamics as an opti-mization tool, since standard geometrical optiopti-mizations (BFGS/GDIIS) was too unstable when dealing with such large systems. Quantum Espresso software was used [5]. In the optimization, the cluster evolves according to a fictitious molecular dynamics with a ther-mostat at a very low temperature (10 K), in order to achieve a local energy minimum with a smooth dynamics. The computations are heavy: the computation of a minimum requires from 20 to 80 24-hour runs (depending on the disorder of the cluster: if the struc-ture is far from the crystalline strucstruc-ture, longer computations are needed) on 288 CPU cores. The computation of a single minimum is not sufficient, since it could be only a local minimum; so, cycles of simulated annealing (heating-cooling cycles) are then made to find different minima. Even if it is not possible to find the global minimum for such large systems (unless the system retains a crystalline structure), the properties of the first 3-4 minima is sufficient to observe the tendency to disordered structures of the cluster.
3
Results
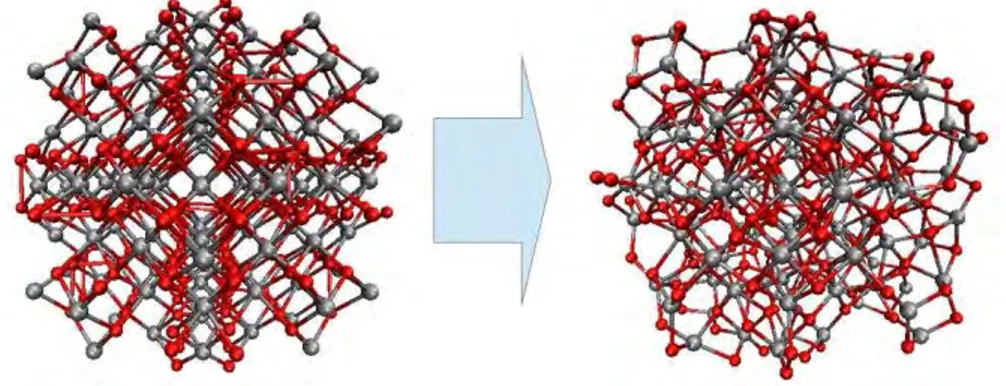
The first minima of the three structures found give a strong hints on the correct hypothesis on the disorder origin. The three structures found are shown in Fig. 1- 3 , together with the starting configurations. As expected, the TiO2structure retains its anatase structure, with only a rearrangement of the surface atoms. The study of ZrO2 confirms the tendency of
Figure 1: Structure of the TiO2 nanocluster: initial (left) and optimized (right) configu-rations.
Figure 2: Structure of the ZrO2 nanocluster: initial (left) and optimized (right) configu-rations.
Figure 3: Structure of the CeO2 nanocluster: initial (left) and optimized (right) configu-rations.
the cluster to disordered structures: this is not a trivial fact, since no ab-initio studies were made on such large clusters up to now, and the tendency to disorder was found considering a structure with about 1/3 of the atoms. So, we can conclude that increasing the size (up to 2 nm) does not stabilize the structure of ZrO2 and the tendency to disorder persists. The most interesting result is obtained for the CeO2 structure. The starting structure was the same of ZrO2 cluster; however, the minimization procedure took far less time and the resulting final structure is almost perfectly ordered. This fact shows that disorder
is more likely induced by the difference in chemistry than by structural properties. The differences in ordering between TiO2 and ZrO2 are not induced by differences in structure or coordination numbers, since a structure identical to ZrO2 structure (CeO2) produces clusters almost perfectly ordered. The difference is likely due to chemical difference. ZrO2 crystalline structure is disrupted since Zr atoms on the surface have a pending bond, and they have a strong tendency to saturate the bond; on the contrary, the other two elements can easily assume oxidation number 3, and this fact stabilizes the surface.
4
Conclusions
The preliminary results of the work allows to give useful hints on the origin of structural disorder in small size nanoclusters, discerning between two competing hypotheses (crystal structure or chemical differences). Of course, the work is far from complete: it is required a better definition of disorder (possibly quantitative), the investigation of other minima, and possibly the test of other metal dioxide to confirm the hypothesis. For example, it should be interesting to study a cluster with the same structure as TiO2 of a metal with chemical properties similar to ZrO2; unfortunately, anatase is not a common structure and no examples has been found. However, even the first results show the potential of the ab-initio methods for clarifying the origin of structural properties of nanoclusters.
References
[1] Juhas P., Cherba D. M., Duxbury P. M., Punch W. F., and Billinge S.L.J. Ab initio determination of solid-state nanostructure. Nature, 440:655–658, 2006.
[2] Billinge S. L. J. and Levin I. The problem with determining atomic structure at the nanoscale. Science, 316:561–565, 2007.
[3] Iacomino A., Cantele G., Ninno D., Marri I., and Ossicini S. Structural, electronic, and surface properties of anatase tio2 nanocrystals from first principles. Physical Review B, 78:075405, 2008.
[4] Grena R. Structure and molecular dynamics of a spherical cluster zr43o86. High performance Computing on CRESCO infrastructure: research activities and results 2010-2011, pages 179–186, 2012.
[5] Giannozzi P. et al. QUANTUM ESPRESSO: a modular and open-source software project for quantum simulations of materials. Journal of Physics: Condensed Matter, 21:395502, 2009.
Ab-initio modeling of methane adsorption at Ca
impurities on a carbon nanotube side-wall
Fabrizio Gala∗, Giuseppe Zollo
Universit`a di Roma “La Sapienza”
Dipartimento di Scienze di Base e Applicate per l’Ingegneria (Sezione di Fisica) Via A. Scarpa 14–16, 00161 Rome Italy
Abstract. Methane adsorption at Ca decorated single wall carbon nanotubes has been studied by ab-initio total energy calculation based on the density functional theory. The adsorption configurations have been studied using various exchange correlation energy functionals including also two possible long-range interaction correction schemes. Our calculations show that methane adsorption at Ca decorated carbon nanotubes is markedly enhanced when impurity atoms are considered as individual adsorption sites. We demon-strate that up to six CH4 molecules can bind at a single Ca impurity at room
tempera-ture. The phenomenon responsible of the measured adsorption energy is recognized as a Kubas-type interaction that involves the orbital overlap between the Ca d state and the methane σ molecular orbitals. The adsorption values obtained with the different energy functionals used are discussed showing that LDA, often employed in the recent literature for similar adsorption problems, is affected by severe limitations when orbital overlap and physisorption co-exist. Lastly the well known problem of Ca clustering is studied and discussed showing that, differently to the hydrogen case, it does not induce any molecular dissociation.
1
Introduction
Nanoporous carbon-based materials have been shown to be particularly attractive as solid media for gas storage purposes thanks to their large surface/volume ratio and peculiar geometry. Accordingly, both crystalline and disordered carbon nano-structures have been subject of investigation for gas supply and sensing [1], with remarkable emphasis on two carbon allotropes: single walled carbon nanotubes (SWCNTs) and graphene. The storage problem has been especially focused on gaseous species of interest for energetic applica-tions such as molecular hydrogen (H2) and methane (CH4). Concerning hydrogen, that is the most promising energy source alternative to fossil fuels, however, pristine carbon nano-structures have exhibited physical limits preventing them for practical use as hydro-gen storage media: indeed H2 molecules are weakly bound with a low adsorption heat on pristine carbon materials through long-range dipolar forces. As a consequence, when considered in the context of adsorption/desorption cycles of the so-called delivery process involving storage and release, pure carbon nano-structures are unfit for hydrogen storage
purposes [2]. Such limitations appear to be less stringent in the methane case due to the larger adsorption heat measured in carbon nano-structured media: it has been demon-strated, indeed, that H2-CH4 mixtures (hythane) can be stored in slitlike pores and CNTs achieving the volumetric stored energy threshold of 5.4 MJ/cm3 useful for alternative au-tomotive fuel systems as established by the US Freedom Car Partnership [1]. However, because methane is commonly employed as a precursor for SWCNT synthesis at high temperature, its storage in SWCNT media might be affected by dissociation phenomena occurring at the tube side-wall; this phenomenon, that should be taken into account as a source of atomic hydrogen chemisorption by methane catalytic dissociation, may affect the methane molecular stability for high temperature storage systems [3].
A common strategy to improve the carbon nanomaterials storage performance in the H2 case consists in decorating the nano-structures with light alkali metals, either of the first group, such as Li [4], or of the second group, such as Ca [5]. The latter solution has revealed as the most appealing due to the larger H2 binding energy on Ca than Li impurity sites in carbon nano-structures (roughly 17% more) as a consequence of a genuine nonclassical phenomenon: the so called Kubas interaction [6, 5]. In this case the binding occurs through the orbital hybridization involving the empty d states of the alkali metal and the σ orbital of the H2 molecule and is accompanied also by a charge back donation from the d state to the molecular H2 σ∗ antibonding state. The benefit of Ca doping, however, is affected by the marked tendency of Ca atoms to form metallic clusters [5] at the SWCNT side-wall thus altering dramatically the nature of the H2 adsorption process and causing the molecule dissociation. Atomistic modeling has demonstrated that Ca clustering can be suppressed on zig-zag graphene nano-ribbons (ZGNR) because individual alkali impurities are stably adsorbed on both sides of the zig-zag edge [7]. However a practical exploitation of this finding is still to come because large-area graphene structures have been obtained by chemical vapor deposition only on solid substrates so far [8, 9], making impractical the assumption of Ca atoms decorating both sides of a graphene sheet. While the Ca clustering problem is still an open problem, a question arises concerning the possible role played by Ca decorated carbon nanostructures in the methane adsorption: are Ca impurities able to enhance also the adsorption of methane molecules? And if so, at which extent? The answer to these questions would be important to characterize the uptake performance of alkali doped carbon nano-structured media, originally designed for hydrogen storage, also for the storage of methane and hytane.
Therefore, in this paper we have taken into consideration the possibility of enhancing the methane storage in SWCNT media by Ca doping and we have investigated if, similarly to the H2 case, a Kubas-type interaction between the involved orbitals arises that may increase the binding energy of the CH4 molecule on a SWCNT. Moreover, Ca clustering phenomena has been also considered concerning the way they affect the interaction between the methane molecules and the alkali doped SWCNT.
2
Theoretical Method
Methane adsorption at a semiconducting SWCNT decorated with a Ca atom, has been in-vestigated by ab-initio Density Functional Theory (DFT), together with norm-conserving
pseudopotentials, constructed using the Troullier-Martins scheme [10], and a plane wave basis set expansion scheme. The Ca semicore 3s and 3p states have been explicitly taken into account as valence shell in the construction of the corresponding pseudopotential. First-principles calculations have been performed using the QUANTUM-ESPRESSO pack-age [11], with an energy cut-off of 120 Ry for the wave functions and periodic boundary conditions (PBCs) have been employed together with a 1x1x3 Mokhorst-Pack k-point grid [12] for the Brillouin zone sampling. The adopted supercell is tetragonal with a = b = 30 ˚
A in the plane orthogonal to the tube axis. The supercell size along the tube axis has been chosen c = 8.45 ˚A i.e. two (11,0) CNT unit cells, when considering up to 2 methane molecules adsorbed while it has been increased to c = 12.69 ˚A i.e. three (11,0) CNT unit cells, for the cases involving n ≥ 3 methane molecules. The used k-point sampling scheme and supercell sizes have been checked for convergence giving a maximum error-bar of 8 meV (obtained in the case of the most crowded configuration) for the values of the ad-sorption energy that have been calculated and are reported below; this error is negligible with respect to the adsorption energy values obtained (see below).
It is commonly recognized that the Local Density Approximation (LDA) [13, 14] and Generalized Gradient Approximation (GGA) [15] schemes give respectively the lower and the upper bound values for the binding energies of weak interacting systems. Thus we have used both the schemes choosing the Perdew-Burke-Ernzerhof (PBE) formula [16] for the GGA case. While the LDA scheme is commonly used in adsorption problems because it has been found to behave surprisingly well, we have found, on the contrary, that the usage of the PBE exchange-correlation functional gives an unrealistic small value for the adsorption energy of a methane molecule on a bare SWCNT; this is basically due to the inadequacy of GGA schemes to treat long range Van der Waals (VdW) dispersion forces that are expected to play a major role in both the adsorption geometries and energetics of weak interacting surface/molecule systems; as a consequence, we have also used two correction schemes to handle long-range interactions using either a semi-empirical correction (vdw-D) [17] or a fully density functional approach that includes also an additional self-consistent dispersion interaction term (vdw-DF) [18, 19] in the context of the PBE XC functional scheme.
The ground state configurations have been fully relaxed using the Broyden-Fletcher-Goldfarb-Shanno (BFGS) method [20] together with the Hellmann-Feynman forces acting on the ions. The ionic minimization has been done until the convergence threshold of 0.001 a.u. on the total force was reached.
Previous investigations [5] have shown that the binding energy of Ca on CNTs has little to do with the chirality of the carbon nanotube and thus we have taken into account a semiconducting (11,0) SWCNT as a prototypical case for our study.
The adsorption energy of a Cam cluster on a SWCNT has been computed as: ECam
a = E(SWCNTCam) − E(SWCNTCam−1) − E(Ca) with m = 1, 2
while the adsorption energy of n CH4 molecules on a carbon nanotube decorated with a Cam cluster, has been calculated as:
E(m,n)a = E(SWCNTCa
3
Results and Discussion
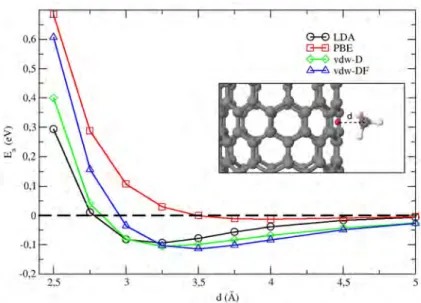
First of all the adsorption of a single methane molecule on a bare SWCNT has been considered. The focus on this case study, besides its obvious importance as a reference system for the adsorption of methane, has been oriented also to check the reliability of the schemes used, especially concerning the XC functional and the treatment of the long range dispersion forces. Thus we have checked the four schemes adopted, namely the LDA, the PBE, the semi-empirical (vdw-D) and the density functional (vdw-DF) corrected PBE, by calculating the total energy of the methane-SWCNT system statically (i.e. with no atomic relaxation) as a function of the CH4 distance d from the CNT side-wall.
The obtained adsorption energy values are reported in Fig.1 and show that PBE XC functional (red line) gives an unfeasible value of -15 meV of the adsorption energy at the wall minimum. LDA results (black line in Fig.1), on the contrary, seem much more robust with a well defined adsorption energy wall that is in agreement with the findings of methane adsorption on graphene reporting an adsorption energy evaluated at LDA level close to the experimental value [21]. Green and blue line in Fig. 1 report the vdw-D and vdw-DF results respectively.
The static curves obtained with the vdw-D and vdw-DF schemes coincide asymptotically, as expected, but show some differences at short distances even though the adsorption energy at the wall minimum are similar (respectively -0.1 eV and -0.11 eV) and close to the LDA value (-0.093 eV). The adsorption wall minimum occurs at 3 ˚A for LDA, 3.25 ˚A and 3.55 ˚A for vdw-D and vdw-DF respectively evidencing that the equilibrium distance of methane is at larger distance for PBE corrected schemes than for LDA. It is interesting to note that, while the LDA adsorption energy is below the PBE value in the whole range, Van der Waals corrected schemes evidence two domains: at short distance PBE corrected schemes overestimate the LDA results while at large distance the opposite occurs. Then the major difference between vdW-D and vdw-DF results are the methane equilibrium distance (the adsorption energy at this distance differ as well but at a smaller extent) and the short range behavior that, as expected, resembles the pure PBE behavior more closely for vdw-DF than for the semi-empirical corrected scheme. On the basis of the above considerations and on the fact that vdw-DF scheme imply only a moderate heavier workload, we have chosen to perform all the calculations involving also the Ca impurities using the LDA, the PBE and the vdw-DF schemes.
After accurate optimization run, the ground state configuration of one Ca impurity placed on the SWCNT side-wall has been found to be the ”hollow” one (i.e. the Ca impurity is located above the centre of a hexagon at the tube side wall) for each of the three different XC flavors used. The calculated adsorption energy values ECa1
a are -1.14 eV (LDA), -0.53 eV (PBE) and -0.23 eV(vdw-DF), evidencing a strong dependence on the XC functional chosen, the LDA value being double of the PBE one. The optimized geometries, on the contrary, are quite similar, with distances from the SWCNT sidewall of ∼ 2.1 ˚A (LDA), ∼ 2.2 ˚A (PBE) and ∼ 2.4 ˚A (vdw-DF). For all the XC energies considered, Ca adsorption results in a slight deformation of the nanotube, as well as in a charge transfer of ∼ 0.5 e
-from the Ca atom to the SWCNT, as shown by the L¨owdin population analysis performed on each of the ground state configurations studied.
Then we have addressed the problem of the adsorption of a single CH4 molecule on a Ca atom decorating the nanotube; again, the optimized structures are qualitatively similar, as evidenced by a comparison of the geometrical parameters indicated in Fig.2(a), whose values are reported, together with the corresponding adsorption energies, in Fig.1. The adsorption energy gain ∆Ea with respect to the case of methane absorption on a pristine nanotube is considerable; it is quite different in the three cases treated ranging from 60 meV in the vdw-DF case to 360 meV in the LDA case with the PBE case being intermediate with 165 meV. The charge on the Ca impurity measured for the three cases (between ∼ 0.40 e
-and ∼ 0.48 e
-) does not correlate with the energy gain data indicating that the phenomenon observed is not barely electrostatic and should be explained by orbitals interaction. The projected density of states (PDOS) of the ground state adsorption configurations of a methane molecule on a Ca decorated site on the (11,0) SWCNT side wall have been calculated for the three exchange-correlation functionals; and are reported in Fig.3. Here the projections on the Ca s, p and d valence orbitals and on the CH4 orbitals are reported for the three cases studied evidencing an overlap between the methane σ molecular orbitals (either the σss orbitals located near -15 eV or the σsp located near -8 eV) and the s, p and d states of the Ca atom. Indeed the Ca 3d state, that is the highest occupied molecular orbital (HOMO) found in the Ca decorated SWCNT, shows an increased electron population when CH4is adsorbed that is accompanied by and increased PDOS in the energy ranges where the methane σssand σsp molecular orbitals reside thus indicating the formation of hybrids involving the Ca d state and the methane orbitals. The above described orbital hybridization is quite similar to the Kubas-type interaction occurring in the hydrogen case and briefly described in the Introduction. Differently from the H2 case, however, we have measured an almost negligible charge back donation from the Ca d state to the methane σ∗ state near the highest occupied molecular orbital (HOMO), as evidenced in the inset of Fig.3; thus, differently from the hydrogen case, this circumstance seems to indicate that the methane molecular stability against dissociation (that might be caused by the interaction with the impurity) should be preserved.
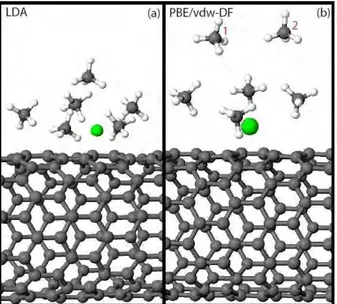
Subsequently we have obtained by accurate optimization the adsorption configurations on a Ca decorated SWCNT involving more than one CH4 molecule up to six. Up to five molecules adsorbed, the ground state configurations found are quite similar for the three X-C functionals used, except for the relative distances measured between the Ca impurity and the methanes; on the contrary, the ground state configuration with six methane molecules exhibits a different global geometry in the LDA case with respect to the other two.
The optimized geometry of two CH4 adsorbed at the Ca impurity is characterized by the two molecules lying in a plane orthogonal to the tube axis, and symmetrically placed with respect to the Ca atom; the Ca-CH4 distances are roughly equal to the corresponding ones reported in Table 1 for the single CH4 molecule. In the 3CHad4 optimized configuration, a third methane is located along the tube axis and the optimized configurations are slightly different in the three cases: using LDA, indeed, the Ca-CH4 distances are nearly equal for the three molecules being ∼ 2.7 ˚A for the other two XC functionals, instead, the Ca-CH4 distance is greater for the molecule along the tube axis (about 20% and 30% more for PBE and vdw-DF respectively) than the ones of the molecules in the plane orthogonal to
the tube axis. A similar trend is also found in the case with four CH4 molecules; here the optimized geometry is characterized by two couples of molecules: one couple is in the plane orthogonal to the tube axis and the molecules are symmetrical with respect to the Ca atom; the other couple is made of molecules placed along the tube axis at different distances from the Ca impurity. Three of the four molecules basically keep the same con-figuration found in the 3CHad
4 case while the Ca-CH4 distance of the fourth molecule, that is located along the tube axis, is much different from the others and varies with the XC functional employed in the optimization, ranging form 4.1 ˚A in the PBE case, to 4.6 ˚A in the LDA case. Due to the large distance measured between the Ca impurity and the fourth CH4 molecule, this configuration could be, in principle, affected by a larger interaction between methane molecules belonging to adjacent supercells; therefore we have further checked this configuration against the supercell size along the tube axis using a larger supercell with c = 16.93 ˚A. The configuration found does not differ significantly and the adsorption energy correction obtained is discussed below. The ground state configuration involving five CH4 molecules is nearly the same independently on the XC functional cho-sen with the fifth CH4 molecule occupying the top position above the Ca impurity. The distances of the methane molecules lying along the tube axis and in the plane orthogonal to it are quite similar to the 4CHad
4 case while the fifth top molecule is placed at a distance that is larger in the LDA and PBE cases (3.82 ˚A and 5.0 ˚A respectively) than the one in the vdw-DF case (3.25 ˚A); in particular it should be noted that the PBE case largely over-estimates such distance reflecting a marked inadequacy in such cases where chemisorption and physisorption coexists. In the 6CHad
4 case the optimized geometries are different; the LDA configuration shows five CH4 molecules arranged in a distorted pentagon centered on the Ca impurity (with relative Ca-CH4 distances of 2.73 ˚A, 2.74 ˚A, 2.83 ˚A, 2.83 ˚A, 4.77 ˚A) and the sixth CH4 molecule in the top position above the Ca atom at 3.78 ˚A from it (see Fig.4(a) for details); in both PBE and vdw-DF cases, on the contrary, the ground state configuration is obtained from a distorted 5CHad
4 configuration (as shown in Fig.4(b)) with relative distances of 2.84 ˚A, 2.85 ˚A, 3.60 ˚A, 4.32 ˚A, 5.90 ˚A, and 6.15 ˚A (2.94 ˚A, 2.95 ˚A, 4.40 ˚A, 4.64 ˚A, 5.03 ˚A, and 3.64 ˚A) in the PBE (vdw-DF) case.
The adsorption energy of the various configurations studied as functions of the number of methane molecules involved is reported in Fig.5(a). It is shown that the adsorption energy of nCHad
4 molecules at the Ca decorated SWCNT approaches a saturation value for n ≥ 6 for the PBE and the vdw-DF cases while the in LDA case no saturation occurs in spite of the large equilibrium distance measured, typical of a simple physisorption, concerning the last CH4 molecule added. Such a behavior is more clearly evidenced by drawing the adsorption energy of the last added molecule shown in Fig.5(b): the curves concerning both the PBE and the vdw-DF cases show, except for the first point, a monotonically increasing behavior of the adsorption energy that approaches zero: in the PBE case, the adsorption energy of the sixth added molecule is already quite small while in the vdw-DF case it is about 60 meV that is still larger than the thermal energy at RT indicating that, according to vdw-DF results, six methane molecule can stay adsorbed at the Ca impurity at RT. It must be emphasized, however, that the binding energy of the sixth methane molecule is lower than the one of a methane molecule at the SWCNT side-wall. Therefore it is likely that the methane adsorption starts at the Ca impurity where five molecules are adsorbed, then it proceeds at the SWCNT side-wall where the eventual
pristine adsorption sites are saturated and finally it completes with the sixth methane molecule at the Ca adsorption site. The usage of the PBE scheme, instead, does not catch the physisorption of the two last added molecules and therefore can be considered reliable only for adsorption configurations involving n ≤ 3 molecules where the orbital overlap play a mayor role in the adsorption configuration. The monotonic increasing behavior of the last adsorbed methane molecule that is expected to occur in such cases is completely missed with the LDA XC functional that, in the recent literature, has been often used in adsorption studies. The above results reported in Fig.5 show, on the contrary, that such scheme severely overestimates the binding energy and does not evidence the expected behavior concerning the adsorption energy. The measured Ca-CH4 distances for the vdw-DF cases concerning the configurations with five and six methane molecules show that these configurations are characterized by three ”short ranged” methane molecules with distances less than 4 ˚A and two or three long range molecules with distances greater that 4 ˚A. The PDOS of the configurations involving five and six molecules show that the ”long range” molecules barely interact with the Ca impurity via an enforced long range interaction that does not involve any orbital hybridization phenomenon (see Fig.6) while for the the three ”short range” molecules a Kubas-type interaction is responsible of the observed adsorption feature. Thus, the saturation of the adsorption energy when the number of CH4 molecules exceeds four is related to a less pronounced Kubas type interaction as evidenced by the PDOS involving the CH4 molecules that are arranged nearly above the Ca impurity shown in Fig.6: indeed we observe that the σsp molecular orbitals of the ”long range” methane molecule undergo a shift upward with respect to the Ca d-states in the energy range [-9,-6] eV confirming the absence of any orbital overlap, as also expected due to the relative distance. On the contrary the ”short range” top methane molecule still exhibits some overlap in the same range between the σsp methane molecular orbitals and the Ca d, p and s states. The binding energy of the long range molecules is definitely related to an enhanced electrostatic interaction due to the charge transfer involving the Ca impurity and the CNT. However when the number of CH4 molecules exceeds 4, the hybridization between the Ca d state and the CH4 σ states becomes less pronounced. As mentioned above, particular attention has been paid to the PBE (vdw-DF) case with n ≥ 4 because in these cases one physisorbed methane molecules is located along the axis at a distance from the Ca impurity larger than 4 ˚A. This circumstance could, in principle, affect the adsorption energy by a spurious interaction between CH4molecules belonging to adjacent supercells with respect to the one containing only three methanes. Therefore we have checked the adsorption configuration with n = 6 CH4 molecules in a larger supercell (see above) obtaining that such a such a spurious interaction affects the adsorption energy by only 10 meV, thus nearly the same error as the convergence error discussed in section 2. The same correction should be applied also to the n = 4 and n = 5 cases while it does not affect at all the n ≤ 3 cases. Hence the adsorption energy difference curve is slightly affected only for the n = 4 case.
The last deal addressed is the problem of the Ca2 clustering at the carbon nanotube side-wall that may affect the above described scenario when more impurity atoms are employed; the three XC functionals chosen give basically the same results, with a Ca-Ca distance ranging from 3.28 ˚A (LDA and PBE) to 3.32 ˚A (vdw-DF), while the distance between the Ca2 mid-bond and the tube sidewall is 1.82 ˚A (LDA), 1.94 ˚A (PBE), and 2.01 ˚A
(vdw-DF) respectively; the LDA case shows the lowest adsorption energy ECa2
a (-2.23 eV) with respect to the other two cases, namely -1.84 eV and -0.96 eV for the PBE and vdw-DF cases respectively, which also reflects the short distance measured between the dimer and the SWCNT sidewall in this case. On the other hand the binding energy of the Ca dimer, measured as Eb = E(SWCNTCa2)− E(SWCNT) − 2E(SWCNTCa) is almost constant,
being -0.737 eV (LDA), -0.781 (PBE), and -0.812 (vdw-DF) confirming the general trend of Ca atoms of being clustered on the sidewall of a nanotube instead of being individually dispersed on it.
Then we fully relaxed the configuration obtained from the previous one by adding a single methane molecule for each of the employed XC functionals. The obtained results exhibit a marked dependence on the XC scheme chosen with the PBE and vdw-DF cases substan-tially in agreement among each other concerning the optimized geometries, the adsorption energies and the PDOS while the LDA case is quite different: indeed the LDA adsorption energy value (reported in Table 2 together with the corresponding geometrical parameters shown in Fig.2(b) ) is much greater than both the PBE and vdw-DF corresponding values. The observed different behavior is clarified by looking again at the corresponding PDOS: while in the LDA case the stronger interaction is accompanied by the overlap between the methane molecular orbitals and the Ca s, p and d states, this feature is completely absent in the PBE and the vdw-DF cases indicating that in these cases there is no Kubas-type interaction (see Fig.7, the vdw-DF case, being qualitatively similar to the PBE case, has not been reported). The existence of a Kubas-type interaction in the LDA case is also evidenced by the reduced distance between the CH4 molecule and the Ca2dimer occurring in this case. On the basis of the above reported results, we can support the idea that the LDA features shown in the present case must be taken with care and that they are most likely artifacts due to the LDA inadequacy to represent such a complicated adsorption sce-nario where physi-sorption and orbital hybridization co-exist. We must notice, however, that for none of the adopted schemes, Ca clustering induces any weakening of the adsorbed molecule that, on the contrary, occurs for hydrogen molecules close to a Ca dimer at the SWCNT side-wall.
Indeed, differently from the case of H2 adsorption where the aggregation of the two Ca atoms results in the dissociation of the molecular hydrogen, here the Ca clustering results only in a marked reduction of the adsorption energy without any molecular dissociation. Such a reduction is basically due to the disappearing of any Kubas-type interaction for both the PBE and vdw-DF schemes and no hybridization between the Ca and CH4 states occurs.
There is, however, a certain similarity between the adsorption phenomena involving a CH4 molecule and a H2 molecule (at least at PBE/vdw-DF level) when they interact with a Ca decorated SWCNT, with either the same kind of interaction (i.e. the Kubas interaction) or the same problems (Ca clustering); such a similarity suggests that the possible solutions of the clustering problem, invoked through many different mechanism, that have been proposed for the molecular hydrogen storage problem (i.e. by doping the CNT with boron atoms or by producing defects on the SWCNT [5]) can be successfully employed also for the methane storage.
4
Conclusions
In conclusion, we have demonstrated, on the basis of ground state ab-initio calculations, that Ca decorated SWCNT can be employed as CH4 storage media because they evidence an improved methane uptake (up to six molecules) per Ca impurity. Similarly to the H2 adsorption case, the empty d states of Ca are mostly responsible of the enhanced adsorp-tion via a Kubas-type interacadsorp-tion involving the methane molecular orbitals and the s, p and d states of Ca. The employed XC functional schemes, namely LDA, PBE and van del Waals corrected PBE have been discussed critically evidencing the inadequacy of the LDA scheme, that is still employed in adsorption studies, in the 6CHad
4 case due to overbinding. Generally speaking, our results show that the electron exchange and correlation energy functionals commonly applied in density functional calculations (i.e. LDA and PBE) be-have differently, especially for what concerns the adsorption energies and the Ca clustering problem, which is the major limiting factor that reduces the application of carbon based nanostructures as solid tank fuels for molecular hydrogen or hydrocarbons. In presence of a gaseous methane environment, indeed, LDA predicts that Ca clustering does not prevent the occurrence of a Kubas-type interaction between a CH4 molecule and the Ca2 dimer, while, at PBE/vdw-DF level, Ca clustering suppresses such enhanced interaction. Moreover the XC functionals here employed, predict that up to six CH4 molecules can be adsorbed at a single Ca impurity being reasonably stable at room temperature, except for the PBE case. A critical evaluation of the presented results make us confident that the van der Waals corrected PBE results are consistent and reasonable while LDA results must be taken with care in such cases where physisorption and orbital overlap may coexist. Experimental results concerning Ca decorated SWCNTs for methane storage are highly desirable to confirm our predictions.
References
[1] Zollo G. and Gala F. Atomistic modeling of gas adsorption in nanocarbons. J.
Nanomat., 2012(32):152489–1–32, 2012.
[2] Bhatia S. K. and Myers A. L. Optimum conditions for adsorptive storage. Langmuir, 22(4):1688–1700, 2006.
[3] Bagolini L., Gala F., and Zollo G. Methane cracking on single-wall carbon nanotubes studied by semi-empirical tight binding simulations. Carbon, 50(9):411–20, 2012. [4] Dag S., Ozturk Y., Ciraci S., and Yildirim T. Adsorption and dissociation of hydrogen
molecules on bare and functionalized carbon nanotubes. Phys. Rev. B, 72(8):155404– 1–8, 2005.
[5] Lee H., Ihm J., Cohen M. L., and Louie S. G. Calcium-decorated carbon nan-otubes for high-capacity hydrogen storage: First-principles calculations. Phys. Rev.
[6] G. J. Kubas. Metal-dihydrogen and σ-bond coordination: the consummate exten-sion of the dewar-chatt-duncanson model for metal-olefin π bonding. J. Organomet.
Chem., 635(37):37–68, 2001.
[7] Lee H., Ihm J., Cohen M. L., and Louie S. G. Calcium-decorated graphene-based nanostructures for hydrogen storage. Nano Lett., 10(6):793–98, 2010.
[8] Wood J. D., Schmucker S. W., Lyons A. S., Pop E., and Lyding J. W. Effects of polycrystalline cu substrate on graphene growth by chemical vapor deposition. Nano
Lett., 11(8):4547–54, 2011.
[9] Park H. J., Meyer J., Roth S., and Sk´akalov´a V. Growth and properties of few-layer graphene prepared by chemical vapor deposition. Carbon, 48(7):1088–94, 2010. [10] Troullier N. and Martins J. L. Efficient pseudopotentials for plane-wave calculations.
Phys. Rev. B, 43(14):1993–06, 1991.
[11] Giannozzi P., Baroni S., Bonini N., Calandra M., Car R., Cavazzoni C., Ceresoli D., Chiarotti G. L., Cococcioni M., Dabo I., Dal Corso A., de Gironcoli S., Fabris S., Fratesi G., Gebauer R., Gerstmann U., Gougoussis C., Kokalj A., Lazzeri M., Martin-Samos L., Marzari M., Mauri F., Mazzarello R., Paolini S., Pasquarello A., Paulatto L., Sbraccia C., Scandolo S., Sclauzero G., Seitsonen A. P., Smogunov A., Umari P., and Wentzcovitch R. M. Quantum espresso: a modular and open-source software project for quantum simulations of materials. J. Phys.: Condens. Matter, 21(19):395502–1–19, 2009.
[12] Mokhorst H. J. and Pack J. D. Special points for brillouin-zone integrations. Phys.
Rev. B, 13(5):5188–92, 1973.
[13] Ceperley D. M. and Alder B. J. Ground state of the electron gas by a stochastic method. Phys. Rev. Lett., 45(4):566–69, 1980.
[14] Perdew J. P. and Zunger A. Self-interaction correction to density-functional approx-imations for many-electron systems. Phys. Rev. B, 23(32):5048–79, 1981.
[15] Martin R. M. Electronic Structure: Basic Theory and Practical Methods. Cambridge University Press, 2008.
[16] Perdew J. P., Burke K., and Ernzerhof M. Generalized gradient approximation made simple. Phys. Rev. Lett., 77(4):3865–68, 1996.
[17] Grimme S. Semiempirical gga-type density functional constructed with a long-range dispersion correction. J. Comput. Chem, 27(15):1787–99, 2006.
[18] Dion M., Rydberg H., Scr¨oder E., Langreth D. C., , and Lundqvist B. I. Van der waals density functional for general geometries. Phys. Rev. Lett., 92(4):246401–1–4, 2004.
[19] Rom´an-P´erez G. and Soler J. M. Efficient implementation of a van der waals den-sity functional: Application to double-wall carbon nanotubes. Phys. Rev. Lett., 103(4):096102–1–4, 2009.
[20] Fletcher R. A new approach to variable metric algorithms. The Computer Journal, 13(6):317–22, 1970.
[21] Thierfelder C., Witte M., Blankenburg S., Rauls E., and Shmidt W. G. Methane adsorption on graphene from first principles including dispersion interaction. Surf.
5
Tables
Table 1: Geometrical parameters, together with the adsorption energies for a relaxed CH4 molecule adsorbed on a SWCNTCa as a function of the XC correlation energy employed.
d1 (˚A) d2 (˚A) θ (◦) Ea (meV)
LDA 2.1 2.6 110 -460
PBE 2.2 2.8 113 -180
vdw-DF 2.4 2.9 102 -187
Table 2: Geometrical parameters for a relaxed CH4 molecule adsorbed on a SWCNT decorated with a Ca2 dimer as a function of the XC correlation energy employed.
dCa2 (˚A) d1 (˚A) d2 (˚A) θ (
◦) Ea (meV)
LDA 3.32 1.79 2.57 112.0 -350.9
PBE 3.28 1.94 4.61 95.9 -31.6
6
Figures
Figure 1: (Color online)Variation of the adsorption energy with respect to the distance between the CH4 molecule and the SWCNT sidewall.
Figure 2: (Color online) Methane molecule adsorbed on a Ca atom (a) and a Ca2 dimer (b) decorating the hollow position of a SWCNT. See Table 1 and Table 2 for the different values of the geometrical parameters of interest in the adsorption for the XC correlation energies employed in the optimization.
Figure 3: (Color online) PDOS over Ca and CH4 orbitals involved in the adsorption decorating a SWCNT for the three XC functionals chosen. The energy regions where the overlap between the Ca and CH4 orbitals occurs have been enlarged for the LDA case only, as for the other two XC functionals the situation is qualitatively the same. For the sake of clarity the insets have different scales, the HOMO level of the entire system has been set to zero, and last PDOS spectra have been convoluted with a gaussian function.
Figure 4: (Color online) Relaxed structures of the adsorption configurations involving six CH4molecules at a Ca decorated site of SWCNT in the LDA case(a) and in the PBE/vdw-DF case(b). The two methane molecules labeled as 1 and 2 in (b) are those sharing the top position above the Ca impurity.
Figure 5: (Color online) Total adsorption energies as a function of the number of CH4 molecules adsorbed on a single Ca atom decorating a SWCNT (a) and adsorption energy values of the last added methane molecule (b).
Figure 6: (Color online) Gaussian convoluted PDOS over Ca and 6CH4 molecules for the vdw-DF case. The methane labelled CH4 2 is the ”long range” one (see Section 3 for the details) being at 5.03 ˚A from the Ca impurity. The zero of the energy has been set to the HOMO level of the entire system.
Figure 7: (Color online) PDOS over Ca2 and CH4 orbitals involved in the adsorption decorating a SWCNT for both LDA and PBE calculations. For the sake of clarity the HOMO level of the entire system has been set to zero and the spectra have been convoluted with a gaussian function.
A Generalized Turbulent Combustion Model for
Large Eddy Simulation of Turbulent Premixed
Flames
E. Giacomazzi∗, D. Cecere,
F. R. Picchia, N. M. Arcidiacono
ENEA, UTTEI-COMSO
S.P. 081, Via Anguillarese 301, 00123, S.M. Galeria (Rome), Italy
Abstract. This work validates a subgrid scale model for Large Eddy Simulation of turbulent premixed flames. The model, developed by the same authors, is the Localised Turbulent Scale Model (LTSM), that proposes a unified (generalized) closure of the chem-ical source term covering all the regimes of turbulent premixed combustion. This model founds on the estimation of the local reacting volume fraction of a computational cell, that is related to the local turbulent and laminar flame speeds and to the local flame thickness. Simulations were performed on CRESCO3 and CRESCO4 platforms.
1
Modelling the Chemical Source Term
The Localised Turbulent Scale Model (LTSM) developed by these authors aims to model the chemical source terms in the reactive Navier-Stokes equations for turbulent combus-tion. The Favre filtered chemical source term in the energy and single species transport equations is here modelled as eωi ≈ γ∗ω∗i, γ∗and ωi∗being the local reacting volume fraction of the computational cell and the reaction rate of the i − th chemical species, respectively. The local reacting volume fraction is defined as γ∗ = VF∗/V∆, VF∗ and V∆ being the reacting and the total volumes of the computational cell. In particular, the suggested Localized Turbulent Scales Model (LTSM) estimates the local reacting volume fraction γ∗ assuming that a flame front having a surface area AF and thickness δF is contained in a computational cell volume of characteristic size ∆ = V∆1/3, i.e.,
γ∗= VF∗ V∆ ≈ AFδF V∆ ≈ ST SLAL δF V∆ ≈ ST SL∆ 2δF ∆3 = ST SL δF ∆ . (1)
This expression has been obtained with two main assumptions. The first is that within a wrinkled flame front the iso-surfaces of the progress variable are parallel. The second assumption is that the ratio between the turbulent and the laminar flame surface areas scales as the ratio between the associated flame speeds , i.e., AF/AL≡ AT/AL≈ ST/SL.
With this modeling, subgrid flame front wrinkling and curvature effects are synthesized in this ratio. It is reminded that the laminar flame speed can be estimated as SL≈ (α/τch)1/2, the laminar flame thickness as δL ≈ (α τch)1/2, and that these two expressions imply
δLSL
α = 1 The quantity α = k/(ρCp) is the thermal diffusivity, with k being the thermal conductivity, ρ the density and Cp the specific heat at constant pressure.
It is observed that the local flame at the base of Eqn. (1) may be laminar or turbulent, wrinkled or not, thickened by turbulence or not, depending on the local conditions of the flow. In particular, for a local laminar (planar) flame Eqn. (1) reduces to γ∗ ≈ δ
F/∆. When combustion is locally volumetric, γ∗ = 1. Equation (1) refers to a laminar or turbulent wrinkled flame front with γ∗ < 1.
An extinction or flame stretch factor Gext ≤ 1 is introduced to take into account flame quenching due to subgrid scales. This factor has effect on γ∗ that is finally given by γ∗ = GextSSTLδ∆F. The problem of γ∗ estimation becomes the problem of estimating the characteristics of the local flame front in terms of its turbulent flame speed, laminar flame speed and thickness (turbulent or laminar) from the filtered conditions of the flow and depending on the related local premixed combustion regime. Models (not reported here) to derive the turbulent quantities are proposed within the Localised Turbulent Scale Model. To derive such models, interaction between vortices and a flame front is analysed. The range of scales that can interact with a flame front, and eventually enter into, is identified to model local flame thickening due to turbulence. The smallest turbulent scales that apply the highest strain rate and curvature wrinkling onto the flame front are also identified to model local flame quenching due to turbulence. Three main combustion regimes are identified based on the comparison between the local laminar flame front δL, the local turbulent macro-scale l∆, and the local turbulent dissipative scale η. These regimes are named VR from Volumetric Regime, T T CR from T hickened, T urbulence − T hickened, Corrugated Regimes, WR from Wrinkled Regime. The LTSM models the local reacting volume fraction in these regimes.
2
Model Validation
The Localised Turbulent Scale Model has been validated by simulating a test case defined and simulated by these authors using the Direct Numerical Simulation approach. In particular, the time average and rms fluctuation of some quantities resulted from the LES simulation were compared with their DNS counterpart.
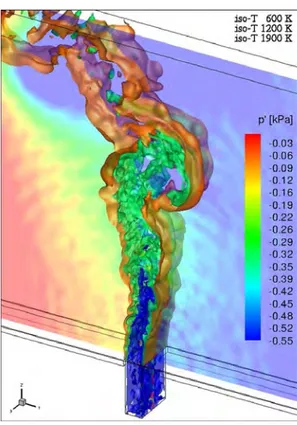
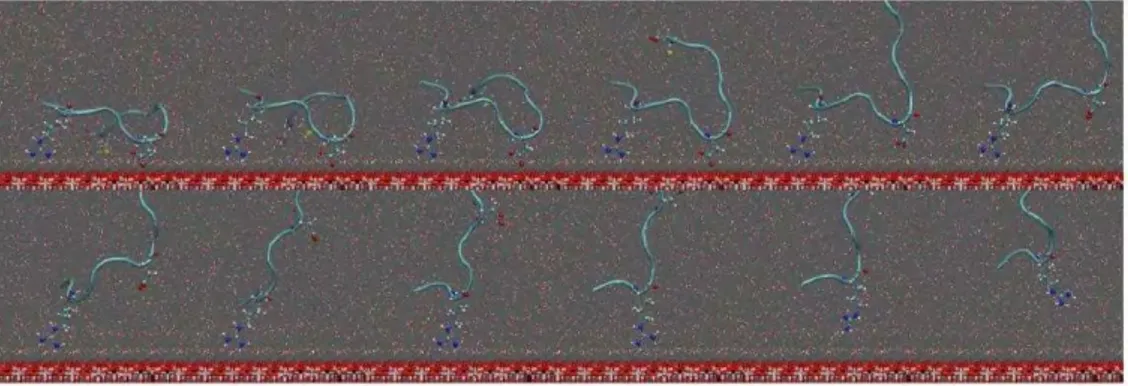
The test case consists in an unconfined and atmospheric Bunsen flame developing along the streamwise direction (z), as shown in Fig. 1. This premixed flame is produced by three adjacent rectangular slot burners whose size is undefined in the spanwise direction (x) and that are separated along the transversal direction (y) by means of two 0.17 mm thick walls. The central slot burner injects a fresh mixture of methane, hydrogen and air, while the two side burners inject hot combustion products of the same central mixture. This test case was selected because a slot Bunsen flame represents one of the major categories of turbulent premixed combustion. It is also interesting to analyse the effect of hydrogen added to methane, due to the increasing interest in hydrogen enriched natural gas.
Figure 1: Instantaneous temperature iso-surfaces and pressure fluctuations in the middle plane.
The reactant mixture, with an equivalence ratio Φ = 0.7 and with 0.2 mole fraction of hydrogen, is injected from the central slot with a bulk velocity of 100 m s−1 and at 600 K. The velocity of the coflow stream is 25 m s−1. The central jet Reynolds number is 2264, based on the width of the jet, 1.2 mm, its bulk velocity, and the kinematic viscosity 5.3 · 10−5m2s−1. Homogeneous isotropic turbulence is forced at the inlet. Such turbulence is artificially produced by means of a synthetic turbulence generator implemented from [1]. In particular, the spatial correlation length scales and velocity fluctuations provided as input to this generator are: Lzz = 0.8 mm, Lxx = Lyy = Lzz/2 = 0.4 mm, u′z = u′x = u′y = 12 m s−1 with no shear stresses (the Reynolds stress tensor is diagonal).
The actual velocity fluctuation at the end of the injection channel is u′ ≈ 12 m s−1, and the turbulent length scale is lt ≈ 1 mm. These data are used in the calculation of the characteristic numbers associated to the present jet premixed flame.
The central jet turbulent Reynolds number is 226, based on the rms velocity fluctuation, 12 m s−1, the integral scale, 1 mm, and the previous kinematic viscosity. The Kolmogorov length scale is η ≈ 17.22 µm. The adiabatic flame temperature is 2071 K. The laminar flame speed and flame front thickness at these conditions are SL = 0.96 m s−1 and δ
F = 0.386 mm, respectively. Hence, u′rms/SL = 12.5 and Lt/δF = 2.6; Kaη = 503, DaILt = 0.21.
Figure 2: Transversal average and rms temperature profiles at several heights above in-jection: comparison between LES (solid lines) and DNS data (dashed lines). Lines with symbols are rms fluctuations.
spanwise direction (x), extending from -1.5 to 1.5 mm, and along which periodic boundary conditions are forced. The computational domain has four zones: a central injection zone extending from −4 mm to 0 in the streamwise direction (z) with a width (along y) of 1.2 mm and with 60 × 35 nodes (zy); two surrounding zones extending from −0.4 mm to 0 in the streamwise direction and from the central slot external wall (wall thickness 0.17 mm) up to 18 mm outward in the transversal direction (y) with 8 × 89 nodes (zy); a main mixing and reacting zone downstream of the injection extending from 0 to 24 mm in the streamwise direction and from −18 mm to 18 mm in the transversal direction with 241 × 221 nodes (zy). The whole computational domain has 56785 × 61 = 3463885 nodes. Seventeen species are transported: CH4, H2, O2, N2, OH, O, H, HO2, H2O2, CH3, CH2,