SOLVING OF RENEWABLE ENERGY SOURCES USABLE POTENTIAL EVALUATION IN REMOTE RURAL AREA ON EXAMPLE OF BASILICATA REGION
(SOUTHERN ITALY) - CASE STUDY
Vladislav Zavadskiy1, Alexandros Sotirios Anifantis2, Francesco Santoro2 1
Almaty University of Power Engineering and Telecommunication, Kazakhstan; 2
University of Bari Aldo Moro, Italy
[email protected], [email protected], [email protected] Abstract. Electricity supply issues are the most critical in remote rural areas. Electricity is needed not only to ensure economic activity, but also to ensure high standards of living. The construction of power lines or the delivery of fuel for diesel generators is not always possible or economically feasible. Therefore, the most promising is the use of renewable energy sources to solve the electricity supply issues. Today there are various types of equipment that can be successfully used to solve autonomous power supply tasks of remote objects of agriculture. At the same time, in practice, the introduction of renewable energy sources is accompanied by the solution of a number of serious problems, connected primarily with the variability of most of the types of such energy used. Therefore, the most critical part is determining the potential of specific types of renewable sources in specific areas. The possibility of an independent preliminary assessment of the potential for the use of renewables is particularly relevant for small objects of agriculture. Due to limited resources they do not always have the opportunity to order professional research and evaluate their possibilities of renewable energy sources usage. This study is devoted to solving this issue, using the developed approaches and the latest publicly available tools. The results will help in the selection of equipment and the assessment of the possible amount of electricity that can be obtained within a certain period.
Keywords: electricity supply, remote rural areas, renewable energy sources, energy potential evaluation. Introduction
For successful business operations in rural regions it is necessary to ensure quality power supply. The most promising is the usage of renewable energy sources (RES).
RES are energy resources of constantly heterogeneous processes on the planet, as well as energy resources of living products of biocoenosis of vegetable and animal origin. A characteristic feature of RES is their inexhaustibility, or the ability to recover their full potential in a short time – within the lifetime of one generation.
Almost 40 years ago, the UN General Assembly, in accordance with resolution 33/148 (1978), introduced the concept of “new and renewable sources of energy” [1]. According to the resolution, the scope of new and renewable sources of energy includes: solar, geothermal and wind power, tidal power, wave power and thermal gradient of the sea, biomass conversion, fuel-wood, charcoal, peat, energy from draught animals, oil shale, tar sands and hydropower.
According to the evaluation and the estimation of the potential of renewable energy sources usage let us assume that to create comfortable living conditions an average of 2 kW per person is needed. From each square meter of the earth’s surface it is possible to obtain, on average, 500 watts of power using different RES. If it is assumed that the conversion efficiency of this energy into a form convenient for consumption is only 4 %, then for a power of 2 kW an area of 100 m2 is required. The average population density in cities, considering the suburban areas, is about 500 people per 1 km2. To ensure their energy at a rate of 2 kW per person, it is necessary to remove 1,000 kW from 1 km2, that is, it is enough to occupy only 5 % of the area. Thus, renewable energy sources can provide a satisfactory standard of living, if there will be found acceptable in cost methods of their transformation, taking into account the resource potential [2].
In Italy, about 30 % of people are living in rural places with the average population density of about 200 people per 1 km2 [3].
The study allows to solve the problem of determining the potential for the main types of renewable energy: the sun and wind for the region of Basiliсata, southern Italy. We will conduct a preliminary assessment of the potential of renewable energy sources using publicly available tools.
1. Materials and methods
The importance of assessing the potential of renewable energy sources is directly related to the peculiarities of energy sources and modern technologies that convert them into electricity.
Solar energy resources of the territory are directly influenced by geographical and climatic characteristics: the duration of a light day; average monthly and annual duration of sunshine; average monthly and annual characteristics of the transparency of the atmosphere, and many others. The estimation of the potential of solar energy is based on long-term data of actinometric observations on as many stations as possible, distributed fairly evenly across the territory. Potential opportunities for the arrival of solar radiation are determined by the geographical breadth of space. Climatic characteristics of the area, indirectly characterized by the duration of sunshine, make significant adjustments to the possibility of efficient use of solar energy.
Maximum solar radiation at the Earth’s surface can reach about 10 kWm-2 in a wavelength band range 0.3-2.5 µm [4].
Solar energy comes in three basic forms: low temperature solar thermal; high-temperature solar thermal energy and solar electric or photovoltaic (PV) [5].
Low temperature solar energy sources imply water heating. The technology looks very simple and reliable: the sun rays heat up some dark surface (usually black) for maximum energy absorption, which heats water or sometimes air. The main problem here is to organize the heat storage. Usually, stones or water are used.
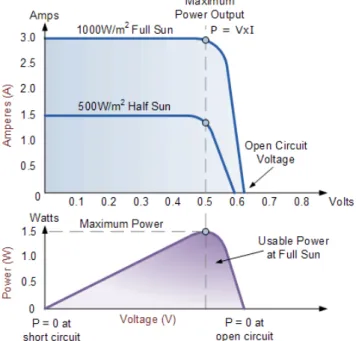
In full irradiance (1000 W·m-2) at the equator typical solar cell has the volt-ampere characteristic shown in Figure 1. If we have less sun energy, it will reduce the power output by a proportional amount (Figure 1) [6].
Fig. 1. Example of photovoltaic solar cell volts-ampere characteristic
Nowadays the photovoltaic technology is a fast-developing technology, which can provide acceptable energy efficiency and longtime life cycle. For example, when for the first time Bells Labs invented the first sun cell in 1954, its energy efficiency was only 6 percent. Today the energy efficiency of SunPower cells achieves 24.1 % [7].
But the overwhelming majority of the manufactures offers the panels with the efficiency range between 14 and 17 % [8].
By now, wind power has become a significant branch of the energy sector, which makes a tangible contribution to the production of electricity in some countries.
The main reason for the occurrence of wind is the uneven heating of the earth by the sun. The terrestrial surface is not homogeneous: land, oceans, mountains, forests cause non-uniform heating
even on the same latitude. The rotation of the earth also causes a deflection of the air currents. All these causes cause a heterogeneous circulation of air masses.
Wind speed usually increases with altitude, and their horizontal component is much larger than the vertical one.
At the velocity v0 and air density ρ the wind-driven sweeping area A develops power (1):
2 3 0 v A C P P
ρ
= , (1)where CP – parameter, characterizing the efficiency of the wind flow energy used by the wind
wheel and is called the power factor (coefficient depends on the design of the wind wheel and the wind speed) [9].
Since the wind speed is variable, and the power is very much dependent on the wind speed, the choice of the optimal design of the wind wheel is largely dependent on the requirements of electricity consumers.
According to the standards of different countries, the power of wind turbines is determined by the wind speed 10.4, 11 or 11.2 meters per second, depending on the country. This is considered the nominal capacity, which is reported by the manufacturer of the installation to the buyer.
That is, if the wind speed is below the specified value, the wind turbine gives out less power. For example, a 3 kW wind turbine at different wind speeds produces the following power according to the cubic dependence (Table 1.) [10].
Table 1 Dependence of the power of wind turbines on wind speed
Wind speed, m·s-1 3 4 5 6 7 8 9 10 11 12 Rotor speed, rpm 46 61 76 91 106 121 137 152 176 191 Instantaneous power, kW 0.06 0.2 0.4 0.7 1.1 1.7 2.5 2.9 4.4 5.7 Daily energy, kWh 1.4 4.8 9.6 16.8 26.4 40.8 60 69.6 105.6 136.8 Monthly energy, kWh 43 144 288 504 792 1224 1800 2088 3168 4104 Annual energy, kWh 518 1728 3456 6048 9504 14688 21600 25056 38016 49248 There are big advantages of the wind energy source for producing electricity:
• absence of environmental pollution – the production of energy from the wind does not lead to emissions of harmful substances into the atmosphere or formation of waste.
• use of a renewable, inexhaustible source of energy, saving on fuel in the process of its extraction and transportation.
• area in the immediate vicinity can be fully used for agricultural purposes. But there are some disadvantages also:
• high investment costs; • variability of power in time; • noise;
• threat to birds;
• changes in the landscape.
The simulated object is a remotely standing farm in the south of Italy, with coordinates 40.24739N 16.44855E and needs in electricity of about 30 kW (Figure 2). Tomato and strawberry greenhouses are widely used in the region [11] and could be supplied with renewable energy.
To model the object, publicly available tools such as Global Solar Atlas [12], Global Wind Atlas [13], Renewables.ninja tool [14] are used.
This simulation is part of the developed method for determining the possibility of replacing traditional sources with the help of renewable energy [15].
Fig. 2. Simulated object 2. Results and discussion
2.1. Solar energy simulation results
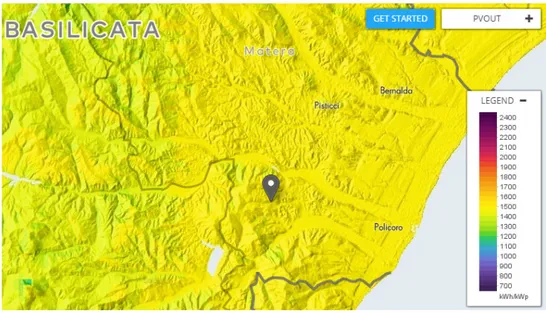
According the Global Solar Atlas, which was founded by the World Bank, the photovoltaic energy potential distribution is shown in Figure 3. Where PVOUT (PV Electricity output) is the amount of energy, converted by a PV system into electricity (kWh/kWp), it is expected to be generated according to the geographical conditions of a site and a configuration of the PV system. Three configurations of a PV system are considered: (i) Small residential; (ii) Medium-size commercial; and (iii) Ground-mounted large scale [12].
Fig. 3. Zoning of territory of simulating object on photovoltaic electricity output
Photovoltaic system of size 30 kWp with modules facing 180º tilted at 33º long-term yearly and daily averages will provide photovoltaic electricity [kWh]: 41646 per year (114.1 per day) [12]. 2.2. Renewable energy source types best combination calculation results
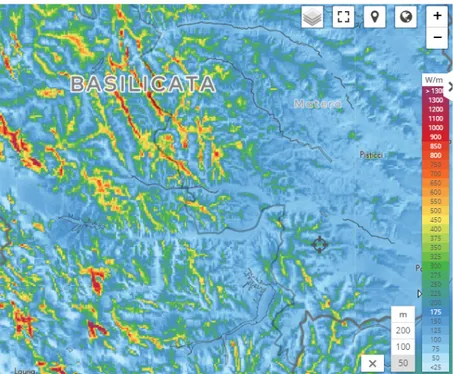
Information about the potential of wind energy of the object region can be obtained from the Global Wind Atlas coordinated by the International Renewable Agency (IRENA) [13]. The data for the aggregated mean power density are provided at 50 m (lowest available) (Figure 4.).
Fig. 4. Wind energy potential from 1m2 of sweeping area at altitude of 50 m from the earth’s surface. W·m2 per year
2.3. Electrical power output forecast from the renewable energy sources
As it was mentioned, it is important to get the precise forecast of the electrical power output from the renewable energy sources. For getting such information in this work the Renewables.ninja [14] open web tool was used. Such tool allows to run simulations of the hourly power output from wind and solar power plants located anywhere in the world.
The Renewables.ninja tool is using weather data from global reanalysis models and satellite observations. Solar irradiance data are converted into power output using the GSEE model (Global Solar Energy Estimator) [16]. Wind speeds are converted into power output using the VWF model (Virtual Wind Farm) [17].
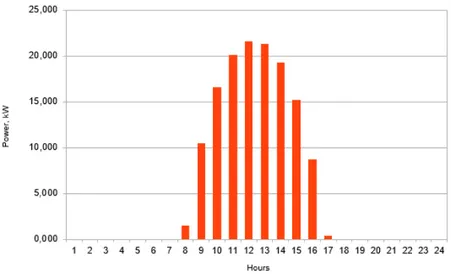
In the simulation and for getting the power output profile from renewables two days will be considered: in summer (22.06.2014) and in winter (22.12.2014). The results of the simulation are presented in Figures 5-8 [14]. Wind and solar facilities in the simulation have 30 kW power output. But the received power output profile can be applied for any installed capacity. This power can be used for the farm power supply (greenhouses, residents’ needs, communication facilities as well [18]).
Fig. 5. Renewables.ninja 30 kW (10 meters) wind farm power output profile simulation on 22.06.2014
Fig. 6. Renewables.ninja 30 kW (10 meters) wind farm power output profile simulation on 22.12.2014
Fig. 7. Renewables.ninja 30 kW PV solar plant power output profile simulation on 22.06.2014
Fig. 8. Renewables.ninja 30 kW PV solar plant power output profile simulation on 22.12.2014
Conclusions
It can be concluded that it is quite possible to conduct a preliminary assessment of the potential of renewable energy sources using publicly available tools.
At the same time, it is necessary to have a basic understanding of the technology for converting solar and wind energy into electricity. Here it is most important to understand that it will be possible to convert not 100 % of the installed capacity of the unit. Our preliminary assessment showed that the use of solar energy is more appropriate for the simulated area, since the efficiency of using the installed power of the wind unit does not exceed 15 %. For the final choice of solutions for power supply facilities it is necessary to conduct a larger study and simulation using the electricity storage devices and other solutions.
References
[1] UN General Assembly resolution 33/148 (1978). [online] [20.03.2016] Available at:
https://documents-dds-ny.un.org/doc/RESOLUTION/GEN/NR0/361/66/IMG/NR036166.pdf?OpenElement [2] Lukutin B.V., Renewable energy sources, Tomsk Politechnical Uneversity, 2008.
[3] EUROSTAT, Statistics on rural areas in the EU. [online] [10.03.2019] Available at:
https://ec.europa.eu/eurostat/statistics-explained/index.php/Statistics_on_rural_areas_in_the_EU#Further_Eurostat_information [4] Tviedell J., Weir T., Renewable Energy Resources, Second edition, Taylor&Francis, 2006. [5] Timmons D., Harris J. M., Roach B., The Economics of Renewable Energy, Global Development
and Environment Institute, Tufts University, Medford 2014.
[6] Alternative Energy Tutorials, Photovoltaic Solar Cells, 2017. [online][20.06.2017] Available at: http://www.alternative-energy-tutorials.com/solar-power/photovoltaics.html
[7] Solar Technology Efficiency: More Breakthroughs are Coming, “Solar Technology”, 2016. [online][20.06.2017] Available at: https://us.sunpower.com/blog/2016/06/26/sunpower-solar-module-verified-241-percent-efficient/
[8] Aggarval V., What are the most efficient solar panels on the market? “EnergySage”, http://news.energysage.com/what-are-the-most-efficient-solar-panels-on-the-market/ [22.06.2017] [9] Gorodov R.V., Gubin V. E., Matveev A. S., Non-traditional and renewable energy sources,
Tomsk Politechnical University, 2009.
[10] Modern wind power generation methods. Efficiency, expediency, Electronic Educational Portal, 2012. [online][ 25.06.2017] Available at: http://eef.misis.ru/sites/default/files/lectures/6-5-1.pdf [11] Cerruto E., Manetto G., Santoro F., Pascuzzi S. “Operator Dermal Exposure to Pesticides in
Tomato and Strawberry Greenhouses from Hand-Held Sprayers”. Sustainability Volume 10(7), 2018, 2273 - eISSN:2071-1050 - DOI: 10.3390/su10072273
[12] The World Bank Group, Global Solar Atlas. http://globalsolaratlas.info/about [10.03.2019] [13] DTU Wind Energy, Department of Wind Energy, Global Wind Atlas. [online][10.03.2019]
Available at: http://globalwindatlas.com/index.html
[14] Renewables.ninja RES power output forecasting tool. [online][10.03.2019] Available at: https://www.renewables.ninja/
[15] Zavadskiy V. Unit Commitment in a dispersed power system involving renewable energy, LAP LAMBERT Academic Publishing, ISBN-13:978-3-659-82615-3; ISBN-10:3659826154; EAN:9783659826153, 2018
[16] Pfenninger S., Staffell I. Long-term patterns of European PV output using 30 years of validated hourly reanalysis and satellite data, “Energy”, no. 114, 2016, pp. 1251-1265.
[17] Pfenninger S., Staffell I.. Using Bias-Corrected Reanalysis to Simulate Current and Future Wind Power Output, “Energy”, no. 114, 2016, pp. 1224-1239.
[18] Pascuzzi S., Santoro F. “Evaluation of farmers’ OSH hazard in operation nearby mobile telephone radio base stations”. 16th International Scientific Conference “Engineering for rural development” Proceedings, Volume 16. Jelgava, Latvia, May 24-26, 2017, pp. 748-755.


