POLITECNICO DI MILANO
Corso di Laurea Magistrale in Ingegneria Informatica
Dipartimento di Elettronica, Informazione e BioingegneriaBRANCHINGSETS: A VISUALIZATION TECHNIQUE
FOR THE INTERACTIVE INSPECTION OF
BIOLOGICAL PATHWAYS
Necst Lab
Novel, Emerging Computing System Technologies Laboratory
Relatore: Prof. Santambrogio Marco Domenico
Tesi di Laurea di: Francesco Paduano, matricola 818226
Curiosity is gluttony. To see is to devour.
I would never make a comprehensive list all the people I am grateful to. Otherwise, the preamble of this thesis would be even thicker than the thesis itself.
I would like to thank my advisors Marco Domenico Santambrogio and Angus Graeme Forbes, they both guide me during this year with their persistent motivation, energy and enthusiasm.
I am grateful to all the other professors that taught me during the last years. My deepest gratitude goes to all of them.
A sincere thank tomum, dad and my uncle Stefano. They removed every barrier between me and my dreams.
Thanks to my dear uncle Ugo, if he hadn’t given me the first floppy disk with a compiler when i was 12, I wouldn’t be here now.
Domenico, thanks for being my big brother. Without any doubt, the person who had the biggest influence in my life.
AndChiara, Serena, Donata for being elder sisters. Chiara, thanks for the premature math lessons, Serena for being my life teacher, Donata for being my music advisor.
Viola, thank for being on my side for the last year. For being my constant inspiration. Thanks to my friendFederica. Thank for teaching me to aim high.
ACKNOWLEDGMENTS (continued)
There are no adequate words for describing my gratitude for Bruno and Raffaele. They are the most outstanding and entertaining friends. Your absence in the last months has been the biggest hurdle of my every-day happiness.
Andrea and Giada for their friendship during these university years.
Yasmine and Valentina for being the most lackluster, loafer and tacky friends. Keep taking care of Bruno! ThanksDaniele for your exaggerated and unresting spirit.
Marianna, Antonino, Michele, Simone, Niccolo’, Eleonora, Giovanni, Francesco, Mauro for the musical emotions.
A thought toAchille, Giulia, Irene, Omar and all the other high-school friend who already graduate or are about to. Always been proud of you.
AndGianluca, Matteo, Alessandro(s), Lorenzo, Enzo and all the other friends that made this time in Chicago enjoyable.
Adrianita, for your company and friendship during these months in Chicago.
CHAPTER PAGE
1 INTRODUCTION . . . 1
2 A MODEL FOR BIOLOGICAL PATHWAYS . . . 6
2.1 Model . . . 6
2.2 Pathway Data Formats . . . 8
3 TASKS AND REQUIREMENTS ANALYSIS . . . 9
3.1 Tasks . . . 9
3.2 Requirements . . . 16
4 RELATED WORK . . . 23
4.1 Visual Encodings and Representations . . . 23
4.1.1 Graph visualizations . . . 23
4.1.1.1 Human curated node-link diagrams . . . 24
4.1.1.2 Automatically generated node-link diagrams . . . 25
4.1.2 Visualizing Categories on Node-Link Diagrams . . . 27
4.1.3 Hierarchical Techniques . . . 30
4.1.4 Matrix-Based Techniques . . . 32
4.2 Tools . . . 33
4.3 Future Challenges for Pathways Visualization Tools . . . 38
4.3.1 User Interaction and Better Visual Encoding . . . 38
4.3.2 Data Integration . . . 39
4.3.3 Experiment New Techniques . . . 39
4.3.4 Abstract Representations . . . 40
4.3.5 Visualizing Uncertainty . . . 40
4.3.6 Pathway Logic . . . 40
4.4 Final Remarks on Related Work . . . 41
5 BRANCHINGSETS . . . 42
5.1 Design Study of BranchingSets . . . 44
5.1.1 Design Goals . . . 44
5.1.2 Visual Encoding . . . 46
5.1.3 Showing Category Information Only For Nodes . . . 47
5.1.4 Directed Graphs . . . 48
5.1.5 Protruding Links . . . 49
5.1.6 Interactions . . . 49
5.1.6.1 Highlighting and Labelling Categories . . . 50 vi
TABLE OF CONTENTS (continued)
CHAPTER PAGE
5.1.6.2 Hiding and Unhiding Categories . . . 50
5.1.6.3 Filtering by Keyword . . . 52
5.1.6.4 Expanding Neighbours of a Selected Node . . . 52
5.1.6.5 Navigating and Rearranging the Layout . . . 52
5.1.6.6 Finding Intermediate Steps between Two Nodes . . . 52
5.2 Applications . . . 53
5.2.1 Co-authorship Network . . . 54
5.2.2 Geospatial Data . . . 56
5.3 Final Remarks on BranchingSets . . . 56
6 EVALUATING BRANCHINGSETS WITH AN USER STUDY . . . 59
6.1 User Study . . . 59 6.1.1 Method . . . 59 6.1.2 Apparatus . . . 63 6.1.3 Tasks . . . 63 6.1.4 Hypotheses . . . 64 6.1.5 Results . . . 65 6.1.6 Qualitative Study . . . 68
7 BRANCHINGSETS WITH BIOLOGICAL PATHWAYS . . . 69
7.0.7 Related Work . . . 69
7.1 The Design . . . 71
7.1.1 Node-Link Diagram with BranchingSets . . . 72
7.1.2 Hierarchical Inspection . . . 73
7.1.3 Colors . . . 77
7.2 Curved Links . . . 79
7.2.1 Interactions . . . 80
7.2.1.1 Pathway Highlighting and Labelling . . . 80
7.2.1.2 Pathway Hiding and Unhiding . . . 82
7.2.2 Nested pathways inspection . . . 85
7.2.2.1 Keywords Filtering . . . 85
7.2.2.2 Upstream and Downstream Expansion . . . 85
7.2.2.3 Layout rearranging, zooming and panning . . . 87
7.2.2.4 Complex Structure Inspection . . . 87
7.2.2.5 Finding intermediate steps between two nodes in a pathway . . . 87
7.2.3 Additional Visual Encodings . . . 89
7.2.4 Animations . . . 90 8 IMPLEMENTATION NOTES . . . 92 8.1 The Prototype . . . 92 8.2 D3.js . . . 92 8.3 Data Structure . . . 92 vii
8.4 Force Layout . . . 93 8.5 Rectangles Packing . . . 95 8.6 Labelling . . . 97 8.6.1 The Concept . . . 99 8.6.2 The Algorithm . . . 100 8.6.3 Limitations . . . 103
8.7 Drawing Curved Links . . . 104
9 COMPARISON WITH OTHER SOLUTIONS . . . 107
9.1 Comparison . . . 107
10 CONCLUSIONS AND FUTURE WORK . . . 114
CITED LITERATURE . . . 117
VITA . . . 126
LIST OF TABLES
TABLE PAGE
I LIST OF TASKS . . . 10 II LIST OF REQUIREMENTS TO SUPPORT THE TASKS T1-11 . . . 16 III COMPARISON BETWEEN THE REQUIREMENTS IMPLEMENTED
IN POPULAR TOOLS FOR PATHWAY VISUALIZATION . . . 33 IV Tasks used in the quantitative experiment . . . 64 V COMPARISON BETWEEN BranchingSets TECHNIQUE AND OTHER
TECHNIQUES INCLUDED IN POPULAR TOOLS FOR PATHWAY
VI-SUALIZATION . . . 113
FIGURE PAGE 1 The image represents some techniques for representing categories on graph
structures: a) The node is divided in multiple fans colored accordingly to the
categoryb) Nodes and edges have colored contours c) KelpFusion d) LineSets . 27 2 The image represents the most common technique for representing tree
structures: a) A traditional tree diagram b) tree diagram with a circular layout
c) Tree Map d) H tree e) Circle Packing . . . 30 3 A view of Entourage showing links between a larger “focus pathway” and
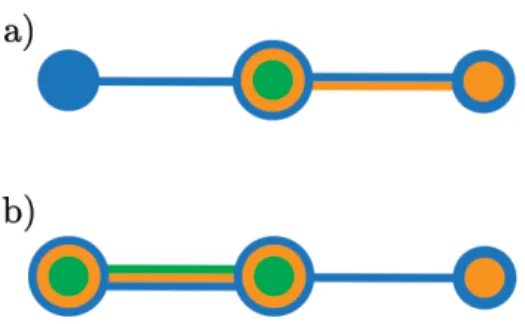
several “context pathways.” . . . 35 4 Visualizing hundreds of nodes and links with Biofabric . . . 36 5 Visualizing different gene expression with Reactome Pathway Browser . . . 37 6 Two simple examples of node-link diagrams enhanced with BranchingSets. 44 7 Coloring of the links in case of no information related to the membership.
Since the nodeB and C does not have any category in common, the link which
connect them is black and thinner . . . 46 8 BranchingSets applied to a directed node-link graph. The link betweenB
andC is bidirectional. . . 46 9 NodeE belongs to the blue category but is visually disconnected from the
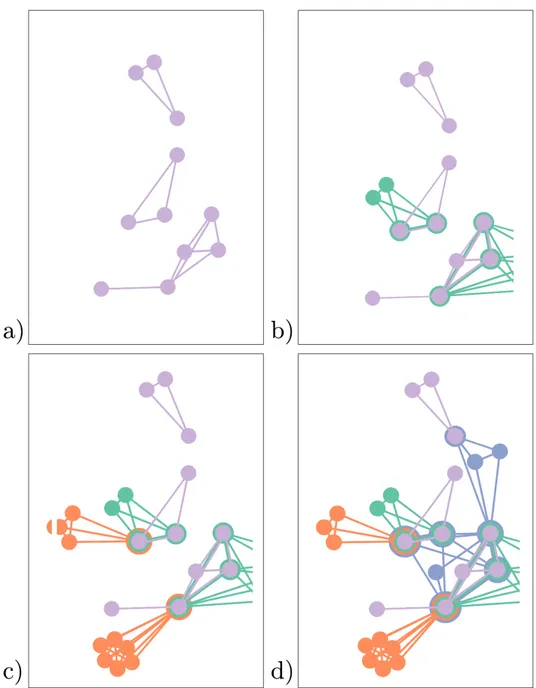
other blue nodes. . . 48 10 BranchingSets(a) without protruding links (b) with protruding links. . . 49 11 The same graph with different visible categories(a) only violet (b) violet
and green(c) violet, green and orange (d) violet, green, orange and blue . . . . 51 12 On the left, the user is dragging the mouse from one biological complex to
another. On the right, the visualization is updated with all the connecting paths 53 13 Visualizing the co-authorship network of authors who published at least
one paper at IEEE Vis from 2012 to 2014. (a, b, c) are zoomed views of
sub-networks of the overall representation . . . 54 14 Visualizing location and category of a group of restaurants in Milan with
(a) LineSets (b) BranchingSets . . . 57 15 Screenshoot of the interface of the user study. The image shows (1) the
question(2) the answer (3) the screen area dedicated to the representation . . . 60 16 Examples of datasets used for the user study. (a, b) Representation of the
same dataset with BranchingSets and LineSets. (c, d) Representation of the
same dataset with BranchingSets and Bubble Sets . . . 61 17 Examples of a dataset used in the user study for Task 5.(a) Representation
of two graphs in separated views.(b) Representation of two graphs overlapped
with BranchingSets . . . 62 18 Chart showing the accuracy (left) and task completion times (right) for
Tasks 1-4 . . . 65 x
LIST OF FIGURES (continued)
FIGURE PAGE
19 Subjective user ratings from the qualitative study . . . 66 20 Chart showing the mean completion time for Tasks 5 . . . 67 21 The image shows the proposed technique to combine node-link diagram
with LineSet. The arrangements of the nodes follows the topological order of
the links . . . 71 22 On the left, a reaction which involves two left components (A,B) and two
right components (C,D). On the right, the figure explain the relationship
be-tween the four components considered in our technique . . . 72 23 The figure demonstrates hierarchical inspection using the symbolic overview
and the the pruned tree. In (a), the user selects protein G from the expanded node within the node-link diagram; this protein is highlighted within the pruned tree visualization, which also provides more information about its siblings (the proteins D, E, and F) and its parent and grandparent nodes (the complexes C, B, and A). In (b), the user selects a complex B in the expanded node, which is
displayed in a similar manner in the pruned tree. . . 74 24 Two cases of inspection of the structure of a complex by means of two
coordinated views . . . 75 25 Screenshoot of the Color menu. The menu shows the available palettes and
a preview of the selected palette. . . 79 26 The figure represent the same graph (a) with curved links (b) with straight
links. The dashed circle (1) contains a cycle, (2) is not a cycle. . . 81 27 The figure represent two overlapping edges (a) with straight links (b) with
curved links . . . 82 28 When the user hovers on a component, the application will highlight only
the relevant pathways . . . 83 29 Screenshot of the interface of the prototype. On the left side from the top:
the search field, the list of searched keywords and the list of pathways loaded
by the application . . . 84 30 Exploring the the pathway hierarchy. A sub-pathway is selected in orange,
whereas the whole S-Phase pathway is selected in green. Inside S-phase,
an-other subpathway is selected in blue. . . 86 31 Location of all the MCM2-7 in the enlarged complexes . . . 88 32 On the left, the user is dragging the mouse from one complex to another.
On the right, the visualization is updated with all the connecting paths . . . 89 33 Additional visual encodings embedded in our tool. Figure (a) shows (1)
up-stream and downup-stream markers (2) downup-stream marker (3) upup-stream marker. Figure (b) shows the downstream markers during the “finding intermediate
steps between two nodes in a pathway” interaction. . . 90 34 ER-Diagram of the data structure used in the prototype . . . 94 35 Figure (a) show the layout of a graph with a simple force layout. Figure (b)
represents the same network with extra forces to show the directionality of the
graph . . . 95 xi
36 Padding and margin parameters . . . 96 37 Examples of rectangles packing generates with our algorithm with real
bi-ological complexes data . . . 98 38 The rectangle A overlaps with B, and its vertical and horizontal traces
over-lap with B,C,D,E. . . 100 39 A scenario of a rectangle A placed on the plane, and its horizontal
overlap-ping profile . . . 101 40 Figure (a) shows an overlapping profile, the dashed line is a cubic penalty
function. Figure (b) shows the combination of the overlapping profile with the penalty function. In both figures the global minimums are highlighted with red
circles. . . 102 41 Quad-tree data structure representation for 5 rectangles . . . 102 42 Figure (a) represents the anglea, the thickness parameter and ~pd, ~pa, ~pr, ~pp
vectors. Figure (b) represents the tip length and handle length parameters. The
picture also show P1, P2, P3, P4 control points and the corresponding handles. . 105 43 Sequence of screenshot of the first use case . . . 110 44 Sequence of screenshots of the second use case . . . 111
ABSTRACT
Understanding complicated networks of interactions between biochemical components is essential to solve contemporary problems in modern biology, especially in domains such as cancer and systems research. In these domains, biological pathway data is used to represent chains of interactions that occur within a given biological process. Visual representations can help researchers to understand and interact with complex pathway data in a number of ways.
Biologists make use of pathway visualizations for a range of tasks, including having an overview of large or multiple pathways, understanding inter-pathways connectivity and retrieving details concerning network entities and interactions. Some of these tasks require an understanding of the hierarchical nature of certain elements within the pathway or the ability to easily make comparisons between multiple pathways.
In this work, we present a taxonomy of tasks that are regularly performed by researchers who work with biological pathway data. From these tasks we generate a set of requirements that should be taken into consideration for the design of a pathway visualization software. Then, we present an overview of visualization techniques that are used for the representation of complex pathway data. We also perform a survey of a variety of pathway visualization tools that utilize different visualization techniques.
The most popular representation technique for visualizing the biological interconnections between components in a pathway is the node-link diagram. However, frequently the connectivity between elements is not the only information that it is necessary to display. In certain application domains, elements and links can be grouped in categories. To address these requirements, a number of techniques
have been designed for overlaying node-link diagrams with additional information. In this work we introduce BranchingSets, a novel technique for augmenting node-link diagrams with information about the categories which the nodes and links belong to. The technique enables user-driven interactions to procedurally examine the graph topology.
Furthermore, we present a pathway visualization tool which leverages BranchingSets, for the ex-ploration of biological pathways incorporating both an intuitive graphical representation of multiple levels of information and we include a well-designed set of user interactions for selecting, filtering, and ordering the view of the data.
We provide a comparison between popular techniques for representing biological pathways and our technique. Our comparison shows that our technique provides functionality not currently enabled by current techniques, and that this functionality could be incorporated into existing visualization applica-tions to enable additional visual analytics tasks.
ABSTRACT (ITALIAN)
Alcune ricerche ed esperimenti di biologia richiedono sempre pi`u la comprensione e l’analisi di vaste e complicate reti di componenti biochimici, specialmente in settori come la ricerca per la cura del cancro o delle cellule staminali. In questi ambiti, i pathways biologici sono usati per rappresentare le catene di interazioni che avvengono all’interno di un processo biologico. Le rappresentazioni grafiche di un pathway biologico possono fornire un insostituibile supporto ai ricercatori per comprendere e interagire con questi dati in diverse maniere.
I biologi fanno uso di visualizzazioni di pathway in svariati casi, come ad esempio per avere una panoramica di uno o pi`u pathway molto vasti, comprendere connessioni di alto livello tra diversi path-way, e ottenere dettagli aggiuntivi riguardo le diverse entit`a coinvolte e le interazioni tra esse. In alcune circostanze `e necessario comprendere la natura gerarchica di alcuni elementi, in altre il biologo deve aver a disposizione uno strumento per comparare pathway differenti.
In questo lavoro di tesi verr`a presentata una tassonomia di diverse operazioni che sono regolarmente eseguite dai ricercatori che abitualmente fanno uso di dati relativi ai pathway. Da questa lista di oper-azioni verr`a estratta una serie di requisiti che devono essere presi in considerazione per il design di un software per la visualizzazione di pathway. Successivamente sar`a presentata una panoramica di diverse tecniche di visualizzazione che sono usate per la rappresentazione di dati complessi relativi ai pathway. Verr`a inoltre illustrata un’analisi di diversi strumenti per la visualizzazione di pathway e le corrispettive tecniche utilizzate.
La tecnica pi`u popolare per la visualizzazione di pathway biologici `e il node-link diagram. Sfortu-natamente, le interconnessioni tra diversi elementi non `e l’unica informazione significativa da mostrare. In alcune applicazioni, elementi e connessioni possono essere raggruppate in categorie. A fronte di cio’, una serie di tecniche sono state affinate per aggiungere un ulteriore livello di visualizzazione aggiuntivo ai node-link diagram.
In questo lavoro verr`a presentata una nuova tecnica per includere in un node-link diagram infor-mazioni relative alle categorie dei nodi e delle connessioni: ci riferiremo ad essa con il nome Branch-ingSets. Questa tecnica include una serie di interazioni da parte dell’utente per permettere una esplo-razione procedurale della rete.
Inoltre verr`a presentato uno strumento per la visualizzazione di pathway che fa uso di BranchingSets per facilitare l’analisi di pathway biologici, permettendo sia una rappresentazione intuitiva di diversi liv-elli di informazione, sia una esplorazione procedurale della rete di interconnessioni tramite il filtraggio, la selezione e l’ordinamento dei dati.
Verr`a inclusa anche un confronto tra BranchingSets e diverse tecniche per la rappresentazione di pathway biologici. Il confronto suggerisce che la tecnica presentata in questo lavoro offre alcune fun-zionalit`a che non sono attualmente incluse in strumenti esistenti.
CHAPTER 1 INTRODUCTION
Great effort has been made by biologists to organize the available knowledge on biological path-ways. For instance, the Reactome Database (1) and the KEGG Pathway Database (2) are two examples of publicly accessible resources of biological data. Databases such as these, and the frameworks cre-ated to access, process, and query them, such as Pathways Commons (3), allow biologists to investigate multiple pathways simultaneously that may share common elements, such as biochemical reactions or protein complexes. The flexibility of these search tools, and the scale of the data that can be quickly retrieved, has motivated researchers to design new visualization tools to assist in a range of analysis tasks involving multiple pathways. A rich selection of requirements for pathways visualization tools is detailed in (4), which stresses the need of further research into interactive, dynamic solutions. Fur-thermore, it casts doubts on the possibility to satisfy all requirements with a unique visualization, and it encourages the design of balanced solutions. Indeed, the requirements for a pathway visualization tool include a variety of tasks, such as displaying related networks at different levels of abstraction, repre-senting large networks and providing details about network entities and interactions. Accomplishing all these tasks in one representation may not be feasible. A visual technique usually chooses to address only few of these requirements.
In the last decade, analyses that involve thousands of proteins or genes have become conventional. Numerous attempts have been proposed to visualize and analyze large biological networks, with partic-ular attention to the topology of the network and its hierarchical structure.
Biologists’ analysis often require to merge information from different pathways, since pathways groups together participants and reactions that are often shared between other pathways. Furthermore, a single pathway presents an hierarchical structure of sub-pathways. The visualization of this hierarchy, as well as to manage to represent relationships between pathways, open doors to a new set of challenges. This work will focus in particular on exploratory tasks which involve multiple pathways. Our pur-pose is to design a technique and to implement a prototype that can effectively display the similarities, the shared components and the interconnections between different pathways. Furthermore, we enable the user to efficiently explore the nested structure of a pathway and its components.
Typically, pathways are represented as directed graphs, where nodes in the graph represent biolog-ical “participants”, such as proteins or protein complexes, and where the edges represent a biologbiolog-ical functionality, such as a biochemical reaction. Often different shapes for arrows and nodes are used to differentiate between the different types of molecules or reactions.
In order to visualize several pathways on the same network, we present BranchingSets, a visual technique to represent categories on node-link diagram. BranchingSets provides group information on links and nodes without introducing visual clutter. Differently from other techniques to display category information on node-link diagrams, our technique integrates on the network representation, avoiding to occlude and clutter the visualization.
Indeed, BranchingSets colors nodes and links according to the category. When a node belongs to more category, multiple border are added around the node. If a link is shared between more categories, multiple line segment are placed side by side. Each pathway or sub-pawhay that is visible in the repre-sentation is assigned to a category which is bound to a color.
3 The representation of the topology of the network is still depicted with the usual conventions of node-link diagrams, which enables our technique to be accessible and straightforward to who is familiar with the traditional pathway representations. However, even though this type of visual encoding is the most widespread, node-link diagrams are known to have a number of issues. For instance, as the number of nodes or edges increases, it quickly becomes more difficult to make sense of the data (5).
The importance of a dynamic visualization which overcomes the limitations of a static represen-tation has been recognized by the community for a long time ((6), (7)). Indeed, the few advantages of static images, such as a fine-tuned representation which carefully improves readability and fits the available space, are exceeded by the navigation methods typically supported by dynamic visualizations. Furthermore, it is important that the layout can be programmatically changed by the user, and that the existing representation can be extended with new components.
For the mentioned reasons, BranchingSets includes some well-designed user interactions to dynam-ically filter, expand and rearrange the visualization. The biologist can display only the biochemical participants that match a set of keywords, and then progressively expand the network of interconnec-tions. Furthermore, the visualization can answer to more complex queries, such as displaying all the interconnections from a given entity to another.
Traditional node-link diagrams, even if enhanced with BranchingSets, do not provide the informa-tion to represent all the complexities of a pathway data structure. The data structure of pathways can be formalized with a hypergraph, a generalization of a graph with hyperedges that can connect any number of nodes. A biochemical reaction might involve multi-participant relationships. Moreover, a pathway usually contains multiple subpathways, and a single node can represent a nested structure of many
bio-logical entities. Some techniques for the visualization of pathways propose representations which limit the complexity of the data structure in favour of a simpler design. This is the case of the SIF binary network, which is often used to generate visualization using Cytoscape (8). This format represents only binary relationships and excludes rich biological semantics.
Inspired by the simplification adopted by the SIF binary network, we represent a biochemical reac-tion as a set of binary interconnecreac-tions between components. This simplificareac-tion makes easier to visually follow the chain of causal relationships between components and the cross-talk between pathways.
Lastly, in order to provide a representation of the hierarchy of the components, we have designed a specific technique which leverages two coordinated views. One view is a symbolic representation which is integrated in the network representation and provides a visual clue of the component structure as well as its position in the network. A separated view shows a “pruned tree’, which similarly to a classical tree-diagram shows part of the hierarchical structure. The user can interact with the symbolic representation to change the information displayed in the “pruned tree” view.
The next chapter presents a brief description of the data structure of a pathway. Chapter 3 groups tasks and requirements of a pathway visualization tool, and Chapter 4 introduces the reader to the more popular tool for the analysis of biological pathways and the more common visualization techniques implemented.
Chapter 5 presents BranchingSets, a visualization technique for representing categories on node-link diagrams. Chapter 6 describes a user study that demonstrated that BranchingSets is effective at helping users to recognize similar patterns and identify differences between graphs as well as to identify nodes that belong to multiple categories. For other tasks, such as simple intersections or membership tasks, our
5 technique was comparable to LineSets. Even when there was no quantitative difference is accuracy or speed, users indicated that our solution produces representations which are more easily comprehended and less cluttered when compared with Bubble Sets or LineSets. Chapter 7 illustrates the features of a prototype which leverages BranchingSets to explore the pathways structure and the interconnections between the components. Chapter 8 focuses on some implementation details relevant to our prototype and Chapter 9 compares our prototype to already existing tools and explain two simple use cases that illustrate how the features enabled by our prototype can help to explore biological evidences. Chapter 10 draws the conclusions of our work.
A MODEL FOR BIOLOGICAL PATHWAYS
In this chapter we explain the nature of the information stored in a pathway. Is not the purposes of this work to provide a formal and complete definition of the data structure of a pathway. Is instead our intention to introduce the reader to the pathway structure and fundamental entities, in order to better understand the requirements for a visualization technique and the kind of tasks requested by biologists. After an insight of the structure of the data, we present the most popular formats to store pathways information.
2.1 Model
The information stored in a biological pathways involves three major components: • Participant
A participant has a specific nature. It might be a protein, a compound, a gene. It is identified with a name and it is involved in one or more relationships;
• Relationship
A relationships involve two or more components. Various kind of relationships with different biological meaning are present in a pathways. They differentiate according to the directionality and the cardinality;
• Meta-data
The complex nature of the information stored in a pathway in enriched with additional data. A 6
7 meta-data usually represents information concerning the context of the pathway, links to addi-tional resources or personal comments or notes of the author.
The presented classification of the components of a pathways can be further detailed. Indeed, we identify three families of relationships which differs from each other for the biological meaning.
• Binary Relationships
A binary relationship involves two participants and is either directed or undirected. Example of directed binary relationship are catalyst and reactions, undirected relationships relationships are for instance simple interaction between proteins.
• Many to Many Relationships
Biological reactions might be originated from more than one participant and might produce more than one product. Representing this kind of relationships is usually more challenging than binary relationships.
• Many to one Relationships, or grouping
Participants of a pathways are often grouped in hierarchical structures. These are many to one relationships which identify whether a group of participants belongs or not to a given set. A set might by a compound, a complex or even a whole pathway.
Various kind of descriptions of the same pathway might be available according to the level of de-tail, the field, and the nature of the researches supported by the pathway. According to the different relationships and meta-data the description involves, the data structure can be modelled as a graph, a metagraph or an hypergraph. A graph involves only participants and binary relationships. Even if
this representation is extremely oversimplified, as explained later it is used to represents interactions between participants in large-scale networks.
A metagraph add to the graph the concept ofgrouping. One participant might group many partic-ipants. In a hypergraph relationships are no more restricted to be binary but can involve an arbitrary number of participants.
BranchingSets, the technique introduced in Chapter 5, shows binary relationships and grouping information. The binary relationships are encoded accordingly to the usual notation for directed node-link diagrams, whereas the grouping information is displayed by means of a smart coloring of node-links and nodes.
Furthermore, the tool presented in Chapter 7 integrates BranchingSets with an additional visualiza-tion to show hierarchical structures of biological components.
2.2 Pathway Data Formats
Pathway data can be stored in one of several file formats. In particular BioPAX (9), KEGG (10) and SBML are the most popular standards for storing the complex data structure described in the previous section. These formats are xml based and represent data as an ontology.
Other formats are employed for the visualization of biological pathways that are not specific to the field of biology. For instance SIF Simple Interaction Format used by Cytoscape (8) it is used to visualize undirected interactions between participants. Automated procedure to translate formats such as BioPAX to this simplified format are available.
CHAPTER 3
TASKS AND REQUIREMENTS ANALYSIS
In this chapter we detail the more relevant tasks performed by domain experts during the analysis of a biological pathways. From the description tasks we have inferred the requirements for a pathways visualization tool.
3.1 Tasks
In this section we compile a list of tasks relevant to biological pathway analysis. Task descriptions can be found in Table IV.
Task 1 Examine the upstream and downstream connections between two entities within a pathway.
Understanding how entities within pathways are connected are essential to most research related to pathway data. While some analyses involve undirected relationships between genes or gene products, studies of metabolic networks and other inter-cellular processes rely on directed relationships, which requires an understanding directed relationships between entities.
When discussing directed paths between entities, one entity is said to be upstream or downstream of another. As mentioned earlier, understanding upstream and downstream relationships is particularly
TABLE I. LIST OF TASKS code description
T1 Examine the upstream and down-stream connections between two enti-ties within a pathway
T2 Detect feedback loops of activation and inhibition within a pathway
T3 Examine high-level relation-ships between modules and pathways
T4 Analyze high-throughput omics data T5 Discover potential “causal”
mecha-nisms of up or down-regulation within a set of entities
T6 Simulate the effects of activation, inhi-bition, or knockout within a pathway T7 Incorporate new entities or
relation-ships into an existing pathway and ex-amine their effects
T8 Incorporate experimental results with pathway data
T9 Curate, edit, and “debug” path-way data files,
or construct user-defined path-ways from scratch
T10 Reveal levels of confidence or un-certainty associated with relationships within a pathway
11 important to domains such as cancer drug research, where a drug may affect a small subset of genes or gene products, which in turn will affect various downstream processes.
In most cases, a directed relationship is meant to represent a biochemical reaction, where one entity is consumed as a reactant and another is produced as a product. Thus, an upstream entity may be connected to a downstream entity through a chain of several directed links. In the most basic sense, the “entities” mentioned above are genes, gene products (such as proteins or complexes), or other small molecules within a cell. A researcher may be interested in understanding the path of reactions (or other relationships) that connects two entities.
It is important to note, however, that directed relationships in biological pathways can take a variety of forms, such as entities that that modulate, inhibit or activate the catalysis of other biochemical reac-tions (9).
Task 2 Detect feedback loops of activation and inhibition within a pathway.
A task that follows directly from Task 1 is the detection of feedback loops. Feedback loops are com-mon within metabolic activation networks, and they play a key role in processes related to uncontrolled cellular growth in cancerous cells.
While observing relationships between two individual entities may be important in certain contexts, sometimes might be significant to reveal complex relationships that go beyond simple connections be-tween individual entities. These complex relationships include abstract relationships bebe-tween high-level subsets of a pathway as well as compound relationships (many-to-many or many-to-one relationships) between groups of entities.
High-level relationships are characterized by abstract subsets of a pathway. In BioPAX pathway data, abstract relationships between pathways and other entities can exist, such as when, for example, a biochemical reaction is connected to an entire pathway through the abstract nextStep relationship. These high-level groupings are similar to reaction modules described in other contexts (11). Systems biologists are particularly interested in seeing the high-level structure of biological pathways.
Discovering high-level links across pathways is important in a number of domain contexts. In can-cer research, drugs can often influence many different gene products across several pathways. In some cases, existing drugs can be found to affect pathways related to several different therapeutic conditions. Understanding how several different gene products and pathways are affected by a drug is crucial to this research.
Task 4 Discover processes that are upstream or downstream of a given set of entities, and vice versa.
In a similar vein, researchers may be interested many-to-many or many-to-one relationships, called compound relationships, where an analysis is performed on a (potentially large) set of pathway entities.
13 This task is particularly relevant to researchers who work with high-throughput omics data involving hundreds or thousands of genes or gene products.
It is also important discovering downstream pathways that are common to a given set of proteins generated from mass spectrometry data. If, for example, a given set of proteins are all related to a certain cellular process via downstream connections, it may suggest to a researcher that the process in question is occurring within a given biological context. The process of discovering cellular processes related to a set of proteins (or other entities) can go in either direction; that is, a researcher may be interested in finding processes that are related to a given set of entities, or they may be interested in finding entities related to a given set of processes.
Task 5 Understand the hierarchial structure of protein complexes.
Compound relationships are also seen when examining protein complexes, which are represented as nested hierarchies of proteins. These hierarchies are particularly important to stem cell research.
Task 6 Analyze high-throughput omics data.
As mentioned in the discussion of Task 4, a researcher may want to analyze a large collection of hun-dreds or thousands of proteins (or other gene products). High-throughput omics data has increasingly become an essential part of modern biology (12). Researchers might need to incorporate large lists of entites in their analyses.
Task 7 Discover potential “causal” mechanisms of up or down-regulation within a set of entities.
Causal networks are important in the analysis of large-scale gene expression data. Ideally, a causal network would detect the likely regulators of a set of genes that are observed to be up-regulated or down-regulated in a particular setting (13) (14). This task is similar to Task 2, but requires a more com-plex algorithmic approach (such as in (14)) that can detect entities of interest based on their regulatory relationships within a pathway.
Task 8 Simulate the effects of activation, inhibition, or knockout within a pathway.
Simulation would be an especially useful tool to researchers, Indeed, the ability to simulate the effects of activation, inhibition, or knockout (removal of a gene or gene product) as being especially powerful in a number of analytic settings.
Task 9 Incorporate new entities or relationships into an existing pathway and examine their effects.
When exploring unknown relationships within pathways related to certain types of cancer, the abil-ity to add new relationships to an existing pathway, and to examine the regulatory effects of the novel relationship, would be especially useful.
15 Task 10 Incorporate experimental results with pathway data.
Biological analyses are rarely focused solely on the structure and connectivity of pathway networks, and experimental data is at the crux of most biological studies. Pathway data alone would be essentially useless without the ability to incorporate the results of their experiments. For example, cancer research often involves comparing gene expression profiles between cancerous and healthy cells (15).
Task 11 Curate, edit, and “debug” pathway data files, or construct user-defined pathways from scratch.
Certain tasks are related to the curation, maintenance, and understanding of pathway data. For in-stance, would be useful being able to debug potentially flawed data, or create “personalized” pathways that only include a user-determined subset of entities and relationships, that can comes from different pathways and match a list of user-defined queries.
Task 12 Reveal levels of confidence or uncertainty associated with relationships within a pathway. A relationship between two participants might be associated with a probability. This probability rep-resents the degree of confidence that the interaction manifests and it is a relevant information to dis-play. For example, each relationship within a BioPAX file is usually associated with a publication that provides evidence for its existence. Thus, some relationships may not be widely accepted within the scientific community, while others may have more robust empirical support.
3.2 Requirements
TABLE II
LIST OF REQUIREMENTS TO SUPPORT THE TASKS T1-11 code description
R1 Effective labeling of pathway entities. R2 Show individual meta-data on demand. R3 Effective display of relationship type
and directionality. R4 Search, filter, and select.
R5 Network measures and complex queries.
R6 Simulation.
R7 Display hierarchical structures. R8 Display compound relationships. R9 Incorporate multiple interactive
lay-outs.
R10 Analyses of multiple pathways. R11 Incorporate multiple views. R12 Visual incorporation of meta-data. R13 Pathway curation, creation, and
nota-tion.
R14 Incorporate online databases. R15 High-throughput data processing.
17 We have listed in the previos section the essential tasks necessary to perform useful analyses of biological pathway data. We now use these tasks to identify the requirements of a platform for effective pathway analysis. Table II lists these requirements and their relations to tasks mentioned in the previous section.
Requirement 1 Effective labeling of pathway entities.
The display of pathway entities is obviously essential to any analysis of pathway data. A particular challenge is the labeling of pathway entities and relationships. Biological entities such as protein com-plexes can be especially long, making the placement of labels within, for example, a node-link diagram especially challenging.
Requirement 2 Show individual meta-data on demand.
Any one entity or relationship within a pathway may be associated with a considerable amount of meta-data, such as chemical composition,
Requirement 3 Effective display of relationship type and directionality.
While gene regulatory networks may include only one or two types of relationship between entities, metabolic pathways can include a wide variety of relationship type. For example, a biochemical reaction
(e.g. in BioPAX pathways) is a relationship between multiple entities that could represent a variety of biological processes, such as regulation, binding, dissociation, transport, activation, inactivation, phosphorylation, degradation, etc. The number of relationship types makes visual encoding difficult — encoding relationship type with color, for example, would be visually overwhelming.
In metabolic networks, relationships are also directed, and therefore an effective visual tool must encode relationship directionality. Arrowheads may occlude each other and introduce visual clutter as the number of relationships increases. Certain visual techniques have incorporated color gradients or opacity to indicate direction, although this can also require additional visual parsing by the viewer.
Requirement 4 Search, filter, and select.
Given a potentially large amount of pathway data, the ability to search for entities and to visually filter pathway data is essential. Ideally, a textual search (or filter) would interactively and instantaneously display results. Users should also be able to easily create selections of entities and relationships by brushing or clicking, and selections should remain consistent across linked views (see Requirement 11). This requirement could also be a complement to Requirement 3, as users may wish to filter or high-light a certain type of relationship or relationships. This requirement helps enable Tasks 8, 2, and 7, where an analyst may wish to highlight specific relationships of activation, inhibition, upregulation, or downregulation.
19 Requirement 5 Network measures and complex queries.
The ability to perform complex network queries is essential to many of the tasks listed in the previ-ous section, including Tasks 8, 2, 4, and 7. As framed in the task descriptions, network measures could include shortest paths between two nodes (two entities), as well as complex queries aimed at identifying pathways or processes that are common to a selected set of entities.
Requirement 6 Simulation.
The ability to simulate particular events within a pathway would be particularly powerful, as discussed in relation to Task 7. Users could, for example, simulate activation, inhibition, or complete removal of a gene or gene product and observe the effects on the pathway.
Requirement 7 Display hierarchical structures.
Common pathway data formats such as BioPAX are inherently hierarchical. For example, pathways can be nested within other pathways, representing a biological hierarchy of low-level processes that act as components in high-level processes such as cellular replication. Task 3 specifically necessitates a way of viewing these hierarchical groupings, and an effective visualization would allow a user to inter-actively move between high-level and low-level views, e.g. by “collapsing” levels of the hierarchy.
Requirement 8 Display compound relationships.
Tasks 4 and 5 are both related to compound relationships, where many entities (e.g. proteins within a complex) are may be collectively connected to other entities (or other compound groupings). Represent-ing these compound connections is not trivial. As mentioned earlier, the relationships themselves may be abstract, such as when entities and pathways are connected via the nextStep property in BioPAX data.
Requirement 9 Incorporate multiple interactive layouts.
One of the most important considerations of any pathway visualization tool are the layout mecha-nisms available to the user. Pathway layout algorithms must balance a number of factors. Contextual information within a pathway diagram is a popular solution. Indeed, many common pathway layouts include visual cues — such as membrane boundaries — indicating where certain entities are located within a cell. Including these contextual cues is useful to biologists who are accustomed to seeing illustrations of cellular structure.
On the other hand, representing cellular structure can be limiting. Abstract views of directed network data can reveal patterns and clusters that may not be apparent using other methods. Careful design of pathway layouts can also help mitigate labelling issues related to Requirement 1. Layouts can also harness more abstract patterns within pathway data, such as a topology of relationships, where upstream and downstream entities may be visually separated.
21 Ideally, layouts would also allow a user to interactively position nodes, and layout transitions would maintain object consistency (16).
Requirement 10 Analyses of multiple pathways.
A number of tasks (such as Tasks 1, 2, 4, and 7) inherently require the use of multiple pathways. In some cases, relationships may be found across “distant” pathways, while in other cases pathways may be merged or connected through network queries, as in Requirement 5.
Requirement 11 Incorporate multiple views.
Given the difficulty of designing an “ideal” layout, and with the requirement that a tool be able to analyze multiple pathways simultaneously, an effective visual tool will incorporate multiple linked views, which gives an analyst several “views” of a given pathway.
Requirement 12 Visual incorporation of meta-data.
Essential to many biological analyses is the incorporation of experimental meta-data, as mentioned in the discussion of Task 10. Meta-data may include gene expression levels or other experimental results related to specific entities. Careful integration of meta-data can enable effective analyses, but attention to design is crucial, as the potential for visual clutter is high.
Meta-data may also include visual representations of uncertainty, which would enable Task 12.
Requirement 13 Pathway curation, creation, and notation.
Task 11 leads directly to this requirement, which would allow an analyst to interactively manipulate and curate pathway data.
Requirement 14 Incorporate online databases.
The immensely large and highly connected nature of biological data makes manually loading a truly comprehensive dataset into an offline application difficult or impossible, meaning that any offline application must be limited to analyses of “local” datasets.
With a growing set of publicly-accessible biological databases with comprehensive APIs, an effec-tive pathway visualization platform will allow an analyst to perform queries on these databases.
Requirement 15 High-throughput data processing.
Task 6 specifically necessitates the ability to analyze large sets of data at once. High-throughput omics data involves that analysis of hundreds or thousands of genes or gene producs, and an especially powerful pathway analytics platform would allow network queries and visual analytics to be performed across large sets of entities simultaneously.
CHAPTER 4 RELATED WORK
In this chapter we first introduce in Section 4.1 the traditional visual techniques commonly used to represents the types of data stored in a pathway, which are relational data, hierarchical data and grouping information. Section 4.2 presents an overview of different pathway visualization tools, which implements the mentioned visual techniques. Section 4.3 lists the future challenges of this field. 4.1 Visual Encodings and Representations
Having reviewed the tasks and requirements relevant to effective pathway visualizations, we now present an overview of different visualization techniques. We organize the techniques into three groups: graph, sets and hierarchies. Some of the methods discussed in this section are abstract visual represen-tations that mat not yet be implemented in existing tools, but that fulfill requirements highlighted in the previous chapter.
4.1.1 Graph visualizations
Any pathway data can be represented in the abstract as a graph of vertices (such as genes, proteins, or complexes) and edges (such as biochemical reactions). The most common visual representation of a graph is a node-link diagram, where vertices are represented with shapes, such as circles or rectangles, and edges — or links — are line-segments that connect nodes together. In node-link representations, different shapes and colors can be used to encode additional information such as a node attribute or link direction.
A crucial aspect of any node-link diagram is the choice of node layout. Node-link representations fall into two broad categories: Diagrams that are automatically determined by an algorithm and diagrams where nodes are placed manually by human curators (such as KEGG (10) diagrams).
4.1.1.1 Human curated node-link diagrams
Publications in molecular biology frequently present biological pathways with human-generated figures. Human creators have the flexibility to arrange visual elements in ways that make representations human readable and this can allow authors to efficiently encode large volumes of complex information. The human-generated nature of these diagrams allows this complex information to be encoded through clear spatial layouts, organizing the pathway in a meaningful way.
The hand-made approach to pathway diagram creation has been replicated digitally in public databases, such as the Kyoto Encyclopedia of Genes and Genomes (10). The KEGG database is a very popular re-source for human-generated pathway diagrams, and many tools incorporate KEGG diagrams in their vi-sualizations, often in tandem with additional interactive functionality. This widely-used database allows for clear communication and dissemination of established pathways. Human-curated representations may also allow for interactive re-arrangement by the user.
While human-curated diagrams preserve the layout and presentation of pathway information, they have several drawbacks. Creating, updating, or modifying figures is a labor-intensive process. Any new data cannot be automatically applied to existing figures. Moreover, these human generated figures do not easily scale to large, complex pathways. As a pathway increases in size and complexity, human effort also increases considerably. These limitations are major problems in a research community that is continually generating and updating molecular pathway data.
25 4.1.1.2 Automatically generated node-link diagrams
Several algorithms exist which automatically produce interactive pathway visualizations from struc-tured pathway data, rather than relying on layouts generated by hand. The visualizations produced by these tools mimic the style and visual encoding of human-generated figures in an attempt to to commu-nicate complex network information efficiently. As the layout is computed algorithmically, it is easily updated with new data without requiring extra human effort as networks increase in size. Different au-tomatic layout techniques may be designed to optimize some visual parameter, such the efficient use of a given space, a reduction in edge overlap, the recognition of certain clusters or patterns, or the visual separation of certain types of nodes or links. Clearly, a layout algorithm can aim to optimize only a few of these metrics.
A Force-directed Layout is a popular technique that computes the position of nodes with a relaxing layout algorithm which models nodes within the network as physical entities. This algorithm results in a graphical representation that tends to organize the graph based on the density of the connections within clusters of nodes. Even when force-directed algorithm does not directly aim to minimize edge crossings (some algorithms do), the resulting visual representation tends to bring highly connected groups of nodes close together, which in turn results in a reduction in overall edge overlap.
When graphs become large and dense, and the number of nodes and connections increases, edge overlap becomes more prevalent and often cannot be avoided. Layout techniques that aim to mitigate edge overlap include the Circular Layout, which tends to scale well when nodes are carefully ordered. However, the resulting representation tends to show overall clustering of connections, and detailed views of individual relationships are often occluded.
Other techniques aim to reduce edge crossings by duplicating nodes. However, as pointed out by Bourqui et al. (17), analysis tasks that rely on an understanding of the graph topology might be hampered by the adoption of node-duplication techniques.
Edge overlap and general visual clutter can also be reduced through node reduction. Kimelman et al. propose three possible approaches (18) to implement node reduction: Ghosting, hiding and grouping. Ghosting de-emphasizes nodes, Hiding completely removes a selection of nodes and Grouping joins nodes in new super-node representation.
Grouping nodes is frequently used in pathway visualizations, and pertains directly to Requirement 7. For instance, a pathway might be interactively collapsed into a single node.
Edge Bundling is a technique that can complement other graph layout algorithms. Edge Bundling is not itself a graph layout technique, but a technique for drawing edges between nodes in an attempt to reduce clutter and improve readability, and is especially useful in cases of excessive edge overlap (19). The technique trades readability for a lack of detail — it may be difficult or impossible to discern individual connections when edge bundling is used.
Another technique that is meant to enhance graph layout techniques is fisheye distortion, which operates as an interactive “lens,” enhancing details over a user-defined portion of a graph, enabling better inspection of the nodes and interconnections in a given area.
Basic node-link diagrams are usually not comprehensive enough to represent an entire pathway data structure. As mentioned in the discussion of Requirement 8, a pathway often contains compound nodes and relationships that group many entities. A biochemical reaction can be characterized as a hyperedge, usually connecting two or more inputs to two or more outputs. Moreover, the links between nodes might
27
Figure 1. The image represents some techniques for representing categories on graph structures:a) The node is divided in multiple fans colored accordingly to the categoryb) Nodes and edges have
colored contoursc) KelpFusion d) LineSets
convey a wide variety of meanings, as discussed in Requirement 3. In the following sections we discuss alternative visualization techniques that can account for these complicated relationships in various ways. 4.1.2 Visualizing Categories on Node-Link Diagrams
Set visualization techniques can be used to encode the many-to-one relationships found in most bio-logical pathways. These compound relationships are important to Requirement 8, and set visualizations can be combined with node-link approaches in an effective visualization platform.
A range of techniques have been introduced to represent group information within node-link dia-grams. Some techniques assign different colors to nodes within different groups. Glyphs can used to indicate nodes that belong to multiple categories; Ware et al. (20) defines glyphs as “graphical objects designed to convey multiple data value”. One example of a technique which makes use of glyphs is described by Itoh et al. (21), which subdivides nodes in multiple fans, similar to a pie chart, giving each fan a distinctive color and size to indicate that the node belongs to multiple categories and to indicate the strength of that membership (22).
Other techniques have been designed specifically to visualize the set membership of elements, but can be adapted to represent categories on node-link diagrams. Traditional Euler Diagrams and other techniques that make use of convex boundaries to group elements together (23) can lead to visually confusing representations if the data contains multiple set intersections that cause the elements to not fit within the boundaries of the set. GMap, introduced by Gansner et al. (24), is another method for overlaying group information over node-link diagrams. It uses a map metaphor to group members into “countries”, “seas”, and “lakes”. A limitation of this technique is the inability to visualize multiple intersections. For this reason a range of alternative visualization techniques have been developed to display elements belonging to more than one set.
Bubble Sets (25), LineSets (26), and KelpFusion (27) are techniques that address the challenge of representing set membership even when there are multiple intersections. Each of these techniques is designed, or can be adapted, to be overlaid on top of existing visualizations (for example, on top of geographical maps). Bubble Sets displays set relations using isocountours, which can produce
problem-29 atic representations when an element belongs to many multiple sets, in some cases causing elements to appear included in the wrong sets.
A technique by Alper et al. called LineSets (26) represents sets as smooth curves and uses distinct colors to indicate set membership. All the nodes which belong to the same set are connected by curved lines, and nodes which belong to multiple sets are located at the intersection of multiple lines. Identi-fying all the nodes that belongs to a given set can be done by finding the respective curve and visually following all the nodes placed on the line, similar to finding which subway stops are on a particular subway line. Intersection between sets can be identified by looking for the nodes placed on curve inter-sections. This solution generally offers better readability when multiple sets overlap than BubbleSets.
KelpFusion (27) uses continuous boundaries made by lines and hulls. The visual appearance is generally comparable or better than LineSets, but it strongly depends on the spatial arrangements of ele-ments. Hulls are used to group together elements which are both spatially close and belong to the same set. They are less effective when applied to node-link diagrams that don’t have an intrinsic geospatial meaning.
Other solutions are explicitly designed for both the representation of sets and for the identification of patterns in a graph representation. Antoine Lambert et al. (28), for example, propose a solution which assigns a color to every set and simultaneously colors nodes according to the set to which they belong. When a node belongs to multiple sets, multiple colored contours are used. A similar technique, which also uses node coloring, is adopted by Takayuki Itoh et al. (21). In this solution, nodes which belong to multiple categories are subdivided in multiple “fans.” With these techniques, the visual cost – in terms of clutter and color overlap – increases with the number of categories in the data.
Figure 2. The image represents the most common technique for representing tree structures:a) A traditional tree diagramb) tree diagram with a circular layout c) Tree Map d) H tree e) Circle Packing
Figure 1 illustrates some of the techniques detailed in this section. 4.1.3 Hierarchical Techniques
As mentioned earlier in the discussion of Requirement 7, pathways are often deeply hierarchical. As mentioned in Requirement 7, a pathway usually contains multiple sub-pathways, and a protein complex can represent a are often nested hierarchy of constituent proteins. Conventional representations of hier-archical structures with tree diagrams are prone to visual clutter and poor readability as the amount of leaves and the depth of the tree increases. For this reason, different visualization techniques have been developed to efficiently represent complex hierarchical structures.
31 A Radial View is a tree diagram that uses a circular layout in an attempt to more efficient use of a two-dimensional space. With deeply nested trees, a Radial View can suffer from the same issues seen with more “traditional” tree diagrams. An alternative representation is seen in the H-tree layout, which positions nodes by using only orthogonal and perpendicular links, which helps eliminate edge crossings and optimize space.
Circle Packing (29) is a technique which presents hierarchical elements as nested circles. This technique provides an efficient overview of a tree structure, however it may be difficult to adapt to more complex and deeply-nested trees. In terms of biological pathways, circle packing layouts may be useful for the understanding of hierarchial structures such as proteins that are nested within complexes, as in Requirement 7. However, a pathway might contain complexes with hundreds of proteins and dozens of sub-complexes. Circle Packing layouts also present a challenge when it comes to readable labels (Requirement 1). Furthermore, understanding the path through a hierarchy from the root node to to a leaf element is challenging with a circle packing layout.
Another representation of hierarchical structure is the Tree Map. A tree map places components within rectangles with areas proportional to some given metric. This technique is popular in represent-ing, for example, the memory usage in hard drive, but it may have only limited utility in representing biological pathway data. The spactial organization of a Tree Map enables an intuitive understanding of the organization of a structure, but is very difficult to parse when a tree is more than two or three levels deep.
4.1.4 Matrix-Based Techniques
Matrix representations act as an alternative to node-link diagrams in representing graphs. Matrix representations excel in their ability to show densely connected graphs while minimizing visual clutter. Matrix representations present a significant challenge for pathway data, as paths connecting more than two entities can be very difficult to follow. However, matrix views may be an important alternative view of very densely connected biological pathways, such as with large gene regulatory networks.
33 4.2 Tools
TABLE III. COMPARISON BETWEEN THE REQUIREMENTS IMPLEMENTED IN POPULAR TOOLS FOR PATHWAY VISUALIZATION
Tools R1 R2 R3 R4 R5 R6 R7 R8 R8 R9 R10 R11 R12 R13 R14 R15 Entourage Reactome VisAnt VidaPad ChiBe BioFabric MetaViz
In this section we examine and compare several existing tools for the visualization of biological pathways. Particular attention is given to which requirements detailed in Section 3.2 are implemented in each tool. Table V summarizes these relationships.
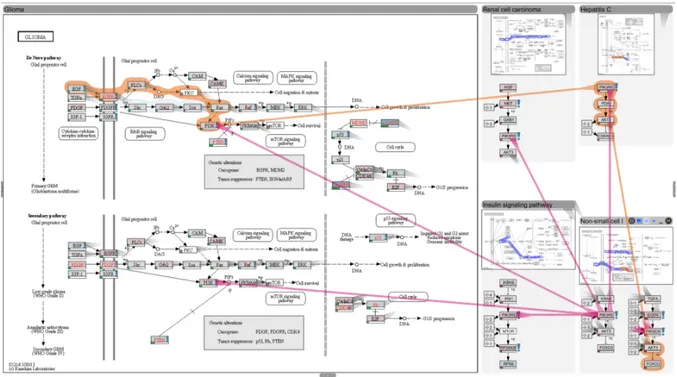
Broadly speaking, current tools make use of one of three primary visual representations: node-link diagrams, node-node-link diagrams with compound nodes, and adjacency matrices. We look at En-tourage (15), Reactome Pathway Browser (30), VisAnt (31), MetaViz (17) and VitaPad (32), each of which leverages a traditional node-link diagram.
ChiBE (33) is notable for being one of the first pathway visualization tools to employ compound nodes, which can contain either the proteins contained within a complex, or can indicate the cellu-lar location of many pathway compontents. ChiBE provides a basic pannable and zoomable view of a pathway, and includes the abillity to display node details on demand through user interaction. Al-though certain limited analytical functions are available, ChiBE is more well-suited to the construction or curation of pathways, rather than to insightful pathway analysis.
Reactome Pathway Browser is a tool for visualizing pathway diagrams included in the Reactome database. It offers basic navigation and limited interactivity. It presents a very fixed layout and it does not enable the layering of different information levels in the same representation. It makes use of side panels to enable the inspection of complexes structure and analysis data. The Reactome Pathway Browser does not enable the simultaneous visualization of multiple pathways but, given a component, it allows the user to navigate through its related pathways.
Entourage (15) – also a part of Caleydo (34) – allows for the display of both pharmacological and genomic data related to selected gene products that span multiple pathways. Combining functional data with multiple pathway views makes Entourage a powerful tool for molecular genomics research.
Entourage (15) is a component of the Caleydo (34) framework that displays relationships between proteins and other gene products across multiple pathways. To this end it employs a novel algorithm that extracts contextual pathways from larger pathways. Contextual subsets show small portions of a pathway that contain selected proteins of interest. Because the display size of each contextual subset is relatively small, many can be displayed at once, which allows Entourage to provide linked views of several pathways that share certain proteins of interest (see Figure 3). Multiple pathways and
sub-35 pathways are represented in isolated views, which preserves the pathway structure but introduces node redundancy. Links connect proteins or complexes that are shared across pathways, and unless requested by user interaction, these links are reduced to partial “stubs” in order to reduce visual clutter. The Bubble Set technique is used to highlight selected pathways and visual links are used to connect nodes that are actually the same node.
Entourage also allows for the display of both pharmacological and genomic data related to selected gene products that span multiple pathways. Combining functional data with multiple pathway views makes Entourage a powerful tool for molecular genomics research.
Figure 3. A view of Entourage showing links between a larger “focus pathway” and several “context pathways.”
Figure 4. Visualizing hundreds of nodes and links with Biofabric
Furthermore, both Entourage and Reactome Pathway Browser enable the user to integrate experi-mental data. Entourage prefers to visualize the experiment information as side panels, whereas Reac-tome combine the path visualization with additional visual encoding to show gene expression and other values (Figure 5)
Other tools implement functionalities that enable the representation of multiple pathways in the same view, such as MetaViz. MetaViz visualizes multiple metabolic pathways simultaneously, which allows topological analysis and avoids the duplication of biological components. This method offers different ways to present metabolisms depending on the pathway that the user wishes to focus on. The desired pathway will be the only one to follow a representation which flows from the top to the bottom accordingly the topological ordering of components.
BioFabric also enables the exploration of large biological networks composed by multiple pathways without replicating nodes. This somewhat unconventional tool is meant to visualize extremely large
37
Figure 5. Visualizing different gene expression with Reactome Pathway Browser
networks composed by up to thousands of nodes. However, its design is not specifically conceived for pathway visualization and then it does not implements any pathways-specific task. However, this tools can import SIF files which are commonly used for pathways visualization. Figure 4 represents a network with hundreds of nodes and links. Elements are represented with horizontal lines, links with vertical lines. Altough this tools is considerably less intuitive than node-link diagram, it enable the representation of large network without losing deatils.
VisAnt (31) enables a wide range of exploratory questions and topology tasks. The tasks it allows include the search of the shortest paths between two nodes (35) and the individuation of dense nodes. The positions of the nodes in the graph are computed with a relaxing layout algorithm which models the network as a physical entities. This algorithm builds a graphical representation that organize the graph by density of the connections between cluster of nodes. Diagrams can include abstract nodes that extend beyond the typical components found in a biological pathway. Diseases, genes, therapies, and drugs are presented together in the same graph with more “typical” pathway components such as