SIMULATION OF A VEHICULAR TRAFFIC
SYSTEM BASED ON QUEUING
NETWORK MODELS
LEONARDO PASINI
ANDLORENZO BIANCHINI
Department of Computer Science, University of Camerino Via Madonna delle Carceri, 62032 Camerino, Italy (received: 25 October 2018; revised: 3 December 2018; accepted: 21 December 2018; published online: 9 January 2019)
Abstract: This work is part of the research activities developed in our department on the construction of vehicle traffic system simulators (TASKQuart. 22 (2) 135 [1], 20 (1) 9 [2], 17 (3) 155 [3], 20 (3) 273 [5], 14 (4) 405 [6], 9 (4) 397 [7], Simulation Modelling Practice and Theory 17 (4) 625 [8]). The modeling of the traffic system is implemented through the use of queuing networks. In this case we analyze, through a simulation, the impact on traffic flows of a structural change that the Municipal Administration has implemented on the urban road system. The study refers to some works published by us previously about the procedures applied by us to build a simulator. In this case we have developed software allowing us to analyze the data tracked by the system simulations to display it graphically. This procedure enables us to clearly compare the traffic system behavior in its new configuration with the traffic system behavior in the previous configuration.
Keywords: vehicular traffic systems, queuing networks, modeling and simulation DOI: https://doi.org/10.17466/tq2019/23.1/g
1. Introduction
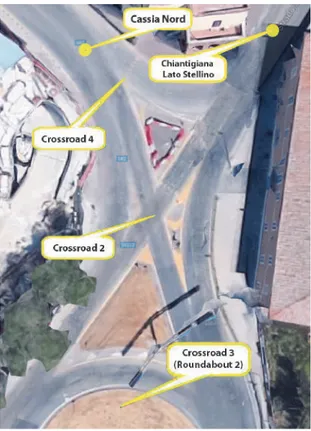
In this paper we study the behavior of vehicular flows in the Siena North road network illustrated in Figure 1. In particular we consider the changes that have recently been made to this system by the Municipal Administration. The intervention area is highlighted in Figure 1 by an ellipse containing the crossroads of the system that has been modified.
Referring to the results already presented in some previous works [1, 2], we develop the following issues:
1. Modeling of the current road system;
2. Generation of the model.dat file updated to the current system data; 3. Simulation of the traffic flow in the system;
4. Development of an application to display the results; 5. Comparison of results.
Figure 1. Siena North system
Therefore, this study consists in the evaluation of the impact of the changes made to the road system on the vehicular flows that characterize this area of the road network of Siena. In relation to our previous works [1, 2] in which we studied the Siena North road system in its original configuration, the new system is characterized by the fact that Crossroad 4 was removed and the functionality of Crossroad 2 was modified.
The following image illustrates the original configuration of the system before changes were made.
Figure 2 shows the system before the change, highlighting how the traffic will be regulated by two different crossroads, one directing vehicles in Cassia Nord (Crossroad 4), and the other towards Roundabout 2 (Crossroad 3).
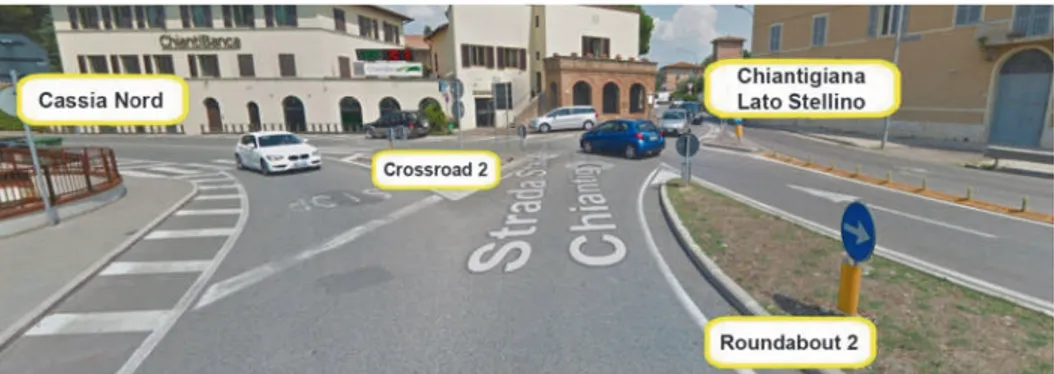
Below we report some images of the modified system taken by Street View. The new system manages traffic through a single crossroad in proximity of the Chiantigiana Lato Stellino road, prioritizing vehicles coming from Rounda-bout 2 and heading to the Cassia Nord road.
2. Modeling
The model of the system in the current configuration is illustrated in Figure 9. This model is composed by three crossroads identified as:
• Crossroad 1: it is Roundabout 1 which is located in the northern area of the
Figure 2. System structure before changes
• Crossroad 2: it is the intersection that regulates the flow of vehicular traffic
coming from Roundabout 1 towards Roundabout 2 or towards Cassia Nord, the vehicular flow from via Cassia Nord towards Roundabout 2 and the vehicular flows from Roundabout 2 towards via Cassia Nord.
• Crossroad 3: it is Roundabout 2 which is located in the southern area of the
system.
Figure 9 illustrates how Roundabout 1 manages vehicular flows coming from the Chantigiana national road, the Castellina in Chianti side, Via Valle D’Aosta, Via Montecelso, the Chiantigiana national road, the Stellino side and from Strada Fiume.
Roundabout 2 manages traffic flows from Via Cassia Nord, Via delle Province, Via Fiorentina and the Chiantigiana national road, the Stellino side, which connects this second roundabout with the northern one.
Roads are numbered so that these identifiers can be used in the model.dat file, which will be described later in this work. Two-way streets are considered individually by being represented with two different numbers in the model. The different coloring of roads is described according to the scheme shown below: – red indicates exit roads, i.e. roads that lead vehicular flows outside of the
Figure 3. Crossroad 2 sideways
Figure 4. Crossroad 2 view from Roundabout 2
Figure 5. Crossroad 2 view from Chiantigiana Lato Stellino
Figure 7. Crossroad 2, view from via Cassia Nord
Figure 8. Crossroad 2, view from Roundabout 2
– green indicates entrance roads. These roads are connected to a device that generates incoming vehicles by reproducing flows that have been detected by the Municipal Administration,
– yellow indicates internal system roads.
In summary, we have a total of 18 routes which are: – 7 entry roads (1, 3, 5, 9, 11, 14, 16)
– 7 exit roads (2, 4, 8, 10, 13, 15, 18) – 4 internal roads (6, 7, 12, 17).
3. Crossroads
In this section we present the modeling of the single crossroads of the Siena Nord road system in its new configuration. At the base of the modeling of each crossroad we have the object Sections, which are strictly related to the previous works. In particular, in the modeling we use the following Section types:
– Input Section, in the graphic representation of the model they are shown as green circles. These sections model the vehicle entry areas on the crossroad, they are similar to the channeling lanes of the vehicular flows entering the intersection.
Figure 9. Current System showing road numbers
– Output Section, in the graphic representation of the model they are shown as red circles. These sections model the vehicles exit areas on the crossroad, they connect the crossroad to the exit roads from the intersection.
– Internal Section, in the graphic representation of the model they are shown as yellow squares in crossroads that are simple intersections, while on the roundabouts they are represented by arcs. These sections model the internal
areas of the crossroad that can be occupied simultaneously by a limited number of vehicles. The appropriately grouped internal sections determine what we call the crossing paths that a vehicle can follow during its movement within the intersection.
In the next paragraphs the input, output sections and the paths that can be crossed for each crossroad will be shown. Each section corresponds to a numeric
ID that uniquely identifies them in the model.dat file, a file that summarizes all
the data of the model.
3.1. Crossroad 1: Roundabout 1
Figure 10. Roundabout 1 with input and output sections
Roundabout 1 has 5 input sections and 5 output sections. Let us analyze the input sections:
• Input Section 1: the access point to the roundabout for vehicles coming from
the Chiantigiana national road, Castellina in Chianti side;
• Input Section 2: the access point to the roundabout for vehicles coming from
Via Valle D’Aosta;
• Input Section 3: the access point to the roundabout for vehicles coming from
Via Montecelso;
• Input Section 4: the access point to the roundabout for vehicles coming from
the Chiantigiana state road, Stellino side;
• Input Section 5: the access point to the roundabout for vehicles coming from
Strada Fiume.
Let us analyze the outputs sections:
• Output Section 1: the exit point from the roundabout that leads to Via Valle
D’Aosta;
• Output Section 2: the exit point from the roundabout that leads to via
Montecelso;
• Output Section 3: the exit point from the roundabout that leads to the
• Output Section 4: the exit point from the roundabout that leads to Strada Fiume;
• Output Section 5: the exit point from the roundabout that leads to the
Chiantigiana national road, Castellina in Chianti side.
Figure 11 shows the modeling of Roundabout 1 in which the input sections, the internal sections and the output sections are identified.
Figure 11. Roundabout 1 with input, internal and output sections
3.2. Crossroad 2: new structure
Figures 12 and 13 illustrate the structure of intersections 2 and 4 in the previous system presented in the work [2].
Figure 12. Crossroad 2 of the previous
system Figure 13. Crossroad 4 of the previoussystem
Figure 14 illustrates the modeling of Crossroad 2 in the new configuration of the Siena Nord road system. The new configuration simplifies the overall structure of the system, since the flow of vehicles coming from Roundabout 1
Figure 14. Crossroad 2 of the current system with input and output sections
along via Chiantigiana, Stellino side, is no longer separated in the two independent vehicular flows directed towards via Cassia Nord and towards Roundabout 2. The separation point of these two flows in the previous structure of the road system was located at the end of Road 6 which merged into the two streets 11 and 12. These streets constituted an entry channel towards Intersection 4 and Intersection 2, respectively [2].
In the new configuration of the system, Road 6 ends at Intersection 2, as shown in Figure 9. Therefore, the new traffic system configuration is characterized by the fact that Crossroads 2 and 4 of the system have been reduced to Crossroad 2 only.
Crossroad 2 has 3 input sections and 2 output sections. Let us analyze the input sections:
• Input Section 1: the section from which vehicles coming from Roundabout 1
cross the Chiantigiana national road, Stellino side, southwards;
• Input Section 2: the section from which vehicles coming from via Cassia Nord
go towards Roundabout 2;
• Input Section 3: the section from which vehicles that have crossed Roundabout 2
go towards via Cassia Nord.
Let us analyze the output sections:
• Output Section 1: the exit point leading to via Cassia Nord;
• Output Section 2: the exit point leading to Roundabout 2.
The following figures show the possible crossing paths of the crossroad that a vehicle can follow according to its entry section. From Input Section 1 a vehicle can head south towards Output Section 2 (Figure 15 (a)), or it can turn right towards Output Section 1 (Figure 16 (a)). These intersection crossing paths are described in more detail in Figures 15 (b) and 16 (b) in which the internal sections contained in their respective crossing paths are shown.
(a) (b)
Figure 15. (a) The path of a vehicle coming from Entrance 1 towards Exit 2. (b) Internal sections crossed by a vehicle coming from Entrance 1 towards Exit 2
(a) (b)
Figure 16. (a) The path of a vehicle coming from Entrance 1 towards Exit 1. (b) Internal sections crossed by a vehicle coming from Entrance 1 towards Exit 1
Regarding Input Section 2, the only admissible crossing path is the one going south towards Roundabout 2, as shown in Figure 17 (a) and in Figure 17 (b).
Finally, coming from Input Section 3 a vehicle can only continue towards Cassia Nord, i.e., Output Section 1 as shown in Figure 18 (a) and Figure 18 (b).
3.3. Crossroad 3: Roundabout 2
Roundabout 2 has 4 input sections and 4 output sections. Let us analyze the input sections:
• Input Section 1: is the access point to the roundabout for vehicles coming from
(a) (b)
Figure 17. (a) Path crossed by a vehicle coming from Entrance 2. (b) Internal sections crossed by a vehicle coming from Entrance 2
(a) (b)
Figure 18. (a) Path crossed by a vehicle coming from Entrance 3. (b) Internal sections crossed by a vehicle coming from Entrance 3
• Input Section 2: is the access point to the roundabout for vehicles coming from
Via Delle Province;
• Input Section 3: is the access point to the roundabout for vehicles coming from
the internal road lane of Via Fiorentina;
• input Section 4: is the access point to the roundabout for vehicles coming from
the external road lane of via Fiorentina. Let us analyze the output sections:
• Output Section 1: is the exit point from the roundabout that leads to Via Delle
Figure 19. Roundabout 2 with entrance and exit sections
• Output Section 2: is the exit point from the roundabout that leads to Via
Fiorentina;
• Output Section 3: is the exit point from the roundabout that enters the internal
road number 17 in the model, leading to Crossroad 2;
• Output Section 4: is the exit point from the roundabout that leads to the
Chiantigiana (Lato Stellino) state road reaching Roundabout 1.
Figure 20 shows the modeling of Roundabout 2 in which the input sections, the internal sections and the output sections are identified.
Figure 20. Roundabout 2 with input, internal and output sections
4. Traffic data
The vehicular traffic data of the Siena Nord system were provided by the Municipal Administration. The data was estimated at the entry and exit points of the system paying particular attention to the entrances and exits of the roundabouts that are parts of the system. The conducted detection counted the
number of vehicles in transit through the entrances and exits of the system in 10-minute time intervals into which the three time slots of interest for the study were divided.
The sampling time slots are as follows: • 7:30–9:20
• 12:00–13:50 • 17:30–19:20
During the simulation of each time slot the variation of the input and output frequencies relative to the 10 minute intervals is reproduced through the use of specific Timers that activate data updating procedures at the end of each 10 minute interval without interrupting the simulation. In this way we are able to simulate variations of both traffic flows and probabilities of routing vehicles that take place in the system during simulation of each of the three time slots indicated above.
Table 1 contains the traffic flow data detected by the Municipality of Siena for each of the entry and exit points of the two roundabouts in the Siena Nord traffic system.
5. Building the model
The traffic system modeling is based on the use of complex objects that are composed by queue service devices. These objects were defined in a library that we presented in a previous work [3]. Working on a plan of the vehicular traffic system, individual library objects are mapped on the corresponding points of the road system. In this way we obtain a traffic system model structured as a complex queue network. Data related to individual implementations of library objects that appear in the traffic system model obtained by the procedure indicated above are contained in a text file called ”model.dat”. This file is composed of a first section related to the general data for building the model and several following sections in which each individual component of the system is described. The file is generated by an editor implemented in a spreadsheet called Crea-Modeldat.xls, to simplify and automate the updating of data [2].
5.1. Model.dat – Current status of the model
The model.dat file reported below was generated through the modeling procedure applied to the current configuration of the Siena Nord vehicular traffic system. We considered a whole time slot. Here, we show a model.dat file of a system relative to the time slot that goes from 7:30 to 9:20 as an example.
The first section of the model.dat file is Section 1 which contains general data of the system. This data is presented in the following order: the number of crossroads, the number of roads, the number of crossroad multiplexers and road multiplexers in the traffic system model, the number of time intervals of 10 minutes taken into consideration in the simulation and the starting time of the simulation to identify the examined time slot.
T able 1. The traffic flo ws for the curren t system 7:30–9:20 12:00–13:50 07:30 07:40 07:50 08:00 08:10 08:20 08:30 08:40 08:50 09:00 09:10 09:20 12:00 12:10 12:20 12:30 12:40 12:50 street name in out in out in out in out in out in out in out in out in out in out in out in out in out in out in out in out in out in out SS Chian tigiana (Stellino) 87 103 127 97 172 106 196 116 125 76 150 113 131 98 145 98 146 96 156 117 125 72 122 105 152 113 149 117 136 113 118 114 117 140 100 110 Strada Fiume 46 102 28 103 36 100 55 131 45 128 53 107 43 90 58 95 38 85 49 88 41 88 65 80 78 83 68 60 59 62 70 77 106 72 56 53 Roundabout 1 SS Chian tigiana (Castellina) 48 130 69 157 77 170 77 159 76 173 83 191 67 182 75 180 60 199 58 197 65 200 56 187 72 157 75 180 84 175 72 136 70 180 93 185 Via Valle D’A osta 163 1 180 2 149 1 135 1 130 0 137 0 150 2 135 0 155 5 155 4 145 2 142 7 107 12 122 11 74 6 103 8 112 8 113 12 Mon tecelso 5 2 2 3 2 3 9 5 18 2 16 3 23 2 12 2 9 1 9 3 9 5 9 1 17 4 10 4 10 6 9 7 11 3 14 2 SS Chian tigiana (Stellino) 103 87 97 127 106 172 116 196 76 125 113 150 98 131 98 145 96 146 117 156 72 125 105 122 113 152 117 149 113 136 114 118 140 117 110 100 Via Fioren tina 35 40 56 80 86 115 65 100 95 92 71 74 88 61 115 72 145 90 117 77 101 100 67 72 50 35 73 90 115 85 95 89 110 75 122 94 Roundabout 2 Via Delle Pro vincie 48 44 65 56 97 64 103 81 71 80 84 76 44 67 91 102 80 80 105 95 95 70 96 80 75 68 80 76 82 79 72 78 80 79 93 96 Via Cassia Nord 45 25 120 38 115 80 155 80 120 78 130 73 120 65 130 90 115 63 85 59 57 80 70 55 62 50 68 60 72 74 70 65 65 96 65 104 12:00–13:50 17:30–19:20 13:00 13:10 13:20 13:30 13:40 13:50 17:30 17:40 17:50 18:00 18:10 18:20 18:30 18:40 18:50 19:00 19:10 19:20 street name in out in out in out in out in out in out in out in out in out in out in out in out in out in out in out in out in out in out SS Chian tigiana (Stellino) 120 115 128 128 136 141 120 143 127 143 113 89 141 130 172 155 162 162 167 167 176 153 130 147 162 142 158 167 175 182 157 143 127 158 137 112 Strada Fiume 84 56 88 48 80 68 89 68 71 47 72 63 102 79 125 85 152 95 100 73 130 75 110 72 100 56 93 66 92 75 87 85 90 87 83 75 Roundabout 1 SS Chian tigiana (Castellina) 75 148 65 192 57 181 82 165 58 153 56 165 84 165 90 225 92 260 75 180 100 264 77 235 85 220 88 217 80 255 85 205 75 190 70 155 Via Valle D’A osta 87 7 97 17 105 11 90 3 101 9 93 8 95 13 128 7 116 8 103 7 102 14 116 14 118 11 96 14 118 11 127 11 97 12 99 9 Mon tecelso 9 7 13 2 13 1 29 3 15 1 8 0 5 1 2 1 9 3 8 4 4 1 8 1 7 1 4 0 5 2 4 0 1 5 10 1 SS Chian tigiana (Stellino) 115 120 128 128 141 136 143 120 143 127 89 113 130 141 155 172 162 162 167 167 153 176 147 130 142 162 167 158 182 175 143 157 158 127 112 137 Via Fioren tina 120 97 86 75 125 76 105 71 125 77 100 50 100 53 185 50 240 55 246 107 233 137 195 90 200 117 186 100 163 60 140 65 125 112 92 46 Roundabout 2 Via Delle Pro vincie 84 105 110 118 87 81 93 107 83 90 94 95 98 72 95 60 88 74 75 52 92 82 108 75 75 56 95 61 65 40 75 44 67 52 102 62 Via Cassia Nord 85 83 75 100 55 120 62 120 58 105 48 85 96 76 90 95 89 80 93 82 75 80 90 81 95 73 94 120 78 90 75 120 85 100 75 105
Next, in Section 2 the roads in the model are listed with the following data:
• an integer that identifies the street in the model;
• a binary variable that specifies whether the route is directed towards the outside
(1) or the inside (0);
• the length of the road expressed in km;
• the number of incoming vehicles for each 12 10-minute interval of the model
time slot;
• the number of leaving vehicles for each 12 10-minute interval of the model time
slot;
• a binary flag that determines whether the route is connected to a multiplexer
or a road multiplexer;
• a string with the real road name in the traffic system.
Section 1:
No. Intersections Roads MP Flows MP Road No. Intervals Start Time; 3 18 11 7 0 12 7.30;
Section 2:
ID External Road length R NB IN R NB OUT Intersection MP or Road MP Name; 1 0 0.3 48 69 77 77 76 83 67 75 60 58 65 56 0 0 0 0 0 0 0 0 0 0 0 0 1 1 ''Via Chiantigiana Castellina'';
2 1 0.1 0 0 0 0 0 0 0 0 0 0 0 0 1 2 1 1 0 0 2 0 5 4 2 7 ''Via Aosta''; 3 0 0.3 163 180 149 135 130 137 150 135 155 155 145 142 0 0 0 0 0 0 0 0 0 0 0 0 1 2 ''Via Aosta''; 4 1 0.1 0 0 0 0 0 0 0 0 0 0 0 0 2 3 3 5 2 3 2 2 1 3 5 1 ''Via Montecelso''; 5 0 0.3 5 2 2 9 18 16 23 12 9 9 9 9 0 0 0 0 0 0 0 0 0 0 0 0 1 3 ''Via Montecelso''; 6 0 0.12 0 0 0 0 0 0 0 0 0 0 0 0 103 97 106 116 76 113 98 98 96 117 72 105 1 6 ''Via Chiantigiana Stellino'';
7 0 0.15 87 127 172 196 125 150 131 145 146 156 125 122 0 0 0 0 0 0 0 0 0 0 0 0 1 4 ''Via Chiantigiana Stellino'';
8 1 0.1 0 0 0 0 0 0 0 0 0 0 0 0 102 103 100 131 128 107 90 95 85 88 88 80 ''Via Fiume'';
9 0 0.3 46 28 36 55 45 53 43 58 38 49 41 65 0 0 0 0 0 0 0 0 0 0 0 0 1 5 ''Via Fiume'';
10 1 0.1 0 0 0 0 0 0 0 0 0 0 0 0 130 157 170 159 173 191 182 180 199 197 200 187 ''Via Chiantigiana Castellina'';
11 0 0.3 45 120 115 155 120 130 120 130 115 85 57 70 0 0 0 0 0 0 0 0 0 0 0 0 1 8 ''Via Cassia Nord'';
12 0 0.038 0 0 0 0 0 0 0 0 0 0 0 0 0 0 0 0 0 0 0 0 0 0 0 0 1 9 ''VIA12''; 13 1 0.1 0 0 0 0 0 0 0 0 0 0 0 0 44 56 64 81 80 76 67 102 80 95 70 80 ''Via delle Provincie'';
14 0 0.3 48 65 97 103 71 84 44 91 80 105 95 96 0 0 0 0 0 0 0 0 0 0 0 0 1 10 ''Via delle Provincie'';
15 1 0.1 0 0 0 0 0 0 0 0 0 0 0 0 40 80 115 100 92 74 61 72 90 77 100 72 ''Via Fiorentina''; 16 0 0.3 35 56 86 65 95 71 88 115 145 117 101 67 0 0 0 0 0 0 0 0 0 0 0 0 1 11 ''Via Fiorentina''; 17 0 0.04 0 0 0 0 0 0 0 0 0 0 0 0 0 0 0 0 0 0 0 0 0 0 0 0 1 7 ''VIA17''; 18 1 0.1 0 0 0 0 0 0 0 0 0 0 0 0 25 38 80 80 78 73 65 90 63 59 80 55 ''Via Cassia Nord'';
Section 3 in the model.dat file follows, where the data relating to the traffic flow sources of the road system is reported. In this model there are 7 vehicle flow sources that are characterized by the following data:
• an integer that identifies the source in the model;
• the succession of average vehicle routing times in the individual 10-minute
intervals of the time slot;
• the identifier of the road where vehicles are routed from the traffic source.
Section 3:
ID Flow Time Routing Time Routing Time Routing Time Routing Time Routing... ...ID Road; 1 12.5 8.7 7.79 7.79 7.89 7.23 8.96 8 10 10.34 9.23 10.71 1; 2 3.68 3.33 4.03 4.44 4.62 4.38 4 4.44 3.87 3.87 4.14 4.23 3; 3 120 300 300 66.67 33.33 37.5 26.09 50 66.67 66.67 66.67 66.67 5; 4 13.04 21.43 16.67 10.91 13.33 11.32 13.95 10.34 15.79 12.24 14.63 9.23 9; 5 13.33 5 5.22 3.87 5 4.62 5 4.62 5.22 7.06 10.53 8.57 11; 6 12.5 9.23 6.19 5.83 8.45 7.14 13.64 6.59 7.5 5.71 6.32 6.25 14; 7 17.14 10.71 6.98 9.23 6.32 8.45 6.82 5.22 4.14 5.13 5.94 8.96 16;
Section 4 contains the data of the crossroad multiplexers that are present in the model. These devices are responsible for routing vehicles next to the entry points of crossroads. For each Multiplexer the data is the following:
• an integer that identifies the multiplexer in the model;
• the number of the input sections connected to the multiplexer;
• the identification number of the crossroad on which vehicles enter;
• the probabilities for a vehicle to access the associated entry sections. These
probabilities may vary depending on the time intervals of 10 minutes in the time slot referred by the model.
Section 4:
&ID MULTIPLEXER IN SEC NO INT NO IN SEC ID PROB 1...PROB N; 1 1 1 1 1; 2 1 1 2 1; 3 1 1 3 1; 4 1 1 4 1; 5 1 1 5 1; 6 1 2 1 1; 7 1 2 3 1; 8 1 2 2 1; 9 1 3 1 1; 10 1 3 2 1; 11 2 3 3 0.46 0.36 0.4 0.4 0.53 0.43 0.41 0.54 0.46 0.46 0.49 0.48 4 0.54 0.64 0.6 0.6 0.47 0.57 0.59 0.46 0.54 0.54 0.51 0.52;
In the model.dat file the sections containing the data related to the modeling of the single crossings in the road system are listed below. These sections of data are listed in the model.dat file ordered by the identification number of the
crossroads in the model. In general “Section 𝑛.𝑚” means the 𝑚thdata section of
For each crossroad there is the general data section containing the following information:
• the identifier of the intersection in the model;
• the number of traffic light components of the crossroad;
• the number of crossroad internal sections;
• the number of crossroad entry sections;
• the number of crossroad exit sections;
• the number of paths that vehicles can follow to cross the intersection;
• the duration of a traffic light cycle;
• a Boolean variable that specifies whether the crossroad is a roundabout.
Section 1.1:
ID INT NO LIGHTS IN SEC INTER SEC OUT SEC PATH LIGHT ROUNDABOUT; 1 0 5 20 5 19 0 1;
The second section of the data of each crossroad contains data relating to internal sections:
• the identifier of the internal section in the crossroad model;
• the average crossing time of the section for a vehicle;
• the capacity of the section.
Section 1.2:
ID INTER SEC TIME SERVICE NO VEHICLES; 1 1 1; 2 3 5; 3 1 1; 4 2.4 4; 5 1 1; 6 2.4 4; 7 1 1; 8 2.4 4; 9 1 1; 10 1.8 3; 11 1 1; 12 2.4 4; 13 1 1; 14 2.4 4; 15 1 1; 16 1.8 3; 17 1 1; 18 2.4 4; 19 1 1; 20 2.4 4;
The third section of crossroad data contains information about input sections:
• the identifier of the input section in the crossroad model;
• the average section crossing time for a vehicle;
• the identifier of the crossroad to which the section belongs;
Section 1.3:
ID IN SEC NO PATH TIME SERV INTERSECTION NO VE; 1 4 1.2 1 2;
2 3 2.4 1 4; 3 4 1.8 1 3; 4 4 1.8 1 3; 5 4 1.2 1 2;
The fourth section of crossroad data contains the information about the output sections:
• the identifier of the output section in the crossroad model;
• the average crossing time of the section for a vehicle;
• the identifier of the internal section of the crossroad to which the output section
is connected;
• the identifier of the street outside the crossroad which is accessed by vehicles
through the exit section.
Section 1.4:
ID OUT SEC TIME SERV IN SEC LINK LINK ROAD OUT; 1 1 3 2;
2 1 7 4; 3 1 11 6; 4 1 15 8; 5 1 19 10;
The fifth section of crossroad data contains data relating to the crossing paths that vehicles can make at the intersection:
• the identifier of the crossing path in the crossroad model;
• the length of the path, which is the number of internal sections from which it
is composed;
• the ordered sequence of the internal section identifiers of the path with the
priority level for access of vehicles following the crossing path;
• the identifier of the entrance section from which the crossing path begins;
• the identifier of the exit section where the crossing path ends.
Section 1.5:
ID PATH PATH LENGTH S 1 P 1 S 2 P 2 S 3 P 3 S 4 P 4 S5 P 5 S 6 P 6 S 7 P 7 IN SEC OUT SEC;
1 3 1 5 2 10 3 10 1 1; 2 5 1 5 2 10 4 10 6 10 7 10 1 2; 3 7 1 5 2 10 4 10 6 10 8 10 10 10 11 10 1 3; 4 9 1 5 2 10 4 10 6 10 8 10 10 10 12 10 14 10 15 10 1 4; 5 5 5 5 6 10 8 10 10 10 11 10 2 3; 6 7 5 5 6 10 8 10 10 10 12 10 14 10 15 10 2 4; 7 9 5 5 6 10 8 10 10 10 12 10 14 10 16 10 18 10 19 10 2 5; 8 3 9 5 10 10 11 10 3 3; 9 5 9 5 10 10 12 10 14 10 15 10 3 4; 10 7 9 5 10 10 12 10 14 10 16 10 18 10 19 10 3 5; 11 9 9 5 10 10 12 10 14 10 16 10 18 10 20 10 2 10 3 10 3 1; 12 3 13 5 14 10 15 10 4 4; 13 5 13 5 14 10 16 10 18 10 19 10 4 5;
14 7 13 5 14 10 16 10 18 10 20 10 2 10 3 10 4 1; 15 9 13 5 14 10 16 10 18 10 20 10 2 10 4 10 6 10 7 10 4 2; 16 3 17 5 18 10 19 10 5 5; 17 5 17 5 18 10 20 10 2 10 3 10 5 1; 18 7 17 5 18 10 20 10 2 10 4 10 6 10 7 10 5 2; 19 9 17 5 18 10 20 10 2 10 4 10 6 10 8 10 10 10 11 10 5 3;
The sixth and last section of the crossroad data contains a list, for each entry section, of the intersection crossing paths with the relative sequence of vehicle routing probabilities or routing frequencies on the path according to the time intervals of 10 minutes into which the time slot for the model studied is divided.
Section 1.6: ID INPUT SEC;
ID PATH1 PROB 1 PROB 2 PROB 3 PROB 4 PROB 5 PROB 6 PROB 7 PROB 8 PROB 9 PROB 10 PROB 11 PROB 12
ID PATH2 PROB 1 PROB 2 PROB 3 PROB 4 PROB 5 PROB 6 PROB 7 PROB 8 PROB 9 PROB 10 PROB 11 PROB 12
ID PATH3 PROB 1 PROB 2 PROB 3 PROB 4 PROB 5 PROB 6 PROB 7 PROB 8 PROB 9 PROB 10 PROB 11 PROB 12
ID PATH4 PROB 1 PROB 2 PROB 3 PROB 4 PROB 5 PROB 6 PROB 7 PROB 8 PROB 9 PROB 10 PROB 11 PROB 12; ... 1; 1 0.4808 0.9756 0.4762 0.3953 0 0 1.0417 0 2.6738 1.8868 1.1976 3.6269; 2 0.9615 1.4634 1.4286 1.9763 0.9709 1.3453 1.0417 1.0256 0.5348 1.4151 2.994 0.5181; 3 49.5192 47.3171 50.4762 45.8498 36.8932 50.6726 51.0417 50.2564 51.3369 55.1887 43.1138 54.4041; 4 49.0385 50.2439 47.619 51.7787 62.1359 47.9821 46.875 48.7179 45.4545 41.5094 52.6946 41.4508; 2; 5 30.7463 27.1709 28.1915 28.5714 20.1592 27.4939 26.4865 26.2735 25.2632 29.1045 20 28.2258; 6 30.4478 28.8515 26.5957 32.266 33.9523 26.0341 24.3243 25.4692 22.3684 21.8905 24.4444 21.5054; 7 38.806 43.9776 45.2128 39.1626 45.8886 46.472 49.1892 48.2574 52.3684 49.005 55.5556 50.2688; 3; 8 30.6548 27.0195 28.1167 28.5012 20.1592 27.4939 26.3441 26.2735 24.9351 28.8177 19.8895 27.7045; 9 30.3571 28.6908 26.5252 32.1867 33.9523 26.0341 24.1935 25.4692 22.0779 21.6749 24.3094 21.1082; 10 38.6905 43.7326 45.0928 39.0663 45.8886 46.472 48.9247 48.2574 51.6883 48.5222 55.2486 49.3404; 11 0.2976 0.5571 0.2653 0.2457 0 0 0.5376 0 1.2987 0.9852 0.5525 1.847; 4; 12 43.4043 38.8679 36.4964 44.2568 42.2442 35.5482 32.6087 34.296 29.3103 30.137 29.8305 29.0909; 13 55.3191 59.2453 62.0438 53.7162 57.0957 63.4551 65.942 64.9819 68.6207 67.4658 67.7966 68; 14 0.4255 0.7547 0.365 0.3378 0 0 0.7246 0 1.7241 1.3699 0.678 2.5455; 15 0.8511 1.1321 1.0949 1.6892 0.6601 0.9967 0.7246 0.722 0.3448 1.0274 1.6949 0.3636; 5; 16 55.0847 60.6178 60.7143 56.5836 68.9243 62.215 64.0845 64.2857 66.113
61.3707 71.6846 62.3333; 17 0.4237 0.7722 0.3571 0.3559 0 0 0.7042 0 1.6611 1.2461 0.7168 2.3333; 18 0.8475 1.1583 1.0714 1.7794 0.7968 0.9772 0.7042 0.7143 0.3322 0.9346 1.7921 0.3333; 19 43.6441 37.4517 37.8571 41.2811 30.2789 36.8078 34.507 35 31.8937 36.4486 25.8065 35;
For Crossroad 2 the data sections contained in the model.dat file are the following:
Section 2.1:
ID INT NO LIGHTS IN SEC INTER SEC OUT SEC PATH LIGHT ROUNDABOUT; 2 0 3 3 2 4 0 0;
Section 2.2:
ID INTER SEC TIME SERVICE NO VEHICLES; 1 1 1;
2 0.9 1; 3 1.1 1; Section 2.3:
ID IN SEC NO PATH TIME SERV INTERSECTION NO VE; 1 2 1 1 1;
2 1 1 1 1; 3 1 1 1 1; Section 2.4:
ID OUT SEC TIME SERV INTER SEC LINK LINK ROAD OUT; 1 1 1 18;
2 1 2 12; Section 2.5:
ID PATH PATH LENGTH S 1 P 1 S 2 P 2 S 3 P 3 IN SEC OUT SEC; 1 3 1 5 2 10 3 10 1 2; 2 1 1 5 1 1; 3 1 3 10 2 2; 4 1 1 5 3 1; Section 2.6: ID INPUT SEC;
ID PATH1 PROB 1 PROB 2 PROB 3 PROB 4 PROB 5 PROB 6 PROB 7 PROB 8...PROB 12; ID PATH2 PROB 1 PROB 2 PROB 3 PROB 4 PROB 5 PROB 6 PROB 7 PROB 8...PROB 12; ... 1; 1 48.5437 49.4845 49.0566 49.1379 48.6842 48.6726 48.9796 48.9796 48.9583 48.7179 48.6111 48.5714; 2 51.4563 50.5155 50.9434 50.8621 51.3158 51.3274 51.0204 51.0204 51.0417 51.2821 51.3889 51.4286; 2; 3 100 100 100 100 100 100 100 100 100 100 100 100; 3; 4 100 100 100 100 100 100 100 100 100 100 100 100;
For Crossroad 3 the data sections contained in the model.dat file are the following:
Section 3.1:
ID INT NO LIGHTS IN SEC INTER SEC OUT SEC PATH LIGHT ROUNDABOUT; 3 0 4 16 4 9 0 1;
Section 3.2:
ID INTER SEC TIME SERVICE NO VEHICLES; 1 1 1; 2 1.2 2; 3 1 1; 4 2.4 4; 5 1 1; 6 1.8 3; 7 0.9 3; 8 0 1; 9 1.2 2; 10 0 1; 11 0 1; 12 4.2 6; 13 2.1 6; 14 0 1; 15 0 1; 16 2.4 4; Section 3.3:
ID IN SEC NO PATHS TIME SERV INTERSECTION; 1 3 1.2 1 2;
2 3 2.4 1 4; 3 2 3 1 5; 4 1 3 1 5; Section 3.4:
ID OUT SEC TIME SERV INTER SEC LINK LINK ROAD OUT; 1 1 3 13;
2 1 7 15; 3 1 14 17; 4 1 15 7; Section 3.5:
ID PATH PATH LENGTH S 1 P 1 S 2 P 2 S 3 P 3...S 7 P 7 IN SEC OUT SEC; 1 3 1 5 2 10 3 10 1 1; 2 5 1 5 2 10 4 10 7 10 8 10 1 2; 3 7 1 5 2 10 4 10 6 10 9 10 13 10 15 10 1 4; 4 3 5 5 7 10 8 10 2 2; 5 5 5 5 6 10 9 10 12 10 14 10 2 3; 6 5 5 5 6 10 9 10 13 10 15 10 2 4; 7 3 10 5 12 10 14 10 3 3; 8 5 10 5 12 10 16 10 2 10 3 10 3 1; 9 3 11 5 13 10 15 10 4 4;
Section 3.6: ID INPUT SEC;
ID PATH1 PROB 1 PROB 2 PROB 3 PROB 4 PROB 5 PROB 6 PROB 7 PROB 8...PROB 12; ID PATH2 PROB 1 PROB 2 PROB 3 PROB 4 PROB 5 PROB 6 PROB 7 PROB 8...PROB 12; ID PATH3 PROB 1 PROB 2 PROB 3 PROB 4 PROB 5 PROB 6 PROB 7 PROB 8...PROB 12; ... 1; 1 40.404 27.0588 23.6686 27.5701 31.4465 62.6263 33.5294 39.4444 31.7073 40 30.8511 39.0244; 2 36.3636 38.8235 43.1953 34.5794 36.478 61.6162 30.5882 27.7778 35.9756 32.4138 43.617 35.7724; 3 23.2323 34.1176 33.1361 37.8505 32.0755 65.6566 35.8824 32.7778 32.3171 27.5862 25.5319 25.2033; 2; 4 19.1083 7.5893 15.0888 13.7026 21.3768 14.8289 11.5207 23.0496 15.1079 14.3382 18.4783 13.7778; 5 25.4777 35.7143 34.0237 29.1545 33.3333 28.1369 28.1106 25.5319 32.3741 28.3088 36.2319 32; 6 55.414 56.6964 50.8876 57.1429 45.2899 57.0342 60.3687 51.4184 52.518 57.3529 45.2899 54.2222; 3; 7 40.5405 34.8837 31.9149 27.027 27.2727 28.3019 30.9278 22.7273 27.2727 24 30 27.2727; 8 59.4595 65.1163 68.0851 72.973 72.7273 71.6981 69.0722 77.2727 72.7273 76 70 72.7273; 4; 9 100 100 100 100 100 100 100 100 100 100 100 100;
6. Visualization and analysis of data
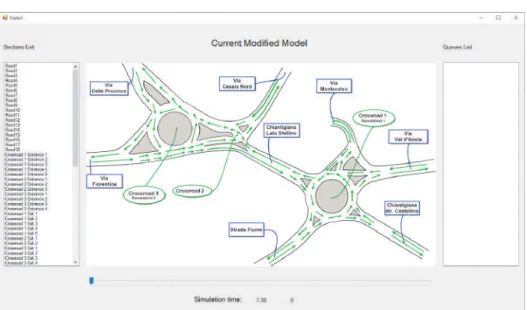
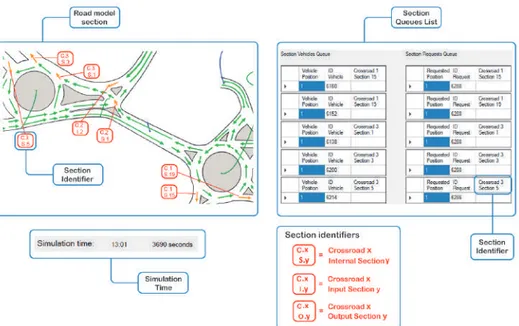
We have developed an application in Visual Basic that reads the data plotted during the simulation and creates a visual feedback. The simulation data traces the status of individual components of the detection system every thirty seconds during the entire simulation length. The application shows the data and the interface on a map of the vehicular traffic system as shown in Figure 21, the supply of descriptive tables is shown in Figure 22.
Form 1 of the application shows the map of the road system in which the
individual arrows related to the model components described in the model.dat file are displayed. A list box containing the list of input, output and internal sections of each model crossroad is situated on the left of the map, while the list box on the right has the purpose of highlighting to the user only the sections that contain at least one vehicle in the queue.
Clicking on one of these sections opens Form 2, as shown in Figure 23. This form shows the status of the vehicle queue in the selected section and the respective request queue to access it. Form 2 indicates the vehicle identification numbers and access requests.
The colors of the arrows specify the traffic intensity of the corresponding model component. The arrow is green, if there are no access section requests, orange, when the number of requests is about one vehicle in excess on the capacity of the section, and red, if the requests exceed the capacity of the section by at
Figure 21. Application Form 1
Figure 22. Application Form 2
least two units. Right below the model there is a scroll bar that allows choosing the time interval of thirty seconds to which the data displayed is referred. When the bar is moved, the results file will be read again and the data will change accordingly.
In the next paragraph, given the limited space available, we report only analyses carried out by us regarding the simulation of the traffic system model described by the model.dat file reported in this work. Hence, it is the Siena Nord system simulator in the time slot 07.30 AM to 09.20 AM. We analyzed the simulation data also for the two other time slots and we will report our observations in the conclusions of this work. The study is focused on the search for congestion events that can occur in the model components during the simulation
Figure 23. Example of Form 1 and Form 2 queue
and in comparison with the traffic system behavior when it was in its previous configuration.
Figure 24 and Figure 25 show the status of the system at 1:01 p.m. in the current and previous configurations, respectively.
Figure 24. System status and graphic notation
6.1. Visualization of results
The time slot 07:30 AM to 09:20 AM in the first minutes of the simulation is described by the queues on the route sections of Intersection 2 that connects via Chiantigiana, Stellino side, to Roundabout 2 and on some sections of the entry
Figure 25. System status in the previous configuration
Figure 26. First queues at 120 seconds
Figure 27. First queues at 240 seconds
and exit of Intersection 1, Figures 26 and 27 show some cases of queues on these sections.
The sections under interest are Section 3 and Section 2 of Crossroad 2, Sections 15, 11, 5 and 1 of Crossroad 1. The second form of each figure shows that the queues of interest to the sections just mentioned are formed by one vehicle only, therefore, we are not talking about real congestions. Over the next few minutes, the system will tend to become progressively populated.
Very soon this situation results in the first minimal congestion on Section 1 of Crossroad 2 specified by a red arrow of the corresponding flow, a section that belongs to the same path mentioned above:
The traffic starts to intensify also in the sections that allow access or exit from Crossroad 1, in particular Sections 5, 9, 13, 15 and 19, occasionally forming
Figure 28. First queue formed by more than two vehicles at 990 seconds
queues of two vehicles. It should be kept in mind that the yellow flows indicate queues formed by a single vehicle, while red flows indicate more consistent queues, formed by two or more vehicles:
Figure 29. Examples of population of crossroads at 1110 seconds
Figure 30. Examples of population of crossroads at 1620 seconds
An interesting scenario occurs at 8.45 am, where the entire route of Crossroad 2 that connects Via Chiantigiana, Stellino side, to Roundabout 2 is slowed down by queues in each of the sections that make it up, queues formed by a vehicle in the case of Sections 1 and 2, and queues of two vehicles in the case
Figure 31. Examples of population of crossroads at 1890 seconds
Figure 32. Examples of population of crossroads at 2040 seconds
Figure 34. Examples of population of crossroads at 3120 seconds
Figure 35. Congestion of a crossing path in Crossroad 2 at 4530 seconds
of Section 3, in Figure 37 we note a similar case which also includes Entry 1 of Crossroad 2:
Around 8:30 a.m., we can see how the vehicular flow starts to move towards Crossroad 3 (Roundabout 2) populating the system in its entirety. Let us look at some examples:
After 9 a.m. there are no other particular cases of congestion, in fact the number of requests rarely exceeds the capacity of the sections by two. The sections mainly involved are:
– Internal Sections 1, 2 and 3 of Crossroad 2; – Input Sections 1 and 3 of Crossroad 2;
– Internal Sections 1, 5, 11, 13, 15, 17, 19 of Crossroad 1; – Entrance 4 of Crossroad 1;
Figure 36. Queues on Crossroad 3 at 4620 seconds
Figure 37. Queues on Crossroad 3 at 4830 seconds
Most of these sections correspond to areas next to the entrance of each crossroad, that is, the most critical points of the system where vehicles wait to be routed with a higher probability of creating queues.
The system does not present excessive cases of congestion in this time slot, but in most of the intervals observed, Crossroad 2 appears to be, partly or completely, subject to traffic slowdowns and queues.
We selected figures related to the previous system configuration in the time slot 07:30–09:20 to verify if there were improvements or worsening:
In most cases the pattern of queues is the same for both systems, especially in sections concerning Roundabout 1, considering that its structure has remained
Figure 38. Queues on Crossroad 3 at 5610 seconds
unchanged. As for Intersection 2, queues appear mainly in the same intervals, ho-wever, given the modified general structure, in the current configuration the most crowded route is the one from via Chiantigiana, Stellino side, proceeding towards Roundabout 2, while in the previous configuration vehicles tend to slow down mainly along the route from Cassia Nord to Roundabout 2 and vice versa. This difference may be due to the conformation of the new Intersection 2, which merges vehicles coming from Chiantigiana Lato Stellino on the same crossing entrance, increasing the chances of creating queues, while in the previous configuration, the same vehicles were shared on two entrances at different crossroads.
A further element defined by us in the library to improve the detection of
vehicle queues in traffic flow simulations is theCODA_INT object [2, 4]:
OBJECT CODA INT(ID); INTEGER INT,ID; REF ROAD R; REF INPSEC INP; REF MP INT M INT; REAL P;
END;
This object is composed of pointers to other system variables and makes it more practical to measure queues of vehicles created during the simulation at some
specific points of the road system. TheCODA_INT object allows measuring queues
forming at the end of a street of the model at an entry point to a crossroad. Therefore, each path of the model that turns out to be an entrance to an
intersection has a specificCODA_INTobject associated with it. The internal variables
of this object are:
• INT is the identifier of the crossroads on which the route ends in the system
Figure 39. Comparisons corresponding to the unmodified model at 07:30–09:00
• ID is the identifier of the object;
• Ris the pointer to the street to which it is associated;
• M_INT is the pointer to the crossroad multiplexer to which it refers;
• INPis the pointer to the input section to which it refers;
• Pis the probability of vehicles being routed to the INP entry section.
During the simulation, this object calculates the total number of vehicles in the entry section of the crossroad and the number of requests for accessing
Figure 40. Comparisons corresponding to the unmodified model at 07:30–09:00
the multiplexer, posted by vehicles entering from the corresponding street, these values provide an estimation of the total length of the queue of vehicles entering the intersection from a specific direction. Such data detected during the simulation allows us to have a precise estimate of the queuing in the simulated system and allows us to perform an efficient comparison between the two configurations of the road system with regard to the management of vehicular flows. In particular, we will observe the behavior of the vehicular flows in the access section to Crossroad 2 for the current configuration, and the total requests to access sections at Crossroads 2 and 4 for the previous configuration. In the following figures we illustrate the two points for detecting vehicle queuing in relation to the two different road system configurations.
Figure 41. Multiplexers considered in the
previous system configuration Figure 42. Multiplexer considered in thecurrent system configuration
Looking at the data relating to this object during the current time slot (07:30–09:00) and comparing it with the data taken from the previous model in the same intervals, we obtain the Table 2.
Table 2 shows a direct comparison of the CODA_INT values in the intervals
studied with the application. Tables 3 summarize the highest values achieved during the simulation: the table on the left contains the maximum values reached by the current model and the value of the previous model at the same time, while the table on the right contains the maximum values reached by the previous model and the corresponding value derived from the current model.
In this time slot we can see how the sum of the values of theCODA_INTobject
of the multiplexers of Via 11 and Via 12 of the previous model reach a value of 2 vehicles for almost twice the intervals compared to the modified model.
7. Conclusions
This study analyzes the road system of the Siena Nord area in the current situation after a change that was made to the previous structure of the road system. The study covered the 120-minute time slots in the hours 07:30–09:20, 12:00–13:50 and 17:30–19:20. The purpose was to compare the traffic congestion levels in the current system compared to those that occurred in the system in its previous configuration.
It is clear from the simulations that both models have the same critical points in which intense traffic tends to saturate the sections, therefore, we do not have a real improvement in the modification made to the system. Regarding the point of the system where the new structural modification was made, we can state that in the first time slot that runs from 07.30 to 09.20 the vehicle flows have fewer queues compared to what happened in the previous configuration. Our study also shows that in the time period from 12:00 to 13:50 the current situation is slightly worse than the previous one, while in the time period from 17:30 to 19:20 the
Table 2. Values of CODA_INT 𝑥 for intervals analyzed in the application CODA_INT CODA_INT Time slot Interval Modified model Unmodified model 7:30–9:00 7:32 (120 seconds) 1 0 7:34 (240 seconds) 0 0 7:46 (990 seconds) 0 2 7:48 (1110 seconds) 0 1 7:57 (1620 seconds) 1 0 8:01 (1890 seconds) 1 1 8:04 (2040 seconds) 0 0 8:06 (2160 seconds) 0 1 8:23 (3210 seconds) 0 2 8:45 (4530 seconds) 0 0 8:47 (4620 seconds) 1 1 8:50 (4830 seconds) 1 1 Table 3. Maximum values reached in both systems
CODA_INT CODA_INT Interval Modified Unmodified
model model 1590 seconds 2 2 1800 seconds 2 0 2430 seconds 2 0 3360 seconds 2 1 3450 seconds 2 2 3540 seconds 2 0 3930 seconds 3 0 4410 seconds 2 0 4920 seconds 2 0 5280 seconds 2 1 CODA_INT CODA_INT Interval Unmodified Modified model model 900 seconds 3 0 990 seconds 2 0 1350 seconds 2 0 1430 seconds 2 0 1590 seconds 2 2 2010 seconds 2 1 2250 seconds 2 0 2370 seconds 3 1 2490 seconds 2 1 2730 seconds 2 0 3000 seconds 2 1 3210 seconds 2 0 3450 seconds 2 2 3780 seconds 2 0 4650 seconds 2 1 4680 seconds 2 0 4800 seconds 2 1 5250 seconds 2 0 5370 seconds 2 1
two configurations are practically equivalent with regard to the distribution of queuing. The new configuration of the system does not solve the critical problems of congestion of vehicular traffic that occur in the system and that we mentioned in our previous work [1].
Therefore, we can conclude that the simplification of the road system that has led to a reduction in the number of crossroads, roads and paths contained in the model has not solved the serious traffic congestion problems that occur in the system, but has slightly improved the flow of vehicles inside the system, in particular the flow passing from Roundabout 1 towards Roundabout 2 along via Chiantigiana, Stellino side.
References
[1] Pasini L 2018 TASK Quart. 22 (2) 135
[2] Pasini L and Sabatini S 2016 TASK Quart. 20 (1) 9 [3] Pasini L and Feliziani S 2013 TASK Quart. 17 (3) 155 [4] Simulog QNAP2 V9 Reference Manual
[5] Pasini L, Rietti F M and Allegretto F 2016 TASK Quart. 20 (3) 273 [6] Pasini L and Feliziani S 2010 TASK Quart. 14 (4) 405
[7] Pasini L, Feliziani S and Giorgi M 2005 TASK Quart. 9 (4) 397
[8] D’Ambrogio A, Iazeolla G, Pasini L and Pieroni A 2009 Simulation Modelling Practice and Theory 17 (4) 625