Germline
BAP1 mutations induce a Warburg effect
Angela Bononi1,5, Haining Yang1,5, Carlotta Giorgi2,5, Simone Patergnani2, Laura Pellegrini1, Mingming Su3, Guoxiang Xie3, Valentina Signorato1,2, Sandra Pastorino1, Paul Morris1, Greg Sakamoto1, Shafi Kuchay4, Giovanni Gaudino1, Harvey I Pass4, Andrea Napolitano1, Paolo Pinton*,2,6, Wei Jia*,3,6and Michele Carbone*,1,6
Carriers of heterozygous germlineBAP1 mutations (BAP1+/ −) develop cancer. We studied plasma from 16BAP1+/ − individuals from 2 families carrying different germlineBAP1 mutations and 30 BAP1 wild-type (BAP1WT) controls from these same families. Plasma samples were analyzed by liquid chromatography time-of-flight mass spectrometry (LC-TOF-MS), ultra-performance liquid chromatography triple quadrupole mass spectrometry (UPLC-TQ-MS), and gas chromatography time-of-flight mass spectrometry (GC-TOF-MS). We found a clear separation in the metabolic profile betweenBAP1WTandBAP1+/ − individuals. We confirmed the specificity of the datain vitro using 12 cell cultures of primary fibroblasts we derived from skin punch biopsies from 12/46 of these same individuals, 6 BAP1+/ − carriers and 6 controls from both families. BAP1+/ − fibroblasts displayed increased aerobic glycolysis and lactate secretion, and reduced mitochondrial respiration and ATP production compared with BAP1WT. siRNA-mediated downregulation of BAP1 in primaryBAP1WTfibroblasts and in primary human mesothelial cells, led to the same reduced mitochondrial respiration and increased aerobic glycolysis as we detected in primary fibroblasts from carriers of BAP1+/ − mutations. The plasma and cell culture results were highly reproducible and were specifically and only linked toBAP1 status and not to gender, age or family, or cell type, and required an intact BAP1 catalytic activity. Accordingly, we were able to build a metabolomic model capable of predictingBAP1 status with 100% accuracy using data from human plasma. Our data provide the first experimental evidence supporting the hypothesis that aerobic glycolysis, also known as the‘Warburg effect’, does not necessarily occur as an adaptive process that is consequence of carcinogenesis, but rather that it may also predate malignancy by many years and facilitate carcinogenesis.
Cell Death and Differentiation (2017) 24, 1694–1704; doi:10.1038/cdd.2017.95; published online 30 June 2017
We discovered that inherited heterozygous germline muta-tions in the BRCA-associated protein 1 (BAP1) gene cause a high rate of mesothelioma and uveal melanoma.1Our data, confirmed and expanded by others in several BAP1+/ − families across the world, revealed that germline BAP1 mutations in addition to mesothelioma and uveal melanoma, also cause other malignancies.2–5 We named this condition the‘BAP1 cancer syndrome’.2,6So far, all individuals affected by this novel cancer syndrome developed at least one and often multiple cancers during their lifetime.7Intriguingly, most BAP1+/ − patients experience significantly longer survival compared with patients who develop these same malignan-cies sporadically.7–9
BAP1 is a deubiquitylase that regulates multiple activities10–16 by forming multi-protein complexes.6 BAP1 stabilizes PGC-1α and promotes gluconeogenesis.17 Dey’s
team found that the glucose and hexose metabolic pathways were repressed in liver-specific Bap1 knockout mice.18These findings17,18 suggest that BAP1 may influence cellular metabolism. Very recently, we discovered a novel BAP1 cytoplasmic activity that, in concert with its nuclear activities, allows BAP1 to modulate gene–environment interaction and
contributes to the high incidence of cancer in BAP1+/ − carriers.19
Adult‘normal’ differentiated cells derive energy mostly via oxidative respiration (the tricarboxylic acid (TCA) cycle and oxidative phosphorylation). Alterations in the major cellular pathways involved in energy production– glycolysis and TCA cycle coupled with oxidative phosphorylation– are frequently found in cancer cells.20Warburg’s findings21that cancer cells
obtain approximately the same amount of energy from fermentation (glycolysis to lactic acid) as from the TCA cycle is considered a hallmark of malignancy.20,22–25This
phenom-enon referred as the‘Warburg effect’ protects tumor cells from hypoxia and provides a rich source of precursors for the biosynthesis of nucleic acid, fatty acids, and phospholipids that sustain tumor cell growth. Moreover, the lactic acid secreted in the extracellular space promotes tumor cell growth and protects tumor cells from immune cells.20,22–24As to the
emergence of the Warburg effect, the prevalent hypothesis is that the hypoxia that characterizes the initial growth of premalignant lesions provides micro-environmental selection forces that facilitate the growth of cell phenotypes that can adapt to this harsh environment through resistance to hypoxia
1
Thoracic Oncology Program, University of Hawaii Cancer Center, Honolulu, HI 96813, USA; 2Department of Morphology-Surgery-Experimental Medicine, University of Ferrara, Ferrara, Italy;3Metabolomics Unit, University of Hawaii Cancer Center, Honolulu, HI 96813, USA and4Cancer Center, New York University, New York, NY 10016, USA
*Corresponding author: P Pinton, W Jia or M Carbone, Thoracic Oncology Program, University of Hawaii Cancer Center, 701 Ilalo Street, Room 437, Honolulu, HI 96813, USA. Tel: +39 0532 455802 or 808 440 4596; E-mail: [email protected] or [email protected] or [email protected]
5
These authors contributed equally to this work. 6
These authors are co-senior authors.
and micro-environmental acidosis.26 Thus adaptation to
hypoxia via a Warburg effect and subsequent selection of those cell clones capable of surviving acidosis leads over time to malignant cell populations with a powerful growth advantage.22In addition to tumor cells, embryonic and adult stem cells may also produce energy via aerobic glycolysis.20 Similarly, within the tumor microenvironment, activated immune cells (macrophages, dendritic cells, and T cells) can also use aerobic glycolysis that helps them survive the hypoxic tumor environment.27,28
Here we show that cells from BAP1+/ −carriers do not need to go through a selection process that favors the emergence of clones with a Warburg effect required for tumor growth: normal primary BAP1+/− cells constitutionally derive a large part of their energy through aerobic glycolysis.
Results
Individuals carrying heterozygous germlineBAP1 muta-tions can be reliably identified based on their metabolic profile. We analyzed the metabolite profiles of plasma samples from 46 members of two unrelated families carrying different germline BAP1 mutations– the Wisconsin (W) and the Louisiana (L) families– that we have been following and treating for mesothelioma and other malignancies for 410 years.1 For details about individuals and samples, see Materials/Subjects and Methods section19 and
Supplem-entary Table S1.
Plasma and fibroblast19 extracts were analyzed by liquid
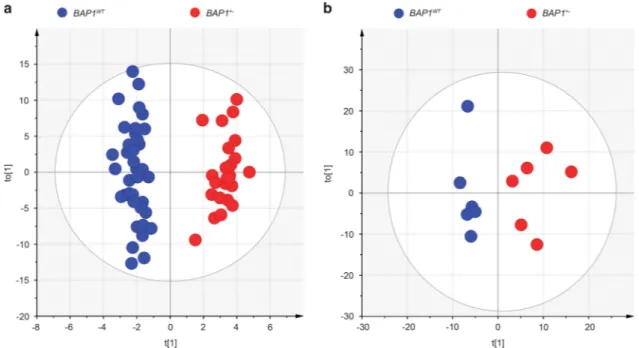
chromatography time-of-flight mass spectrometry (LC-TOF-MS), ultra-performance liquid chromatography triple quadru-pole mass spectrometry (UPLC-TQ-MS), and gas chromato-graphy time-of-flight mass spectrometry (GC-TOF-MS). A multivariate statistical analysis of the identified metabolites (Table 1), orthogonal partial least squares discriminant analysis (OPLS-DA), revealed a clear and statistically significant separation between BAP1WTand BAP1+/ − indivi-duals, both in plasma (OPLS-DA model: R2X= 0.208, R2Y (cum)= 0.951, Q2(cum) = 0.313) (Figure 1a) and in cell extracts (OPLS-DA model: R2X= 0.321, R2Y(cum) = 0.916, Q2(cum)= 0.215) (Figure 1b). The OPLS-DA model was not influenced by the year of collection of the samples (Figure 2a) and the age (Figure 2b) or gender (Figure 2c) of the individuals, suggesting that the differences observed in Figure 1a were specifically related to BAP1 status (Figure 2 and Supplementary Figure S1). To test whether the OPLS-DA model established with the metabolomics data of human subjects with known BAP1 status was able to
Table 1 Differentially expressed metabolites between BAP1WTand BAP1+/ −
Metabolomics profiling results Plasma Fibroblast cell cultures
No. of total metabolites 412 495
No. of known metabolites 246 226
No. of metabolites with VIP≥ 1 71 111
No. of metabolites with VIP≥ 1.5
28 21
We found 412 plasma and 495 cells’ chromatographic peaks corresponding to putative metabolites; of these, 246 plasma metabolites and 226 cell metabolites could be identified. Metabolites with VIP≥ 1 are listed in Supplementary Tables S2 and S3
Figure 1 OPLS-DA analysis of metabolite profiles showed a global metabolic difference between BAP1WTand BAP1+/ −individuals. (a) OPLS-DA score plot derived from, UPLC-TQ-MS and GC-TOF-MS spectral data of N= 61 plasma samples (37 BAP1WT(blue dots) and 24 BAP1+/ −(red dots)), K= 412 variables, including identified metabolites (246) and unknowns. (b) OPLS-DA score plot of UPLC-TQ-MS and GC-TOF-MS spectral data of whole-cell extract samples from BAP1WT(N= 6) and BAP1+/ −(N= 6)
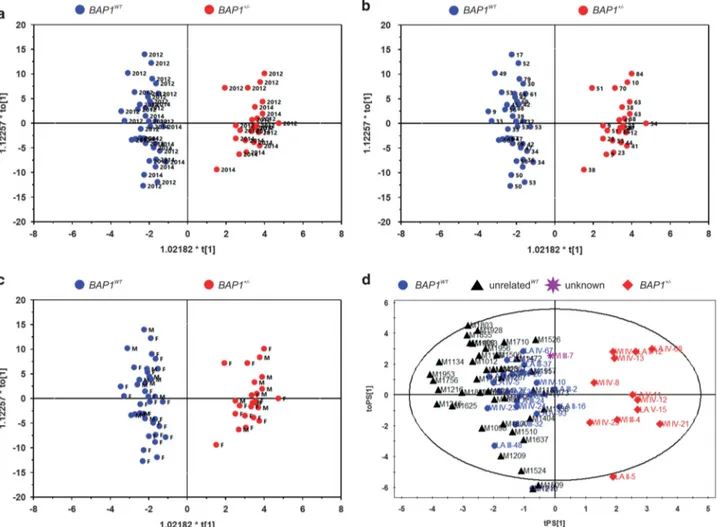
clearly discriminate among samples from individuals with or without heterozygous germline BAP1 mutations (Figure 2d), we analyzed blindly plasma samples from 76 individuals: 22 BAP1WT, 12 BAP1+/ −, 1 individual of the W
family with unknown BAP1 status at the time the analysis was performed, and 41 healthy controls not related to the W and L
families. The OPLS-DA model based on plasma metabolo-mics data was able to clearly discriminate the 41 healthy controls as BAP1WT(Figure 2d). The BAP1 unknown sample (WI III-7) was classified among the BAP1WT, a finding later
confirmed by genomic testing (Figure 2d and Supplementary Figure S1).
Figure 2 Genotype of BAP1WTand BAP1+/ −individuals can be predicted from plasma samples using an OPLS-DA analysis of their metabolite profile independently of year
of collection, age, gender, or family of origin. (a–c) OPLS-DA analysis of metabolite profiles is not influenced by (a) the year of collection (2012 and 2014, displayed in the panel), (b) the age of the individuals, and (c) gender (M= male, F = female). (d) OPLS-DA analysis differentiates BAP1+/ −carriers independently of family of origin. LC-TOF-MS and GC-TOF-MS were used for the metabolomic profiles of plasma samples from 22 BAP1WTsubjects (blue dots), 12 BAP1+/ −(red diamonds), 41 healthy controls unrelated to the
W and L families (black triangles), and 1 individual of the W family with unknown BAP1 status at the time the analysis was performed– later confirmed to be BAP1WT–
(purple star)
Figure 3 Altered metabolic pathways for the most relevant distinguishing metabolites between BAP1WTand BAP1+/ −cells. Glycolysis converts glucose into pyruvate. In the presence of oxygen, in the mitochondria, pyruvate is completely oxidized and the energy is stored as ATP (aerobic metabolism). In the absence of sufficient oxygen or in tumor cells because of the Warburg effect, the pyruvate is reduced to lactate (anaerobic metabolism). (a–h) Levels of glucose (a), glucose 6-P (b), glycerol (c), glycerol 3-P (d), pyruvate (e), citrate (f), fumarate (g), and malate (h) were measured in whole-cell extract samples from BAP1WTand BAP1+/ −fibroblast cell cultures. Bar plots show the mean± S.E.M. of
the average metabolite intensity. Our analysis (see also Supplementary Table S3) revealed decreased levels of glucose 6-P (VIP= 2.42), glycerol 3-P (VIP = 1.59), pyruvate (VIP= 1.16), and citrate (VIP = 1.71) in BAP1+/ −fibroblasts. A slight reduction in the levels of other TCA cycle intermediates– fumarate and malate – was also found. Glucose (VIP= 1.44) and glycerol (VIP = 1.09) levels were increased in BAP1+/ −fibroblasts compared with BAP1WT. *Po0.05. (i) Basal lactate secretion is increased in BAP1+/ − fibroblasts compared with BAP1WT. The amount of lactate released (dotted red arrow) in the cell culture media was determined using a colorimetric assay; data shown as
mean± S.E.M. of three independent experiments; *Po0.05. ACO, aconitase; ADP, Adenosine diphosphate; ALDO, aldolase; ATP, adenosine triphosphate; CS, citrate synthase; ENO, enolase; FH, fumarate hydratase; GPD, glycerol-3-phosphate dehydrogenase; GAPDH, glyceraldehyde-3-phosphate dehydrogenase; GPI, glucose-6-phosphate isomerase; IDH, isocitrate dehydrogenase; LDH, lactate dehydrogenase; MDH, malate dehydrogenase; PDK, pyruvate dehydrogenase kinase; PFK, phosphofructokinase; PGAM, phosphoglycerate mutase; PGK, phosphoglycerate kinase; PKM, pyruvate kinase; OGDH, oxoglutarate (alpha-ketoglutarate) dehydrogenase; SUCL, succinate-CoA ligase; SDH, succinate dehydrogenase; TPI, triosephosphate isomerase
Variable importance in the projection (VIP) values were calculated to evaluate the contribution of individual metabolite to the OPLS-DA model. Large VIP values41.0 are the most relevant for explaining differences between BAP1WT and
BAP1+/ −groups. A total of 71 metabolites identified in plasma samples had VIP41, among which 28 had VIP values 41.5 (Table 1 and Supplementary Table S2). A total of 111 metabolites identified in samples from cells in tissue culture had VIP41, among which 21 had VIP values 41.5 (Table 1 and Supplementary Table S3). To determine how many meta-bolites were increased/decreased in the BAP1+/ − samples, we calculated the fold change as the ratio BAP1+/ −/BAP1WT of the average metabolite amount (Supplementary Table S2 and Supplementary Table S3).
Germline BAP1 mutations have significant effects on energy metabolism. Several of the altered metabolites between BAP1+/ − and BAP1WTwere glycolytic or TCA cycle intermediates (Figures 3a–h). Among the cell metabolites with a VIP ≥ 1.5 (Supplementary Table S3 and Supple-mentary Figure S2), we found that glucose 6-phosphate (Figure 3b) was significantly decreased in BAP1+/ − samples (VIP= 2.42, P = 0.00972). Glycerol 3-phosphate (Figure 3d) and citrate (Figure 3f) were also decreased in BAP1+/ − samples, although the group difference was not significant by Student’s t-test (Supplementary Table S3). By extending the analysis to include the metabolites with VIP ≥ 1 (Supplementary Table S3), we found decreased levels of pyruvate (Figure 3e), while glucose (Figure 3a) and glycerol (Figure 3c) levels were increased in BAP1+/ − samples. A small reduction was detected in fumarate (Figure 3g) and malate (Figure 3h) levels in BAP1+/ − samples. Significantly increased lactate concentrations were detected in the conditioned cell culture medium of BAP1+/ − fibroblast cell
cultures (+32.75%± 11.24) compared with BAP1WT
(Figure 3i). Together, these findings suggested increased glycolysis and reduced aerobic mitochondrial respiration. However, the metabolomics data (Figure 3) might also fit the hypothesis of decreased hexokinase (HK) conversion (because the substrate metabolite, namely, glucose accumu-lates and the product metabolite, namely, glucose 6-phosphate decreases) and decreased glycerol kinase (GK) activity (because the substrate metabolite, namely, glycerol
accumulates and the product metabolite, namely, glycerol 3-P decreases).
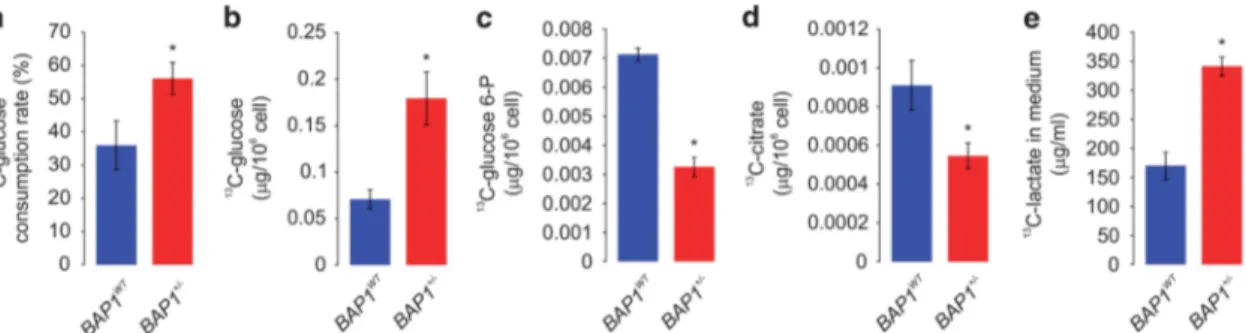
Metabolic rate analysis using 13C-glucose confirms increased glucose consumption and lactate secretion in BAP1+/ − cells. Stable isotope (13C) tracking of central
metabolic pathways provides a dynamic picture of metabo-lism and allows the experimental quantification of the integrated responses of metabolic networks.29We performed comparative profiling of the13C-labeled metabolic pattern in BAP1WTand BAP1+/ −fibroblasts. After growing fibroblasts in
13
C-labeled glucose, we performed a metabolic rate analysis based on UPLC-QTOFMS tracing pattern of the stable isotope in metabolites in a steady state (Figure 4). Analysis of 13C-glucose levels in conditioned medium revealed a
significantly increased consumption rate in BAP1+/ − fibro-blasts compared with BAP1WT(Figure 4a). Analyses of cells
extracts collected in parallel revealed increased levels of
13
C-glucose in BAP1+/ − fibroblasts compared with BAP1WT (Figure 4b). We also observed a reduction in intracellular
13
C-glucose 6-P (Figure 4c) and 13C-citrate (Figure 4d) in BAP1+/ − fibroblasts, supporting the data shown in Figure 3
and Supplementary Table S3. Moreover, increased
13C-lactate concentrations were detected in the conditioned
cell culture medium of BAP1+/ − fibroblasts compared with BAP1WT(Figure 4e). Thus, at the steady state, BAP1+/ −cells
consumed more glucose (higher 13C-glucose consumption rate) and released more 13C-labeled lactate in the culture medium. At the same time, lower amounts of intracellular intermediates13C-glucose 6-P and13C-citrate were detected in BAP1+/ − cells. Mass distribution vectors30of13C-labeled glucose 6-P, citrate and lactate (Supplementary Table S4) showed that: glucose 6-P was only observed in form M+6; citrate was observed in seven forms: unlabeled and M+1, M +2, M+3, M+4, M+5, and M+6; lactate was observed in four forms: unlabeled, M+1, M+2, and M+3. Fractional contribu-tions of13C-labeled glucose 6-P and citrate were lower, while fractional contribution of lactate was higher in BAP1+/ − cells, confirming a faster glycolytic rate compared with BAP1WT cells. These data indicate that BAP1+/ − cells have an increased glycolytic rate compared with BAP1WT cells. BAP1+/ − cells take up more glucose because they rapidly metabolize it to lactate, which is then released extracellularly. A faster metabolic rate from glucose to extracellular lactate
Figure 4 Levels of13C-metabolites in culture medium and cells after culturing BAP1WTand BAP1+/ −cells with13C-glucose for 24 h. BAP1WTand BAP1+/ −fibroblasts were
incubated in13C-glucose medium. (a)13C-glucose consumption rate measured in tissue culture medium from BAP1WTand BAP1+/ −cells. (b–d)13C incorporation into13 C-glucose (b),13C-glucose 6-P (c), and13C-citrate (d) measured in cell extracts from BAP1WTand BAP1+/ −cells. (e) Extracellular concentration of13C-lactate produced by BAP1WTand BAP1+/ −fibroblasts after 24 h of cell culture using13C-glucose medium. Bar plots show the mean± S.E.M.; *Po0.05
would quickly exhaust the glycolysis intermediates, explain-ing why BAP1+/ − cells have lower levels of13C-glucose 6-P in spite of the increased glucose consumption rate. Thus the changes observed did not appear related to decreased HK or GK activity, an interpretation further supported by the experiments described below.
BAP1+/ − cells rely largely on the glycolytic metabolism
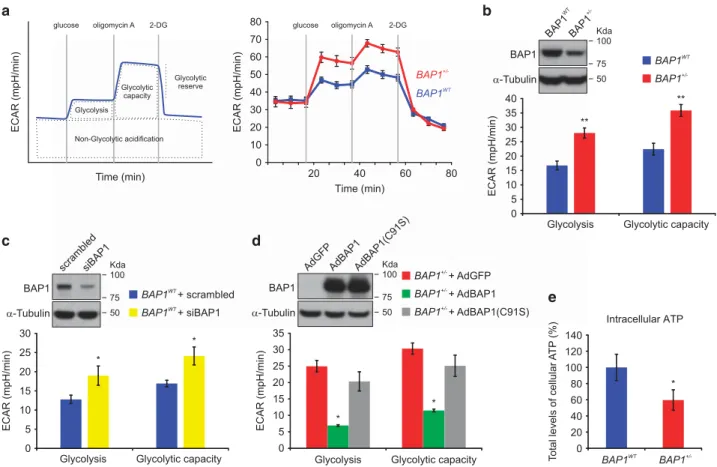
for energy production. To further characterize the glycolytic pathway in BAP1+/ − cells, we measured the extracellular acidification rate (ECAR) in BAP1WTand BAP1+/ − fibroblast cell cultures using the Seahorse XF96 Analyzer. When a saturating concentration of glucose (5 mM) is added, its catabolism to lactate through the glycolytic pathway produces ATP, protons, and thus a rapid increase in ECAR. We measured this glucose-induced response and reported it as the rate of glycolysis in basal conditions (Figures 5a and b). ECAR measurements (Figure 5b) revealed a significantly
increased rate of glycolysis in BAP1+/ −fibroblast cell cultures
(28.05± 1.76 mpH/min) compared with BAP1WT
(16.73± 1.52 mpH/min). The subsequent addition of the ATP synthase inhibitor– oligomycin A – inhibits mitochondrial ATP production and thus shifts the energy production to glycolysis. The consequent further increase in ECAR is a measure of the maximum glycolytic capacity of the cell. We found a significantly increased maximum glycolytic capacity in BAP1+/ − cells (35.88± 2.05 mpH/min) compared with BAP1WT(22.44± 2.04 mpH/min) (Figure 5b).
Next, we silenced BAP1 in wild-type control fibroblasts using siRNAs (siBAP1) to test whether we were able to mimic the same increases in glycolysis and glycolytic capacity. ECAR measurements (Figure 5c) showed a significant increase in both parameters in BAP1-silenced cells (rate of glycolysis: BAP1WT12.76± 1.12 mpH/min, siBAP1 18.98 ±
2.51 mpH/min; glycolytic capacity: BAP1WT 16.93± 0.85 mpH/min, siBAP1 24.11± 2.35 mpH/min). Similar results
Figure 5 BAP1+/ −fibroblasts have increased glycolytic activity and decreased intracellular ATP. (a) ECAR was recorded over time in BAP1WTand BAP1+/ −fibroblasts with the Seahorse XF96 extracellular flux analyzer. ECAR can be further dissected into different modules as depicted in the upper left scheme. The initial administration of a saturating concentration of glucose activates the glycolytic pathway producing NADH, protons, H2O, and ATP. Protons induce a rapid increase in ECAR. The following inhibition of
mitochondrial ATP synthesis with Oligomycin A shifts the energy production to glycolysis and induces an additional increase in ECAR. Finally, inhibition of glycolysis with 2-deoxyglucose (2-DG) causes a strong decrease in ECAR levels, confirming that the ECAR observed was generated by the glycolytic activity of the cells. Representative experiments performed in BAP1WTand BAP1+/ −fibroblasts are displayed on the right panel. (b) Levels of glycolysis and maximal glycolytic capacity in BAP1WTand BAP1+/ − fibroblasts. The western blotting (WB) shows the amounts of WT BAP1 in total cell lysates of BAP1WTand BAP1+/ −fibroblasts. (c and d) Rate of glycolysis and maximal
glycolytic capacity in (c) BAP1WTfibroblasts transfected with a pool of siRNAs targeting BAP1, and (d) BAP1+/ −fibroblasts transduced with adenoviruses for BAP1 (AdBAP1), its
catalytic inactive mutant BAP1(C91S) (AdBAP1(C91S)), or GFP as control (AdGFP). In panel (b), the WB shows BAP1 protein levels in BAP1WTfibroblasts silenced for BAP1.
Fibroblasts were transfected with control scrambled siRNA or siBAP1 (a pool of four different siRNAs targeting BAP1: siBAP1#1, siBAP1#2, siBAP1#3, and siBAP1#5). In panel (c), the WB shows BAP1 protein levels in BAP1+/ −fibroblasts transduced with AdBAP1, catalytically inactive AdBAP1(C91S), or control (AdGFP). (e) Total levels of intracellular ATP are reduced in BAP1+/ −fibroblasts compared with BAP1WT. Bar plots show the mean± S.E.M. of three independent experiments; **Po0.01, *Po0.05
were obtained in primary human mesothelial (HM) cells, which we established in tissue culture from patients with benign pleural effusions treated with siBAP1 to reduce BAP1 expression levels (Supplementary Figures S3a and b).
We also transduced BAP1 in BAP1+/ − fibroblasts with adenoviruses for wild-type BAP1 (AdBAP1) or its catalytic inactive mutant carrying the C91S point mutation (AdC91S)31
or a control adenovirus (AdGFP). Figure 5d shows that BAP1+/ − fibroblasts transduced with AdBAP1 had reduced glycolysis and glycolytic capacity; in contrast, AdC91S was ineffective at reducing glycolysis (rate of glycolysis in BAP1+/ − transduced with: AdGFP 24.94± 1.77 mpH/min, AdBAP1 6.92± 0.24 mpH/min, AdBAP1(C91S) 20.33 ± 2.92 mpH/min; glycolytic capacity: AdGFP 30.33± 1.71 mpH/min, AdBAP1 11.50± 0.43 mpH/min, AdC91S 25.08± 3.25 mpH/min). These data further indicate that BAP1 regulates glycolysis and that BAP1+/ − cells rely largely on the aerobic glycolytic metabolism for energy production. Despite the enhanced glycolysis, we detected lower intracellular levels of total ATP in BAP1+/ − compared with BAP1WTcells (Figure 5e). Conver-sion of glucose to lactate yields two ATP molecules; the
subsequent TCA cycle generates ∼ 36 molecules of
ATP.32 The reduced intracellular levels of ATP in BAP1+/ − cells suggested that mitochondrial respiration was impaired, and therefore BAP1+/ − cells were preferentially using
glycolysis – rather than the TCA cycle – to produce ATP (Warburg effect).21
BAP1 mutations impair mitochondrial respiration. As citrate, a key TCA cycle intermediate, was decreased in carriers of germline BAP1 mutations (Figures 3f and 4d), we sought to determine whether the boost in the glycolytic pathway of energy production observed in BAP1+/ −cells was associated with changes in mitochondrial respiration. First, we studied whether BAP1+/ − cells exhibited normal mito-chondrial morphology and mitomito-chondrial membrane potential (ΔΨ). Mitochondria were labeled in living cells by expressing green fluorescent protein specifically targeted to the
mito-chondria (mtGFP). mtGFP imaging (Supplementary
Figure S4a) showed the normal three-dimensional intercon-nected tubular network characteristic of these organelles and no differences in mitochondrial number (Supplementary Figure S4b) or volume (Supplementary Figures S4c and d) between BAP1WT and BAP1+/ − fibroblasts. Also no
differ-ences were detected in the loading of the fluorescent dye tetramethyl rhodamine methyl ester (TMRM) (Supplementary Figure S4e), thus ruling outΔΨ differences between BAP1WT and BAP1+/ − fibroblasts.
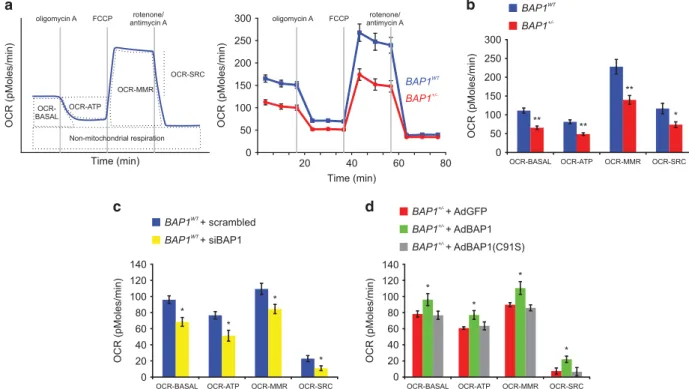
Next, using the Seahorse XF96 Analyzer, we studied the oxygen consumption rate (OCR) in BAP1WT and BAP1+/ − Figure 6 Mitochondrial respiratory function is impaired in BAP1+/ −cells. (a) OCR was analyzed in real time using the Seahorse XF96 extracellular flux analyzer. When Oligomycin A is added, the ATP synthase complex is inhibited, therefore the respiratory chain-associated oxygen consumption is inhibited. Addition of the ATP synthesis uncoupler FCCP induces the maximal oxygen consumption by the respiratory chain. Addition of rotenone and antimycinA (Rot/AntA, complex I and III inhibitors, respectively) blocks the electron transfer as well as oxygen consumption by the respiratory chain. Displayed on the left is a representative experiment showing the different parameters that can be measured and used to determine mitochondrial respiratory function: basal respiration (OCR-BASAL), ATP production (OCR-ATP), maximal respiration (OCR-MMR), and spare respiratory capacity (OCR-SRC). Representative experiments performed in BAP1WTand BAP1+/ −fibroblasts are shown on the right. (b) Reduced BASAL, OCR-ATP, OCR-MMR, and OCR-SRC in BAP1+/ −fibroblasts compared with BAP1WT, indicating an overall impaired mitochondria-linked aerobic respiration and ATP production in germline mutated BAP1+/ −cells. (c and d) Levels of OCR-BASAL, OCR-ATP, OCR-MMR, and OCR-SRC in (c) BAP1WTfibroblasts transfected with a pool of siRNAs targeting
BAP1 and (d) BAP1+/ −fibroblasts transduced with adenoviruses (Ad) for BAP1 (AdBAP1), its catalytic inactive mutant AdBAP1(C91S), or GFP as control (AdGFP). Bar plots show the mean± S.E.M. of three independent experiments. **Po0.01, *Po0.05
fibroblast cell cultures. The OCR is indicative of (and proportional to) mitochondrial respiration and can be employed as an indicator of mitochondrial respiratory capacity and energy production to reveal defects in mitochondrial bioenergetics mechanisms. The consecutive addition of specific mitochondrial inhibitors to the cells– Oligomycin A, FCCP, and rotenone/antimycin A– allows the measurements of distinct modules of oxygen consumption related to different mitochondrial processes (Figure 6a, left panel). Figure 6a (right panel) shows the OCR measurements over time in BAP1WT and BAP1+/ − fibroblast cell cultures. BAP1+/ − fibroblasts exhibited significantly lower basal mitochondrial respiration (OCR-BASAL) (65.78± 4.38 pMoles/min) com-pared with BAP1WT (111.20± 6.92 pMoles/min), supporting lower ATP turnover and demand (Figure 6b). The addition of Oligomycin A inhibits ATP synthase (complex V of the respiratory chain) causing a decrease in OCR that correlates with the amount of oxygen consumption linked to mitochon-drial ATP production (OCR-ATP). ATP-linked respiration was significantly decreased in BAP1+/ − fibroblasts (48.86± 3.38 pMoles/min) compared with BAP1WT (81.48± 5.24 pMoles/min) (Figure 6b). The maximal ATP output of mitochondria can be determined by addition of FCCP, an uncoupling agent that collapses the proton gradient and disrupts the mitochondrial membrane potential, inducing maximal oxygen consumption and substrate oxidation by complex IV (OCR-MMR, maximal mitochondrial respiration). OCR-MMR was significantly lower in BAP1+/ − fibroblasts (139.73± 11.61 pMoles/min) compared with BAP1WT (227.97± 19.17 pMoles/min) (Figure 6b). The spare respira-tory capacity (OCR-SRC) was determined by subtracting OCR-BASAL from FCCP-induced OCR-MMR. OCR-SRC measures the ability of the cells to respond to increased energy demand and was also significantly decreased in BAP1+/ − fibroblasts (73.94± 7.51 pMoles/min) compared with BAP1WT (116.77± 14.00 pMoles/min) (Figure 6b). To summarize, in BAP1+/ − fibroblast cell cultures we observed an overall reduction in all the OCR parameters that quantify mitochondrial respiration.
To support these findings, we measured OCR parameters in BAP1WTfibroblasts silenced for BAP1 (siBAP1). Similar to the BAP1+/ −cells (Figure 6b), we found that in siBAP1 cells all of the four critical parameters of mitochondrial respiration were significantly decreased: OCR-BASAL (BAP1WT 95.89±
4.90 pMoles/min, siBAP1 68.44± 5.48 pMoles/min), OCR-ATP (BAP1WT 76.63± 4.55 pMoles/min, siBAP1 51.27 ±
6.75 pMoles/min), OCR-MMR (BAP1WT 109.27± 6.91
pMoles/min, siBAP1 84.36± 5.73 pMoles/min), and OCR-SCR (BAP1WT22.87± 3.78 pMoles/min, siBAP1 10.91 ± 2.91 pMoles/min) (Figure 6c). Similar results were obtained in primary HM cells in which BAP1 was silenced (Supplementary Figures S3a and c).
Next, we tested whether the rescue of BAP1 protein levels would be sufficient to revert the impairment in mitochondrial respiration. BAP1+/ −fibroblasts were transduced with AdGFP (control), AdBAP1, or AdBAP1(C91S). We found that the reintroduction of AdBAP1, but not of AdGFP or the catalytic inactive AdBAP1(C91S), was able to rescue mitochondrial respiration in BAP1+/ −cells, as determined by measurements of OCR-BASAL (AdGFP 78.29± 3.82 pMoles/min, AdBAP1
96.10± 7.42 pMoles/min, AdBAP1(C91S) 76.61± 5.14 pMoles/min), OCR-ATP (AdGFP 60.81± 1.56 pMoles/min, AdBAP1 77.07± 5.40 pMoles/min, AdBAP1(C91S) 63.46 ± 4.96 pMoles/min), OCR-MRR (AdGFP 89.70± 2.57 pMoles/ min, AdBAP1 110.43± 7.95 pMoles/min, AdBAP1(C91S) 85.86± 3.72 pMoles/min), OCR-SCR (AdGFP 7.46 ± 3.81 pMoles/min, AdBAP1 22.02± 3.90 pMoles/min, and AdBAP1 (C91S) 6.53± 5.26 pMoles/min) (Figure 6d).
Gene expression analysis of genes coding for enzymes participating in glycolysis, glycerol metabolism, the pentose phosphate pathway, glycogen metabolism, and TCA cycle revealed no significant transcriptional differences between BAP1WTand BAP1+/ −fibroblasts (Supplementary Table S5). Together our findings indicate that the metabolomic changes detected are regulated posttranscriptionally and linked speci-fically to BAP1 deubiquitylase activity.
Discussion
We discovered that normal primary cells carrying hetero-zygous germline BAP1 mutations have increased aerobic glycolysis and impaired mitochondrial respiration. These metabolic changes in BAP1+/ − mutation carriers are so specific that, based on the metabolomics data from human plasma, we were able to predict BAP1 status with 100% accuracy. The notion that genotype can be predicted by plasma metabolic analyses may seem implausible; however, the same results were reproducible regardless of the year of collection and gender or age of the individuals. Indeed, medium of fibroblast cell cultures derived from 12 of these same individuals retained many of the same metabolomics differences, underscoring the specificity of our findings.
We identified significant differences in glycolysis and TCA cycle metabolites between BAP1+/ − and BAP1WTfibroblast cell cultures. BAP1+/ − cells consumed more glucose and released more lactate in the culture medium, indicative of a faster glycolytic rate compared with BAP1WT. These data
indicate that BAP1+/ − cells rely largely on the glycolytic metabolism for energy production. Indeed, in comparison with BAP1WT, ECAR measurements in BAP1+/ − cells revealed a significantly increased rate of glycolysis, while we observed an overall reduction in all the OCR parameters that quantify mitochondrial respiration. ECAR was reduced and OCR restored in BAP1+/ − cells transduced with WT BAP1 (AdBAP1) but not with a catalytic inactive BAP1 (AdBAP1 (C91S)). Moreover, similarly altered ECAR and OCR para-meters were observed in BAP1WT primary HM cells and fibroblasts silenced for BAP1, indicating that the effects observed are caused by the reduced BAP1 protein levels, independently of donor or cell type. Therefore, we anticipate that our results are also relevant to the numerous malignan-cies that carry somatic BAP1 mutations.33–44
The exact mechanism/s responsible for these metabolic changes is/are presently unknown. In a paper in press in Nature,19we report that BAP1 modulates ER-to-mitochondria calcium (Ca2+) release.19Intracellular Ca2+modulates three
rate-limiting enzymes of the TCA cycle.45Ongoing studies in our laboratory will determine whether the deregulation of intracellular Ca2+ signaling is also responsible for the distinctive metabolic signature of BAP1 mutation carriers.
The increased aerobic glycolysis– ‘Warburg effect’20,46–
displayed by BAP1+/ − cells is frequently observed in cancer cells. In carriers of germline BAP1 mutations, the presence of a Warburg effect in both the cells that undergo malignant transformation and in the surrounding stromal cells, creates an environment that promotes carcinogenesis and tumor growth.20,46 Indeed, in all cell cultures from individuals
carrying germline BAP1 mutations, we observed increased levels of extracellular lactate. Lactate is known to promote cancer growth,47 stimulate angiogenesis,48 and polarize
tumor-associated macrophages into a pro-tumor M2
phenotype.49Alterations in cytokine levels and macrophage polarizations with a pronounced M2 phenotype were observed in the peritoneal cavity of asbestos-exposed Bap1+/− mice and were linked to an increased incidence of MM.50These findings support a model in which alterations in cellular metabolism due to reduced BAP1 levels may also induce immune system alterations associated with a microenviron-ment that favors malignant transformation.
In summary, our data indicate that the Warburg effect, in addition to being a hallmark of cancer cells,25is also found in normal cells from individuals carrying heterozygous germline BAP1 mutations and may contribute to the high incidence of cancer observed among them.
Materials and Methods
Subjects. All participants (affected and unaffected family members) provided written informed consent according to the guidelines set forth by the Institutional Review Board of the University of Hawaii. Of the 14 individuals studied here from the W family, 7 were BAP1WTand 7 were BAP1+/ − (all healthy at the time of sample collection; however, 2/7 BAP1+/ −individuals had been previously diagnosed with (a) MM and (b) with MM and Breast cancer, both in remission for47 and 415 years, respectively). Of the 32 individuals from the L family, 23 were BAP1WTand 9 were BAP1+/ − (all healthy at the time of sample collection, except 1/9 BAP1+/ − individuals diagnosed with uveal melanoma and MM 9 years prior to sample collection, who had stable disease at the time of blood collection). A total of 61 plasma samples were collected over a period of 2 years, 37 from BAP1WTand 24 from BAP1+/ −individuals. We also studied 12 fibroblast cell cultures we established from skin punch biopsies from 6 BAP1+/ − carriers (3 from the W and 3 from the L family, all healthy at the time of sample collection, although 1 of them previously diagnosed with cancers 15 years prior, see above) and 6 BAP1WTcontrol individuals from the same families (3 from the W and 3 from the L family).19
Cell cultures. Human dermal skin fibroblasts were derived from explants of skin biopsies of BAP1WTand BAP1+/ −W and L families’ members.19For details, see Supplementary Experimental Procedures.
Plasma sample preparation and analysis by LC-TOF-MS. Metabolites were extracted from plasma samples and analyzed by LC-TOF-MS.
An Agilent HPLC 1200 system (Agilent Corporation, Santa Clara, CA, USA) was used with chromatographic separations performed on a 4.6 × 150 mm, 5μm Agilent ZORBAX Eclipse XDB-C18 chromatography column. Mass spectral data were acquired using an Agilent model 6220 MSD TOF mass spectrometer equipped with a dual sprayer electrospray ionization source (Agilent Corporation). Agilent API-TOF Reference Mass Solution Kit was used to obtain accurate mass time-of-flight data in both positive and negative mode operation. During metabolite profiling, both plot and centroid data were acquired for each sample from 50 to 1000 Da over a 25 min analysis time. Data generated by LC-TOF-MS were semiquantitative data and are expressed in peak intensity. For details, see Supplementary Experimental Procedures.
Plasma sample preparation and analysis by UPLC-TQ-MS. Plasma samples were prepared as previously described with modifications.51–53 The supernatant was used for targeted metabolic profiling of 140 lipids and amino acids with an Acquity ultra performance liquid chromatography coupled to a Xevo TQ-S
mass spectrometer (UPLC-TQ-MS, Waters Corp., Milford, MA, USA).53 Data
generated by UPLC-TQ-MS were quantitative data and are expressed inμM.
Plasma sample preparation and analysis by
GC-TOF-MS. Metabolites extracted from plasma samples were analyzed using an Agilent 7890N gas chromatograph coupled with a Pegasus HT TOF mass spectrometer (Leco Corporation, St. Joseph, MI, USA). Electron impact ionization (70 eV) at full scan mode (m/z 40–600) was used, with an acquisition rate of 20 spectra/s in the TOF-MS setting. Data generated by GC-TOF-MS were semiquantitative data and are expressed in peak intensity. For details, see Supplementary Experimental Procedures.
Cell extract preparation and analysis by UPLC-TQ-MS and GC-TOF-MS. BAP1WTand BAP1+/ − fibroblasts were grown as described above,
and 107cells were collected for the analysis.
Cell samples were prepared as previously described with modifications52,53as described in Supplementary Experimental Procedures. The supernatant was used for targeted metabolic profiling of 140 lipids with a UPLC-TQ-MS (Waters Corp., Milford, MA, USA)53and, for untargeted metabolic profiling, with an Agilent 7890A gas chromatograph coupled to a Leco Pegasus time of flight mass spectrometer (GC-TOF-MS, Leco Corporation).52
Data analysis. The acquired data files from LC-TOF-MS, UPLC-TQ-MS, and GC-TOF-MS were processed, combined, and analyzed using multivariate statistical tools to establish characteristic metabolic profiles associated with different genotypes. In total, 412 plasma and 495 cells’ chromatographic peaks corresponding to putative metabolites were found by deconvolution after exclusion of peaks originating from internal standards, contamination, and artifacts. Of these putative metabolites, 246 plasma metabolites and 226 cell metabolites were identified by their mass spectra and corresponding retention index (Table 1; see Supplementary Information).
13C-glucose metabolic pattern analysis
Cell culture, labeling, and sample collection: Fibroblasts were seeded at 5 × 10⁵cells/T25 flask, in DMEM, 1 × , 25 mM Glucose (Corning, Corning, NY, USA, Cat. No. 10-017-CV) supplemented with 10% Dialyzed FBS (Sigma, Cat. No. F0392). Labeling was started 24 h after seeding: cells were washed with phosphate-buffered saline (PBS) and culture medium was replaced with DMEM and no glucose (Gibco-Thermo Fisher Scientific, Waltham, MA, USA, Cat. No. 11966-025) supplemented with 10% Dialyzed FBS and 25 mM D-Glucose U-13C6 (Cambridge
Isotope Laboratories, Inc., Tewksbury, MA, USA, Cat. No. 110187-42-3). A sample of the labeling media was taken at time zero and stored as a reference for analysis.
13
C-labeled samples of medium and cells were collected following a 24-h labeling period. Cells were rinsed with PBS, detached with trypsin, and subjected to centrifugation at 200 × g for 5 min, at 4 °C. Cell pellets were washed three times with cold PBS, and the dry pellets were stored at− 80 °C for subsequent analysis. UPLC-QTOF-MS analysis: Cell culture medium samples were processed by adding 150μl of acetonitrile to 50 μl of samples, while cell pellets (3–6 × 10⁶cells) were extracted with 75% (v/v) methanol. After being vortexed for 10 min and centrifuged for 20 min at 16 100 × g, the supernatants (culture medium or cell extracts) were used for UPLC-QTOFMS analysis.
All analyses were performed on a Waters UPLC system (UPLC Acquity, Waters Corp., Manchester, UK) coupled with a quadrupole–time of flight mass spectrometer (Synapt G2, Waters Corp., Manchester, UK). Metabolites separation was achieved through a 2.1 × 100 mm 1.7μm Acquity amide and an Acquity HSS C18 column (100 × 2.1 mm i.d., 1.7μm; Waters Corp., Manchester, UK) equipped with ACQUITY UPLC VanGuard Pre-Column, separately, according to the published methods with modifications.54The column was maintained at 40 °C and a 5μl aliquot of sample
was injected. The flow rate remained constant at 0.4 ml/min. UPLC-MS raw data obtained were analyzed using TargetLynx applications manager version 4.1 (Waters Corp., Manchester, UK). Quantification was achieved for each metabolite using linear regression analysis of the peak area of metabolite versus concentration. Gene silencing with siRNA, adenovirus-mediated gene transfer and transfection. siRNA oligonucleotides targeting four different BAP1 mRNAs and one negative control siRNA were obtained from Qiagen (Germantown, MD, USA) (GeneSoluton siRNA: Hs_BAP1_1, Cat. No.: SI00066696; Hs_BAP1_2, Cat. No.: SI00066703; Hs_BAP1_3, Cat. No.: SI00066710; Hs_BAP1_5, Cat. No.: SI03036390; AllStars Negative control siRNA, Cat. No.: 1027280). Tranfection was
performed with HiPerfect (Qiagen), using a 10 nM final concentration of siRNA in 10 % FBS medium for 24 h.
The adenoviruses expressing BAP1 and GFP were purchased from SignaGen Laboratories (Rockville, MD, USA) (Ad-BAP1, Cat. No. SL175127; Ad-GFP, Cat. No. SL100708). A customized adenovirus expressing Ad-Myc-BAP1(C91S) was produced by SignaGen Laboratories using their Ad.MAX System.
XF96 instrument setup and analysis. BAP1WTand BAP1+/ −fibroblasts were seeded in XF96 Cell Culture Microplates. OCR and ECAR were measured simultaneously using the XF96 Analyzer (Seahorse Biosciences, North Billerica, MA, USA), and values were normalized to the number of cells per well using the crystal violet method. For details, see Supplementary Experimental Procedures.
Conflict of Interest
MC has a pending patent applications on BAP1. MC provides consultation for mesothelioma diagnosis at no cost to patients and colleagues and for a fee to lawyers. The authors have no other relevant affiliations or financial involvement with any organization or entity with a financial interest in or financial conflict with the subject matter or materials discussed in the manuscript apart from those disclosed.
Acknowledgements. This study was supported by NCI R01 CA198138 to MC; by the NCI-R01 CA160715 to HY; by the University of Hawai’i Foundation, which received donations to support mesothelioma research from Honeywell International Inc. to MC and by the United-For-A-Cure Riviera Foundation to MC and HY; and by the EDRN NCI grant 5U01CA111295-08 and donations from Belluck and Fox to HIP. SiP was supported by a research fellowship FISM, cod. 2014/B/3. PP and CG are supported by the Italian Association for Cancer Research, the Italian Ministry of Health, the University of Ferrara, Telethon (GGP11139B), the Ministry of Education University and Research (COFIN 20129JLHSY_002, FIRB RBAP11FXBC_002, and Futuro in Ricerca RBFR10EGVP_001). PP is grateful to C degli Scrovegni for support.
Author contributions
Conceptualization: MC, WJ, PP, HIP, HY; methodology: AB, CG, GS, PM, VS, SaP, LP, SK; validation: CG, SiP, PP; formal analysis: AB, WJ, AN, SiP, LP; investigation: AB, SiP, LP, MS, GX; writing: AB, AN, MC; resources: PM, GS, HIP, WJ; visualization: AB, WJ, AN, SiP, LP; supervision: MC, GG, WJ, PP, HY; project administration: MC, HY; funding acquisition: MC, WJ, PP, HY.
1. Testa JR, Cheung M, Pei J, Below JE, Tan Y, Sementino E et al. Germline BAP1 mutations predispose to malignant mesothelioma. Nat Genet 2011; 43: 1022–1025.
2. Carbone M, Ferris LK, Baumann F, Napolitano A, Lum CA, Flores EG et al. BAP1 cancer syndrome: malignant mesothelioma, uveal and cutaneous melanoma, and MBAITs. J Transl Med 2012; 10: 179.
3. Wiesner T, Obenauf AC, Murali R, Fried I, Griewank KG, Ulz P et al. Germline mutations in BAP1 predispose to melanocytic tumors. Nat Genet 2011; 43: 1018–1021.
4. Popova T, Hebert L, Jacquemin V, Gad S, Caux-Moncoutier V, Dubois-d'Enghien C et al. Germline BAP1 mutations predispose to renal cell carcinomas. Am J Hum Genet 2013; 92: 974–980.
5. Farley MN, Schmidt LS, Mester JL, Pena-Llopis S, Pavia-Jimenez A, Christie A et al. A novel germline mutation in BAP1 predisposes to familial clear-cell renal cell carcinoma. Mol Cancer Res 2013; 11: 1061–1071.
6. Carbone M, Yang H, Pass HI, Krausz T, Testa JR, Gaudino G. BAP1 and cancer. Nat Rev Cancer 2013; 13: 153–159.
7. Baumann F, Flores E, Napolitano A, Kanodia S, Taioli E, Pass H et al. Mesothelioma patients with germline BAP1 mutations have 7-fold improved long-term survival. Carcinogenesis 2015; 36: 76–81.
8. Carbone M, Flores EG, Emi M, Johnson TA, Tsunoda T, Behner D et al. Combined genetic and genealogic studies uncover a large BAP1 cancer syndrome kindred tracing back nine generations to a common ancestor from the 1700s. PLoS Genet 2015; 11: e1005633. 9. Klebe S, Driml J, Nasu M, Pastorino S, Zangiabadi A, Henderson D et al. BAP1
hereditary cancer predisposition syndrome: a case report and review of literature. Biomark Res 2015; 3: 14.
10. Scheuermann JC, de Ayala Alonso AG, Oktaba K, Ly-Hartig N, McGinty RK, Fraterman S et al. Histone H2A deubiquitinase activity of the Polycomb repressive complex PR-DUB. Nature 2010; 465: 243–247.
11. Yu H, Mashtalir N, Daou S, Hammond-Martel I, Ross J, Sui G et al. The ubiquitin carboxyl hydrolase BAP1 forms a ternary complex with YY1 and HCF-1 and is a critical regulator of gene expression. Mol Cell Biol 2010; 30: 5071–5085.
12. Lee HS, Lee SA, Hur SK, Seo JW, Kwon J. Stabilization and targeting of INO80 to replication forks by BAP1 during normal DNA synthesis. Nat Commun 2014; 5: 5128.
13. Yu H, Pak H, Hammond-Martel I, Ghram M, Rodrigue A, Daou S et al. Tumor suppressor and deubiquitinase BAP1 promotes DNA double-strand break repair. Proc Natl Acad Sci USA 2014; 111: 285–290.
14. Ismail IH, Davidson R, Gagne JP, Xu ZZ, Poirier GG, Hendzel MJ. Germline mutations in BAP1 impair its function in DNA double-strand break repair. Cancer Res 2014; 74: 4282–4294.
15. Zarrizi R, Menard JA, Belting M, Massoumi R. Deubiquitination of gamma-tubulin by BAP1 prevents chromosome instability in breast cancer cells. Cancer Res 2014; 74: 6499–6508. 16. Peng J, Ma J, Li W, Mo R, Zhang P, Gao K et al. Stabilization of MCRS1 by BAP1 prevents
chromosome instability in renal cell carcinoma. Cancer Lett 2015; 369: 167–174. 17. Ruan HB, Han X, Li MD, Singh JP, Qian K, Azarhoush S et al. O-GlcNAc transferase/host
cell factor C1 complex regulates gluconeogenesis by modulating PGC-1alpha stability. Cell Metab 2012; 16: 226–237.
18. Baughman JM, Rose CM, Kolumam G, Webster JD, Wilkerson EM, Merrill AE et al. NeuCode proteomics reveals Bap1 regulation of metabolism. Cell Rep 2016; 16: 583–595. 19. Bononi A, Giorgi C, Patergnani S, Larson D, Verbruggen K, Tanji M et al. BAP1 regulates IP3R3-mediated Ca2+ flux to mitochondria suppressing cell transformation. Nature (in press; doi:10.1038/nature22798).
20. Cairns RA, Harris IS, Mak TW. Regulation of cancer cell metabolism. Nat Rev Cancer 2011; 11: 85–95.
21. Warburg O. On the origin of cancer cells. Science 1956; 123: 309–314.
22. Gatenby RA, Gillies RJ. Why do cancers have high aerobic glycolysis? Nat Rev Cancer 2004; 4: 891–899.
23. Hsu PP, Sabatini DM. Cancer cell metabolism: Warburg and beyond. Cell 2008; 134: 703–707.
24. Koppenol WH, Bounds PL, Dang CV. Otto Warburg's contributions to current concepts of cancer metabolism. Nat Rev Cancer 2011; 11: 325–337.
25. Hanahan D, Weinberg RA. Hallmarks of cancer: the next generation. Cell 2011; 144: 646–674.
26. Suchorolski MT, Paulson TG, Sanchez CA, Hockenbery D, Reid BJ. Warburg and Crabtree effects in premalignant Barrett's esophagus cell lines with active mitochondria. PLoS ONE 2013; 8: e56884.
27. O'Neill LA, Hardie DG. Metabolism of inflammation limited by AMPK and pseudo-starvation. Nature 2013; 493: 346–355.
28. Biswas SK, Mantovani A. Orchestration of metabolism by macrophages. Cell Metab 2012; 15: 432–437.
29. Zamboni N, Fendt SM, Ruhl M, Sauer U. (13)C-based metabolic flux analysis. Nat Protoc 2009; 4: 878–892.
30. Buescher JM, Antoniewicz MR, Boros LG, Burgess SC, Brunengraber H, Clish CB et al. A roadmap for interpreting (13)C metabolite labeling patterns from cells. Curr Opin Biotechnol 2015; 34: 189–201.
31. Jensen DE, Proctor M, Marquis ST, Gardner HP, Ha SI, Chodosh LA et al. BAP1: a novel ubiquitin hydrolase which binds to the BRCA1 RING finger and enhances BRCA1-mediated cell growth suppression. Oncogene 1998; 16: 1097–1112.
32. Hinkle PC, Kumar MA, Resetar A, Harris DL. Mechanistic stoichiometry of mitochondrial oxidative phosphorylation. Biochemistry 1991; 30: 3576–3582.
33. Pena-Llopis S, Vega-Rubin-de-Celis S, Liao A, Leng N, Pavia-Jimenez A, Wang S et al. BAP1 loss defines a new class of renal cell carcinoma. Nat Genet 2012; 44: 751–759.
34. Harbour JW, Onken MD, Roberson ED, Duan S, Cao L, Worley LA et al. Frequent mutation of BAP1 in metastasizing uveal melanomas. Science 2010; 330: 1410–1413. 35. Mori T, Sumii M, Fujishima F, Ueno K, Emi M, Nagasaki M et al. Somatic alteration and
depleted nuclear expression of BAP1 in human esophageal squamous cell carcinoma. Cancer Sci 2015; 106: 1118–1129.
36. Jiao Y, Pawlik TM, Anders RA, Selaru FM, Streppel MM, Lucas DJ et al. Exome sequencing identifies frequent inactivating mutations in BAP1, ARID1A and PBRM1 in intrahepatic cholangiocarcinomas. Nat Genet 2013; 45: 1470–1473.
37. Nasu M, Emi M, Pastorino S, Tanji M, Powers A, Luk H et al. High incidence of somatic BAP1 alterations in sporadic malignant mesothelioma. J Thorac Oncol 2015; 10: 565–576.
38. Guo G, Chmielecki J, Goparaju C, Heguy A, Dolgalev I, Carbone M et al. Whole-exome sequencing reveals frequent genetic alterations in BAP1, NF2, CDKN2A, and CUL1 in malignant pleural mesothelioma. Cancer Res 2015; 75: 264–269.
39. Lo Iacono M, Monica V, Righi L, Grosso F, Libener R, Vatrano S et al. Targeted next-generation sequencing of cancer genes in advanced stage malignant pleural mesothelioma: a retrospective study. J Thorac Oncol 2015; 10: 492–499.
40. Bueno R, Stawiski EW, Goldstein LD, Durinck S, De Rienzo A, Modrusan Z et al. Comprehensive genomic analysis of malignant pleural mesothelioma identifies recurrent mutations, gene fusions and splicing alterations. Nat Genet 2016; 48: 407–416. 41. Joseph RW, Kapur P, Serie DJ, Parasramka M, Ho TH, Cheville JC et al. Clear cell
renal cell carcinoma subtypes identified by BAP1 and PBRM1 expression. J Urol 2016; 195: 180–187.
42. Chan-On W, Nairismagi ML, Ong CK, Lim WK, Dima S, Pairojkul C et al. Exome sequencing identifies distinct mutational patterns in liver fluke-related and non-infection-related bile duct cancers. Nat Genet 2013; 45: 1474–1478.
43. Wang Y, Thomas A, Lau C, Rajan A, Zhu Y, Killian JK et al. Mutations of epigenetic regulatory genes are common in thymic carcinomas. Sci Rep 2014; 4: 7336.
44. Yoshikawa Y, Emi M, Hashimoto-Tamaoki T, Ohmuraya M, Sato A, Tsujimura T et al. High-density array-CGH with targeted NGS unmask multiple noncontiguous minute deletions on chromosome 3p21 in mesothelioma. Proc Natl Acad Sci USA 2016; 113: 13432–13437.
45. Denton RM. Regulation of mitochondrial dehydrogenases by calcium ions. Biochim Biophys Acta 2009; 1787: 1309–1316.
46. DeBerardinis RJ, Chandel NS. Fundamentals of cancer metabolism. Sci Adv 2016; 2: e1600200.
47. Romero-Garcia S, Moreno-Altamirano MM, Prado-Garcia H, Sanchez-Garcia FJ. Lactate contribution to the tumor microenvironment: mechanisms, effects on immune cells and therapeutic relevance. Front Immunol 2016; 7: 52.
48. Vegran F, Boidot R, Michiels C, Sonveaux P, Feron O. Lactate influx through the endothelial cell monocarboxylate transporter MCT1 supports an NF-kappaB/IL-8 pathway that drives tumor angiogenesis. Cancer Res 2011; 71: 2550–2560.
49. Colegio OR, Chu NQ, Szabo AL, Chu T, Rhebergen AM, Jairam V et al. Functional polarization of tumour-associated macrophages by tumour-derived lactic acid. Nature 2014; 513: 559–563.
50. Napolitano A, Pellegrini L, Dey A, Larson D, Tanji M, Flores EG et al. Minimal asbestos exposure in germline BAP1 heterozygous mice is associated with deregulated inflammatory response and increased risk of mesothelioma. Oncogene 2016; 35: 1996–2002. 51. Bononi I, Perri P, Begnardi A, Martini A, Mazzoni E, Bosi S et al. Antibodies reacting with
Simian Virus 40 capsid protein mimotopes in serum samples from patients affected by uveal melanoma. J Hematol Oncol 2014; 7: 38.
52. Qiu Y, Cai G, Zhou B, Li D, Zhao A, Xie G et al. A distinct metabolic signature of human colorectal cancer with prognostic potential. Clin Cancer Res 2014; 20: 2136–2146.
53. Qiu Y, Zhou B, Su M, Baxter S, Zheng X, Zhao X et al. Mass spectrometry-based quantitative metabolomics revealed a distinct lipid profile in breast cancer patients. Int J Mol Sci 2013; 14: 8047–8061.
54. Paglia G, Hrafnsdottir S, Magnusdottir M, Fleming RM, Thorlacius S, Palsson BO et al. Monitoring metabolites consumption and secretion in cultured cells using ultra-performance liquid chromatography quadrupole-time of flight mass spectrometry (UPLC-Q-ToF-MS). Anal Bioanal Chem 2012; 402: 1183–1198.
This work is licensed under a Creative Commons Attribution 4.0 International License. The images or other third party material in this article are included in the article’s Creative Commons license, unless indicated otherwise in the credit line; if the material is not included under the Creative Commons license, users will need to obtain permission from the license holder to reproduce the material. To view a copy of this license, visit http:// creativecommons.org/licenses/by/4.0/
r The Author(s) 2017