Dottorato di Ricerca in Neuroscienze del
Comportamento XXXI Ciclo
Curricula di Neuropsicologia e Neuroscienze
Cognitive
Neuroanatomy of The Bipolar Brain:
From Brain Structure to Treatment
Candidate Daniela Vecchio Number 1050862
Coordinator Tutor
Prof. Stefano Ferraina Prof. Cecilia Guariglia
2
3
INDEX
Acknowledgement 5
About this work 7
Introduction 11
CHAPTER 1: Neuroimaging and mental disorders
1.1 History of Neuroimaging 14
1.2 Neuroimaging Modalities 18
1.2.1 Functional Magnetic Resonance Imaging 19
1.2.2 Structural Magnetic Resonance Imaging 21
1.2.3 sMRI: sequences and terminology 23
1.2.4 Diffusion Neuroimaging 24
1.3 Neuroimaging in Psychiatry 29
1.3.1 Neuroimaging in Bipolar Disorder 32
CHAPTER 2: (Study 1) Gray and white matter trajectories in patients with bipolar disorder
2.1 Introduction 38
2.2 Methods and Materials 40
2.3 Results 47
2.4 Discussion 54
2.5 Limitations 60
CHAPTER 3: (Study 2) Association between Duration of Lithium Exposure and Hippocampus/Amygdala
4
Volumes in Type I Bipolar Disorder
3.1 Introduction 63
3.2 Methods and Materials 66
3.3 Results 72
3.4 Discussion 77
3.5 Limitations 81
CHAPTER 4: (Study 3) Lithium treatment impacts nucleus accumbens shape in bipolar disorder
4.1 Introduction 83
4.2 Methods and Materials 85
4.3 Results 92 4.4 Discussion 99 4.5 Limitations 104 CHAPTER 5: Conclusions 106 References 108 APPENDIX I 125 APPENDIX II 127 APPENDIX III 129
5
Acknowledgement
The studies here presented were developed at the IRCCS Santa Lucia Foundation, Neuropsychiatry Laboratory. I would like to address my gratification to Dr. Gianfranco Spalletta that allowed me to do this experience and to Dr. Fabrizio Piras and Dr. Federica Piras for their constant support. They helped me to overcome the various obstacles encountered in these years, in a priceless way, offering me a very fertile soil to grow. I also thank Dr. Valentina Ciullo, Dr. Nerissa Banaj, Dr. Tommaso Gili and all members of Neuropsychiatry Laboratory as their kindly presence had surrounded my daily work activities, making it really special as learning and working moments. As a work team, all of them contributed to make my PhD course period really stimulant and enriching, both from the professional and personal points of view. My gratifications also come to Neuroimaging Laboratory at the IRCCS Santa Lucia Foundation, to all persons and researcher working there, as they endured my constant presence and supported me in all my working needs.
A special thank is for both patients and healthy controls that I tested during this period, for their collaboration and availability to spend with me so much hours of their time.
Finally, the most special thanks are for my loved ones. My partner Luca, because he has never been tired of supporting my efforts and for my parents and my family because I always felt
6
close to them, even despite the kilometers that separated us because of my work.
7
About this work
Since the beginning of my PhD course, my efforts have been aimed to constantly improve my knowledge about neuroimaging techniques and methodologies. I further deepened a promising, challenging and intriguing way to in vivo investigate neuroanatomical cerebral correlates of behavioural diseases, applying these techniques to neuropsychiatric research. Neuroimaging studies are widely diffused in neuroscientific research, with the aim to improve diagnostic and prognostic processes, but also to better characterise patients' pharmacological and clinical aspects. However, despite the efforts made so far, unanimous consensus on the neuropathological substrates on many of the more disabling psychiatric conditions is still missing.
In this thesis, I summarised results from researches done during my PhD course, organising them in a brief introduction and five chapters. Specifically, the first chapter of this work is dedicated to the progress made during the past years in neuroimaging technologies and techniques, with a focus on structural Magnetic Resonance Imaging techniques and their employment into the neuropsychiatric research.
The following three chapters are dedicated to the three studies, all developed though a specific research topic and directed to the understanding of the neural basis of Bipolar Disorder and its clinical implications.
8
The first cross-sectional case-control study I presented in chapter two was aimed at understanding whether white matter and grey matter changes are present from the beginning of the illness and whether they continue to be present over the course of the disease, in a sample of 78 patients (BD) and 78 controls (HC). With respect to HC, the study found that patients with BD showed a reduced brain volume in areas comprising the posterior cingulate cortex bilaterally, the right thalamus, the bilateral cerebellum and the left posterior limb of the internal capsule. The fact that these areas were permanently reduced over the entire age range investigated, suggests that brain alterations are present from the very early phase of the disorder, and that they are not the results of a neurodegenerative process.
The second and the third studies I presented in chapters three and four are characterized by a strong clinical relevance, since they assessed the effect of lithium treatment (the gold standard treatment for BD patients) on brain structure. Specifically, study 2 was aimed at investigating the effects of lithium-treatment duration on the volumes of limbic and subcortical structures by comparing the groups of patients, stratified according to lithium exposure, (15 patients with a lithium exposure of less than 24 months (short-exposure group [SE]), and 15 patients naïve to treatment with lithium (no- exposure group [NE]) and HC. No differences in limbic and subcortical gray matter volumes were found between LE and HC. Hippocampal and amygdalar volumes were larger bilaterally in both LE and HC when compared to NE.
9
Amygdalar volumes were larger bilaterally in SE when compared to NE but did not differ from LE. Hippocampal volumes were smaller bilaterally in SE when compared to LE and HC but did not differ from NE. The study supports the idea that the effect of lithium exposure on limbic and subcortical gray matter volumes appears to be time-dependent and relatively specific to the hippocampus and the amygdala, with short-term effects on the amygdala and long-term effects on both structures.
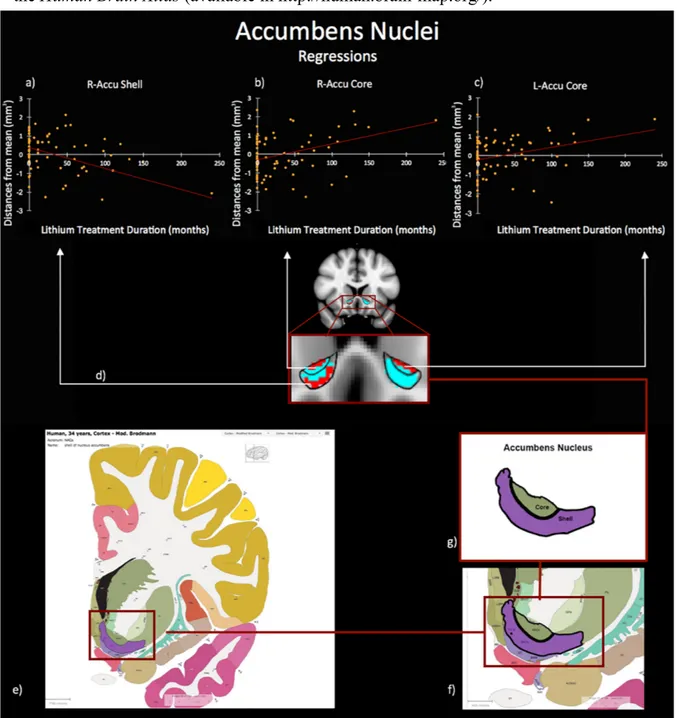
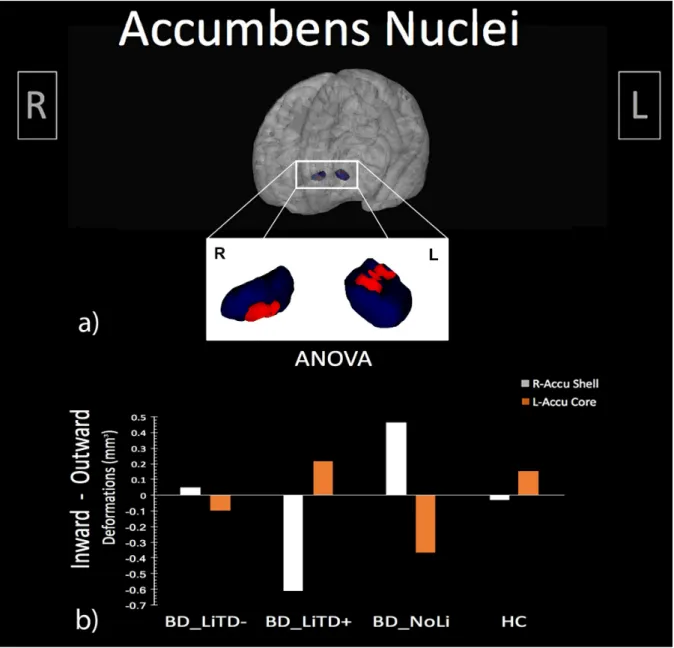
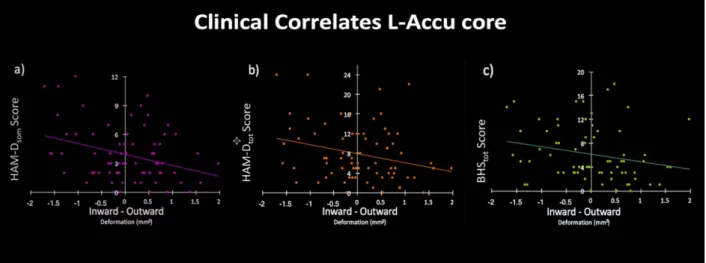
For the third study, I employed a recent structural neuroimaging approach (i.e. shape analysis) which allows the quantification of advanced morphometric features of deep grey matter structures. In this study, I tested the hypothesis that shape characteristics of deep grey matter structures in bipolar disorder are associated with the duration of lithium treatment, finally impacting clinical phenomenology. The sample was composed of BD naïve to lithium treatment (NoLi), BD with short-term lithium treatment (LiTD-), BD with long-term lithium treatment (LiTD+), and HC. Results revealed a significant bilateral extroflexction effect dependent to increased duration of lithium treatment on the core of BD accumbens surfaces, while a concomitant introflection effect was found on the shell of right accumbens. A further analysis between groups with different treatment duration, showed that NoLi e LiTD- groups had inward/outward deformations both on left core and on the right shell of the accumbens surfaces when compared to HC and LiTD+. Moreover, the deformation of L-Accu-Core
10
shape was significantly correlated with increased depression severity.
Finally, a conclusive chapter summarizes results and implications of the presented works.
11
Introduction
The desire to understand the human mind has been one of the main desires of philosophers throughout the ages. During the last century, questions about cognitive and emotional process as well as about their cerebral neuroanatomical correlates have lead physician, psychologists, computer scientists, physicist to converge in the current discipline that is cognitive neuroscience.
Non-invasive imaging of the human brain has proven invaluable in this context. Indeed, neuroimaging technologies have enabled the investigation of normal brain functions and are being used to gain important new insights into the mechanisms behind many neuropsychiatric disorders. This research has implications in identifying biomarkers of disease, prognosis, treatment effects, elucidate biological pathways, and help redefine diagnostic boundaries and inform and monitor new therapies.
Unlike many neurological diseases, psychiatric disorders do not cause changes that are visible to the naked eye in the neuroimaging study of the individual patient (Agarwal et al., 2010). They are, however, amenable to investigation by recent neuroimaging modalities, particularly quantitative structural imaging. This was the reason for the rapid growth of magnetic resonance imaging
12
(MRI) research of psychiatric disorders. It has reflected the aspirations of many psychiatrists and neuropsychologist to link the signs and symptoms of psychiatric disease to specific brain structural abnormalities.
Bipolar disorder (BD) is an especially good example of a group of psychiatric illnesses that are difficult to diagnose accurately. Specifically, BD is a mental health condition defined by periods (better known as episodes) of extreme affective disturbances, marked by alternating status of mood elation (mania/hypomania) and depression interspersed by euthymic (normal mood) periods. There are two main types of bipolar disorders: bipolar type I and bipolar type II. According to the DSM 5 (American Psychiatric Association. DSM-5 Task Force., 2013), BD type I involves episodes of severe mania and often depression, while BD type II involves a less severe form of mania called hypomania and depressive episodes are more frequent than in type I.
Although BD, along with other psychiatric illnesses, is one of the ten most debilitating of all non-communicable diseases (Department of Health Statistics and Informatics, 2008), misdiagnosis of the illness as recurrent unipolar depression occurs in 60% of patients seeking treatment for depression (Goodwin and Jamison, 2012; Hirschfeld et al., 2003). Structural neuroimaging data had provided evidence for the assumption that Bipolar disorder are not exclusively functional illnesses but also show a diversity of
13
morphological changes. They allow investigation on potential neurodevelopmental and neurodegenerative processes involved in the disease and in their specific time course. Indeed, the identification of objective neuroimaging biomarkers that represent pathophysiologic processes that differ between bipolar disorder and other psychiatric diseases can both inform bipolar disorder diagnosis and provide biological targets for the development of new and personalized treatments. This is mostly important at the presentation of first episodes of the disorder, when different diagnosis can show confounding symptomatology overlapping (Rosen et al., 2012).
As the size of the experimental cohorts grew, studies began to examine brain patterns associated with heterogeneous expression of clinical symptoms, the mechanisms of disease progression, and even differential patterns of treatment response.
14
CHAPTER 1
NEUROIMAGING
1.1 History of Neuroimaging
In the last twenty years, neuroimaging of the brain has advanced at a tremendous pace because of technological innovations, developments in computing and new statistics that have been developed to interrogate neuroimaging data.
The history of modern in vivo imaging began from the side of the structural tissue visualization, with radiographic techniques. However, since the brain is composed of soft tissue, that is not radio-opaque, it remained essentially invisible to plain X-ray investigations. The first attempt to visualize the brain traces back to 1918, when the work of the neurosurgeon Walter Dandy (Kilgore and Elster, 1995) on experimental hydrocephalus and cerebrospinal fluid
circulation led to the development of
pneumoencephalography (Sampath et al., 2000). Most of cerebrospinal fluid was temporarily replaced trough a lumbar puncture with a contrast agent such as air, oxygen or helium, to improve brain contrast when imaging it with X- rays. It was derived from ventriculography, an earlier method where the air was injected through holes drilled in
15
the skull of the patient. Pneumoencephalography become a common medical procedure mostly used to evaluate the size of brain ventricles until the late 1970s. In 1927, Egas Moniz, neurologist and winner of the Nobel Prize in Physiology or Medicine (1949) for the discovery of leucotomy (Fusar-Poli et al., 2008), introduced cerebral angiography, which allowed visualizing with great accuracy blood vessels in and around the brain (Ligon, 2003). Drawbacks of these early methods were that the signal-to- noise ratio was poor, and that, being invasive techniques, the risk and discomfort for the patients were significantly high.
Non-invasive structural brain imaging method was computerized tomography (CT), developed in the late 1970s, when minicomputers and transverse axial scanning method became available. Transverse axial scanning was largely due to the work of Godfrey Hounsfield and Allan McLeod Cormack (Raju, 1999), who won the 1979 Nobel Prize for Physiology or Medicine for their work (Montgomery, 1979). With the CT available, better quality anatomical images of the brain became accessible to both clinicians and researchers. About a decade later, in the early 1980s, a second non-invasive structural brain imaging method, Magnetic Resonance Imaging (MRI), was introduced clinically. It was developed thanks to the work of several researchers who buit its theoretical bases [for a detailed review, see (Geva, 2006)], including Peter
16
Mansfield and Paul Lauterbur. These researchers independently published in 1974 the technique that later became known as MRI (initially named Nuclear Magnetic Imaging – NMI), and were awarded the Nobel Prize for Physiology or Medicine in 2003 (Pincock, 2003). With regard to patient safety, MRI was superior to CT scan because CT scan is using ionizing radiation, while MRI uses harmless radio waves. Consequently, it has become the gold standard method to visualize non-invasively human brain structure, with a veritable explosion of technical refinements and diagnostic MR applications.
Specifically, a number of processes have been introduced and developed to produce MR images. These processes include nuclear alignment, orthogonal Radio Frequency (RF) excitation, spatial encoding, and image formation. In simple terms, an MRI system consists of five major components: a) a magnet (to produce the B0 magnetic
field for aligns protons), b) gradient systems (to spatially encode the positions of protons into the x/y/z axes), c) an RF coil system (to excite protons and perturb their alignment), d) a receiver (to register radio signals), and e) a computer system (to control the whole system and reconstruct the images). MRI development was based on knowledge that the human body is mostly made of water. Water molecules (H2O) contain hydrogen nuclei (protons),
which become aligned in a magnetic field. An MRI scanner applies a very strong magnetic field (about 0.2 to 7 teslas, or
17
roughly a thousand times the strength of a typical fridge magnet), which aligns the proton "spins." The scanner also produces a radio frequency current that creates a varying magnetic field. The protons absorb the energy from the magnetic field and flip their spins. When the field is turned off, the protons gradually return to their normal spin, a process called precession. The return process produces a radio signal that can be measured by receivers in the scanner and made into an image. Protons in different body tissues return to their normal spins at different rates, so the scanner can distinguish among various types of tissue. The scanner settings can be adjusted to produce contrasts between different body tissues. Additional magnetic fields are used to produce 3D images, that may be viewed from different angles (Rodriguez, 2004).
The enhancement of these non-invasive neuroimaging techniques (together to other subsequently developed imaging tools, like positron emission tomography - PET,
electroencephalography - EEG, and
magnetoencephalography - MEG), have enabled the in vivo visualization and analysis of the brain function and structure in unprecedented detailed manner. Moreover, they transformed the way we study the nervous system under normal and pathological conditions (Kikinis et al., 2014), particularly in neuropsychiatric disorders (Mayberg, 2014).
18
1.2 Neuroimaging Modalities and Technical Aspect
Traditionally, the brain imaging modality has been divided into structural (Symms et al., 2004) and functional neuroimaging (Raichle, 2009); even if, more novel neuroimaging modalities provide an admixture of the two and do not fit pristinely into this dichotomy (e.g. Diffusion Tensor Imaging - DTI) (Jones and Leemans, 2011).
Functional neuroimaging is the use of neuroimaging technology to measure an aspect of brain function, often with the aim to understanding the relationship between activity in certain brain areas and specific cognitive functions (Raichle, 2009). Common methods of functional neuroimaging include Positron Emission Tomography (PET), Functional Magnetic Resonance imaging (fMRI), Electroencephalography (EEG), Magnetoencephalography (MEG), Functional Near- Infrared Spectroscopy (fNIRS), Single-Photon Emission Computed Tomography (SPECT) (ibidem).
From the other side, structural neuroimaging provides a powerful tool to map the anatomy of the brain (Symms et
al., 2004). Presently, there are essentially two structural
neuroimaging modalities that are commonly used in clinical settings and in neuroscientific research, CT and structural MRI (sMRI). Both techniques yield images with excellent spatial resolution and contrast and are widely used to assess cerebral pathology in neuropsychiatric disorders. From the
19
perspective of practicing psychiatrists both techniques are important and they are now readily available and increasingly affordable.
I focus on human brain imaging with MRI recognizing that other techniques (e.g. PET, SPECT and CT), particularly electrical (e.g. EEG, MEG and ECoG), also have and will continue to have an important role in neuroscience.
1.2.1 Functional Magnetic Resonance Imaging
Functional MRI (fMRI) makes use of the same hardware as MRI but exploits the paramagnetic properties of cerebral blood flow (CBF) (Villringer and Dirnagl, 1995). The commonest method of fMRI relies on the variations in signal intensity that occur as a consequence of altered levels of cerebral blood oxygenation. This technique is called Blood Oxygen Level-Dependent (BOLD) contrast and is currently the mainstay of human neuroimaging, since its discover (Ogawa et al., 1990). It is based on the assumption that regional neural activity results in increased local CBF, producing an increase in oxyhaemoglobin and carrying red blood cells. This essentially leads to a net decrease in de-oxyhaemoglobin. The two molecules oxyhaemoglobin and de-oxyhaemoglobin have different magnetic properties (diamagnetic and paramagnetic
20
respectively) and the relative change in concentrations of the two results in a change in signal intensity (ibidem).
Typically, fMRI is used to identify brain regions that are activated by a specific task performed by an individual whilst in the scanner (Campanella et al., 2017; D’Esposito
et al., 1998). It is important to note, however, that it does
not detect actual neuronal transmission but instead relies on the presumed coupling of neural responses to local blood flow. It is therefore used to assess neuro-cognitive processes, and the concurrent acquisition of structural MRI allows the regions of activity to be accurately mapped onto images of the brain. The advantages of fMRI over other techniques is that it is non-invasive and allows the study of brain function without the use of ionising radiation or the injection of radiopharmaceuticals that are used by other (like PET and SPECT). In practice, fMRI can be conducted on most clinical 1.5 Tesla MR scanners, using conventional hardware, although some additional software is often needed. Nowadays, high field scanners (3 Tesla) are more common and are the preferred choice as they afford greater signal-to-noise ratio. In comparison to other modalities fMRI offers the best spatial resolution, however, it is susceptible to a number of artefacts, the most limiting of which is caused by movement. Hence, in most fMRI experiments it is necessary for subjects to lie extremely still for up to 40 min and this makes it difficult to apply to some
21
psychiatric disorders such as panic disorder and mania (Wylie et al., 2014).
1.2.2 Structural Magnetic Resonance Imaging
As mentioned before, MRI takes advantage of the fact that certain atoms when placed in a magnetic field align with the direction of the field. In an MRI scanner, this pattern of alignment is predictably disrupted by radio- frequency (RF) waves that are turned on and off systematically to yield pulses of energy that are then measured and processed into images. Hydrogen is the most commonly imaged element in MRI because of its abundance and because it gives the strongest signal. The nucleus of a hydrogen atom is a single spinning proton with a positive charge that generates a tiny magnetic field. Normally, the field surrounding hydrogen atoms is orientated randomly and together the fields of many hydrogen atoms cancel out. However, when in a large external magnetic field (B0) such as that of the MRI scanner the protons align with the direction of the field and precess about B0 at a frequency called the Larmor frequency, and lie in the RF range. If then an RF pulse of this frequency is directed into the tissue the spinning protons resonate and precess in phase. This generates a transverse magnetic field that precesses at the same Larmor frequency. When the RF pulse is switched off
22
the precessing protons induce an electromagnetic field in a detector coil outside the tissue that can be measured and subsequently powerful computers process this raw data to produce the MRI images (Rodriguez, 2004).
Based on MRI principles, sMRI technique translates the local differences in water content into different shades of gray, that serve to outline different brain regions shape and size. The two main characteristics which govern image quality are spatial resolution and signal to noise ratio (SNR). In-plane resolution is chiefly determined by the number of picture 3D elements (voxel) in the frequency and phase encoding directions, and through-plane resolution by the slice thickness. SNR is determined by voxel size, slice thickness, scan time (including the number of phase encoding steps) and the sequence used. Image quality is
therefore ultimately determined by scan time, which, in
turn, is influenced chiefly by patients’ ability to comply with keeping still.
During the last three decades, structural MRI had emerged as an essential tool for morphometric techniques (including volumetric, shape analysis, and microstructural techniques) (Spalletta et al., 2018). These techniques helped clarify in vivo some of the principal neurobiological characteristic of major psychiatric (Chiapponi et al., 2018; Dusi et al., 2018; Janiri et al., 2018), neurological and neurodegenerative diseases (Lipp et al., 2018; De Marco and Venneri, 2018; Di Paola and Bourisly, 2018; Péran et
23
al., 2018; Schrader et al., 2018), but also of normal population studies (Matsuda, 2018; Tamnes and Østby, 2018) and cognitive neuroscience, in general (Morita et al., 2016).
sMRI: sequences and terminology
The appearance of the brain on an image from an MRI scan is dependent on a number of interrelated factors (see Table 1). These include innate tissue properties that are described using parameters such a relaxation time and proton density, and are referred to as T1 and T2. Imaging techniques and protocols also determine the exact nature of the image obtained and terms that are frequently used in this context include sequences such as spin-echo, fast spin-echo, gradient-echo and echo-planar imaging with varying echo times (TE), flip angles and repetition times (TR). A T1- weighted image has a short TR and short TE such that tissues with a short T1 relaxation time appear bright and those with a long T1 appear dark. On a T2-weighted image that has long TR and long TE, tissues with a short T2 relaxation time are dark and those with a long T2 are bright (Rodriguez, 2004).
Images from conventional T1-weighted (T1-w) and T2-weighted (T2-w) MRI sequences, are characterized by a high contrast and spatial resolution, being widely used to
24
Table 1
CSF: cerebral-spinal fluid;
investigate structural properties of the brain (Ganzetti et al., 2015), used for volumetric study (Spalletta et al., 2018). Pathological processes are therefore most often described in terms of T1 and T2 signal behavior that results in a computer-generated image with a highly detailed map of the brain’s tissues and structures. Thus, this tool can be used to discover the presence of abnormal tissue through the changes in tissue density or composition. Scientists, clinician and neuroradiologist examining an sMRI can readily distinguish between gray and white matter and other types of tissue—both normal, such as blood vessels, and abnormal, such as tumors—by their different shading and contrast with surrounding areas.
A third commonly used sequence is the Fluid Attenuated Inversion Recovery (FLAIR). FLAIR images are heavily similar to T2-weighted images, except that the
25
TE and TR times are very long. By doing so, abnormalities remain bright but normal CSF fluid is attenuated and made dark. It has been introduced as a complement of, or even a replacement for, the conventional T2-weighted sequence. Indeed, setting to null fluids using an inversion time that effectively suppresses hyperintense signals from free water in cerebrospinal fluid (CSF), FLAIR sequences allow to highlight hyperintense coming from tissues’ lesions (De Coene et al., 1992). Hence, this sequence is very sensitive to pathology and makes the differentiation between CSF and an abnormality much easier (Fukuoka et al., 2010; Iorio et
al., 2013; Sati et al., 2012).
1.2.4 Diffusion Neuroimaging
A more recent brain imaging technique, which has emerged from advances in MRI, is that of Diffusion Weighted Imaging (Bammer, 2003) and Diffusion Tensor Imaging (Mori and Zhang, 2006) (respectively, DWI and DTI). These last takes advantage from specific MRI sequences as well as software that uses the diffusion of water molecules to generate contrast in MR images.
Diffusion weighted imaging is an MRI modality that enables the quantification of the diffusion of water in tissue making it possible to investigate microstructural aspect of the white matter, within the brain. It is predicated on the fact
26
that anatomical structures such as cell membranes, myelin sheaths, as well as intracellular micro-organelles act as barriers to the diffusion and free movement of water thus limiting the spatial flow of these molecules. The arrangement of axons in parallel bundles with myelin sheaths facilitates the diffusion of water molecules longitudinally, preferentially along their main direction. Such preferentially oriented diffusion is called anisotropic diffusion (Mori and Zhang, 2006). By acquiring a conventional diffusion weighted MRI in at least six non- collinear directions it is possible to reconstruct the brain’s underlying neuronal microstructure that is normally ‘invisible’ using conventional MRI (Schilling et al., 2017).
A special kind of DWI, DTI, has been used extensively to investigate and to map white matter microstructural integrity and tractography in the brain (Davis et al., 2009; Lazar et al., 2003; Melhem et al., 2002). Tractographic reconstruction of neural connections via DTI is based on an extension of diffusion MRI properties. Indeed, if a series of diffusion gradients (i.e. magnetic field variations in the MRI magnet) are applied in a fashion that can determine at least 3 directional vectors (use of 6 different gradients is the minimum and additional gradients improve the accuracy for "off-diagonal" information), it is possible to calculate, for each voxel, a tensor (i.e. a symmetric positive definite 3×3 matrix) that describes the 3-dimensional shape of diffusion (Mori and
27
Zhang, 2006; Mori and van Zijl, 2002; Schilling et al., 2017). Specifically, the fiber direction is indicated by the tensor's main eigenvector. This vector can be color-coded, yielding a cartography of the tracts' position and direction (red for left-right, blue for superior-inferior, and green for anterior-posterior) (Alexander et al., 2007; Jones and Leemans, 2011). Characterization of each eigenvalue (l) in
the tensor and combinations (see. Table 2) of them help constitute the main diffusion measures, offering information of microstructural aspects. In DTI studies, there are four measures that are most commonly used; fractional anisotropy (FA), mean diffusivity (MD), axial diffusivity (AD) and radial diffusivity (RD). Specifically, in axial diffusivity (AD) we only quantify the value of l1. While in radial diffusivity (RD) we take the average of l2 and l3. Mean diffusivity (MD) provides an average of all. And finally, fractional anisotropy (FA) provides the relative difference between the largest eigenvalue as compared to the others. These measures are commonly used clinically to localize white matter lesions that do not show up on other forms of clinical MRI (Alexander et al., 2007).
28 Table 2
A further advance of DTI is its application to non- invasively construct 3D trajectories of neural tracts in-vivo, using tractographic techniques (Lazar et al., 2003). Specifically, fiber tracking algorithms can be used to track a fiber along its whole length (e.g. the corticospinal tract, through which the motor information transit from the motor cortex to the spinal cord and the peripheral nerves). Tractography is a useful tool for measuring deficits in white
CSF: cerebrospinal fluid; WM: white matter; SNR: signal-to-noise ratio; FA: Fractional Anisotropy; MD: Mean Diffusivity; AD: Axial Diffusivity; RD: Radial Diffusivity; l: eigenvalue
29
matter, such as in aging (Davis et al., 2009). Its estimation of fiber orientation and strength is increasingly accurate, and it has widespread potential implications in the fields of cognitive neuroscience and neurobiology. Tractography also allows the modelling of white matter neural connectivity, a method that is currently the subject of intense investigation as it can provide information relating to neuronal connections (Rubinov and Sporns, 2010). At this point in time the ability of DTI to characterize the white matter architecture of the brain is unparalleled by any other imaging modality.
2. Structural Neuroimaging in Psychiatric Disorders
Advances in neuroscience have revolutionized our understanding of the central nervous system leading to new insights into the complex anatomical, physiological, biochemical, genetic, and molecular organizational structure of the human brain. Specifically, neuroimaging technologies have enabled the investigation of normal brain function/structure and are being used to gain important new insights into the mechanisms behind many neuropsychiatric disorders. Indeed, since the demonstration, in 1976, that patient with schizophrenia had enlarged cerebral ventricles (Johnstone et al., 1976), psychiatry was pushed in a new era where neuroimaging would help it identify mental disorders
30
and ultimately clarify their mechanisms. Thanks to structural brain neuroimaging, it is now widely accepted that schizophrenia is a neurodevelopmental disorder with neurobiological evidence (Chiapponi et al., 2018). The fact that structural changes occur and are discernible with neuroimaging methodologies has assisted in unravelling the pathophysiology of schizophrenia, and of other major psychiatric condition, like mood disorders (Janiri et al., 2018).
The research applications of neuroimaging in psychiatry, however, have to compound to several issues, intrinsically related to psychiatric illness. Indeed, they are usually primarily diagnosed by careful assessment of behavior combined with subjective reports of abnormal experiences to group patients into disease categories, that mask substantial heterogeneity. For example, a diagnosis of schizoaffective disorder is often given to people with episodes of both affective and psychotic symptoms, (either alternating or occurring together) which casts some doubt on the traditional dichotomy delineating affective and psychotic disorders into discrete illness categories (Craddock and Owen, 2005). In the absence of definitive and objective biomarkers of pathophysiological processes underlying behaviors associated with conventionally defined psychiatric illness categories, and because of the heterogeneity within, and considerable overlap between,
31
these behaviors, appropriate diagnosis and treatment are difficult for many psychiatric illnesses.
Bipolar disorder is an especially good example of a group of psychiatric illnesses that are difficult to diagnose accurately. For example, although this disorder, along with other psychiatric illnesses, is one of the ten most debilitating of all non-communicable diseases (Department of Health Statistics and Informatics, 2008), misdiagnosis of the illness as recurrent unipolar depression occurs in 60% of patients seeking treatment for depression (Goodwin and Jamison, 2012; Hirschfeld et al., 2003). Moreover, bipolar disorder types I and II are especially difficult to diagnose accurately in clinical practice, particularly in their early stages. Only 20% of patients with bipolar disorder who are experiencing a depressive episode are diagnosed with the disorder within the first year of seeking treatment (Hirschfeld et al., 2003), and the mean delay between illness onset and diagnosis is 5–10 years (Baldessarini et al., 2007). A major reason for the difficult diagnosis is the challenge of differentiating bipolar disorder type I or II from unipolar depression — an illness characterized by recurrent depressive episodes — especially in patients who present during a depressive episode and in those with no clear history of mania or hypomania (Goodwin and Jamison, 2012; Hirschfeld et al., 2003). This is further compounded by comorbid anxiety (Simon et al., 2004), substance misuse (Cassidy et al., 2001).
32
Neuroimaging technologies being used to gain important new insights into the mechanisms behind bipolar disorders. Limbic and cortical areas and circuits that are implicated in the generation and regulation of emotion have been the main focus in neuroimaging research, since they can be readily visualized and investigated using structural techniques. Hence, mood disorders, in general, and bipolar disorder neuroimaging research in particular, is now a substantive and promising field. The research applications of neuroimaging in bipolar disorder aim to relate psychopathology to structural and functional aspects of the brain and can be broadly viewed as having either a restructuring or refining role. Restructuring involves dispensing with the current psychiatric phenomenological entities and replacing these with biologically driven explanations based on neuroscientific findings. In contrast,
refining involves generally maintaining the current
categories of psychiatric disorders but validating their essential elements by providing a neural substratum. Both approaches find support in the many studies that have been conducted in bipolar patients populations.
3.1 Structural Neuroimaging in Bipolar Disorder
In DSM-5, bipolar and related disorders, as they are now called, are given a chapter on their own, that includes
33
bipolar I disorder, bipolar II disorder and cyclothymic disorder (American Psychiatric Association. DSM-5 Task Force., 2013). While in the past only a distinct period of abnormally and persistently elevated, expansive or irritable mood was necessary, these symptoms now have to be present in combination with persistently increased (goal- directed) activity or energy, most of the day, nearly every day.
Bipolar Disorder (BD) is a mood disorder that confers considerable individual and societal morbidity and cost (Gardner et al., 2006). Patients with BD experience recurrent episodes of marked mood changes, which last for at least a week, and may continue for months. These episodes consist of periods of mania or hypomania, depression, or mixed mood, interspersed with periods of normal mood (euthymia) (Belmaker, 2004). A significant body of evidence suggests that BD has a strong neurobiological basis and structural brain abnormalities in BD have been reported (Hallahan et al., 2011; Hibar et al., 2016), even if the pattern of these brain abnormalities based on magnetic resonance imaging is still not clearly defined.
White Matter
White matter (WM) abnormalities are one of the most consistently reported findings in neuroimaging studies of
34
BD (Vederine et al., 2011). Indeed, the presence of white matter hyperintensities (WMH) on T2-weighted and FLAIR MRI scans was confirmed in several neuroimaging studies (Altshuler et al., 1995; Gulseren et al., 2006). Although the pathogenesis of WMH is not completely understood, at least some are likely to reflect vascular ischemia and are associated with cardiac risk factors and normal ageing (Matsusue et al., 2006). Despite the association with age, a number of studies have reported WMH in young patients with bipolar disorder (Altshuler et al., 1995; Breeze et al., 2003; Lyoo et al., 2002; Silverstone et al., 2003). They appear particularly significant in affective disorder, having been associated high rates of suicidality (Pompili et al., 2007).
DTI studies are a more recent promising approach for the investigation of WM microstructural biomarkers and endophenotypes in BD. The first whole-brain DTI studies generated heterogeneous results concerning the type of FA variation (increase or decrease) and the precise location of these changes. Some studies have reported a localized (Bruno et al., 2008; Liu et al., 2010; Sussmann et al., 2009) or diffuse decrease in FA (Chan et al., 2010; Kafantaris et
al., 2009; Zanetti et al., 2009), whereas others have reported
an increase in FA in diffuse regions (Michèle et al., 2009) or a mixture of increases and decreases in FA (Mahon et al., 2009; Versace et al., 2008). This may reflect different
35
methodological approaches and heterogeneity within the clinical populations studied.
Review studies (Brambilla et al., 2009; Heng et al., 2010; Mahon et al., 2010; Sexton et al., 2009; Womer et al., 2009) and meta-analysis (Vederine et al., 2011) of DTI studies in BD have tried to summarize the results, even if several issues are still unaddressed.
Gray Matter
A number of studies have examined structural gray matter characteristics in cortical and subcortical regions of adults with BD. Many of them was conducted by means of volumetric measurements of regional brain structures and the results often showed inconsistent findings (Arnone et
al., 2009; McDonald et al., 2004b). Specifically, previous
studies in BD patients have examined cortical regions implicated in emotion processing and cognitive processes that are important for emotion regulation, including the cingulate cortex as well as frontal and temporal regions (Lyoo et al., 2004; Nugent et al., 2006; Wilke et al., 2004). Prefrontal cortical gray matter volumes had been found to decrease with illness progression (Kalmar et al., 2009) but normalize (or even increase) with treatment (Moore et al., 2000, 2009). Studies have also reported widespread decreases in frontal cortical thickness bilaterally, especially in the right hemisphere, and abnormally decreased temporal and parietal cortical thickness bilaterally in adults with
36
bipolar disorder (Foland-Ross et al., 2011; Rimol et al., 2010).
A second key finding relating to emotion processing and regulation neural circuits is decreased subcortical deep gray matter structures. Specifically, abnormally decreased hippocampal and parahippocampal volumes have been reported in adults with bipolar disorder (Almeida et al., 2009; Rimol et al., 2010; Wijeratne et al., 2013), although such abnormalities may be masked or compensated by treatment (Foland et al., 2008; Hajek, Kopecek, et al., 2012; Hallahan et al., 2011).
Although volumetric analyses of structural brain imaging data have been a mainstay of brain structure investigations in BD, in recent years methodological developments have led to structural measures that can supplement them. Specifically, recent studies in BD reported changes in shape of the surface of the caudate nucleus (Ong et al., 2012), putamen, ventral striatum and thalamus (Womer et al., 2014). Shape analysis enables the uncovering of localized deformations on the surface of a brain structure and it may more precisely identify impaired morphologies within the brain. This is particularly important in the study of brain structures with explicit regional differentiation in functions, such as thalamus or striatum (Herrero et al., 2002), that are central subcortical areas involved in BD (Womer et al., 2014).
37
The variability of the results is still predominant in BD literature findings (McDonald et al., 2004) and perhaps unsurprising given the enormous clinical heterogeneity (e.g. in illness subtype, mood-state, medication status, illness severity and duration, etc.) and small size of samples studied. For instance, one much debated source of bias in the study of brain volumetric associations with BD is the effect of mood-stabilizing medications, primarily lithium, which may influence brain structure (Hartberg et al., 2015; Hibar et al., 2016). Neuroimaging studies are promising components for a new diagnostic framework for BD, but a major issue is the potential confound of psychotropic medication upon experimental measures. Withdrawing all individuals from medication and examining only unmedicated individuals may be clinically unfeasible and may render findings less generalizable. Ideally, comparisons of medicated with unmedicated individuals should be included in cross-sectional functional neuroimaging studies of bipolar disorder.
The present work aimed to address these specific aspects. Specifically, study 1 investigated the trajectories of grey and white cerebral volumetry in bipolar disorder progressions, while study 2 and 3 assessed the impact of pharmacological treatment with lithium on subcortical structures volumetry and shape, respectively.
38
CHAPTER 2
Study 1: Gray and white matter trajectories in patients with bipolar disorder
2.1 Introduction
As stated above, although several structural abnormalities in the cortical, subcortical, and limbic systems of patients with bipolar disorder (BD) have been documented, the findings are often inconsistent. For example, gray matter (GM) volumes of several structures, including the cingulate cortex as well as frontal and temporal regions, have been found to be reduced (Lyoo et
al., 2004), to be increased (Adler et al., 2007), or to show no
differences (McDonald et al., 2005) when compared with healthy control subjects (HC). Furthermore, two large meta- analyses of cross-sectional structural imaging studies of patients with BD also yielded inconclusive results. In particular, Kempton and colleagues (Kempton et al., 2008) described increased brain ventricular volumes and corpus callosum atrophy, while Arnone and colleagues (Arnone et
al., 2009) found significant whole-brain and prefrontal lobe
reductions. More recently, Selvaraj and collaborators (Selvaraj et al., 2012) found neuroanatomical abnormalities
39
in the right prefrontal cortex, anterior cingulate cortex, insula, and claustrum in patients with BD. Some voxel- based morphometry (VBM) studies highlighted regional and global reductions in white matter (WM) volume and density (Chen et al., 2004; Davis et al., 2004), while others failed to replicate these findings (López-Larson et al., 2002; Scherk
et al., 2008). This mirrors the lack of concordance found in
GM studies.
Although longitudinal studies yielded more consistent findings of progressive atrophy of the prefrontal cortex, anterior cingulate cortex and subgenual region, they yet again reported less consistent findings for temporal and related regions, such as the hippocampus (Lim et al., 2013). To understand which brain abnormalities are present from the very beginning of the disorder and to evaluate how they change during the illness course, it is fundamental to assess patients with BD over a long-time span. It is also necessary to have a long observational period to determine whether the ageing process affects patients with BD and HC differently. Thus, to address all these critical issues, this work employed a cross-sectional case-control study to compare structural brain abnormalities at different ages (hereafter called trajectories) in patients with BD and HC over a time period of about 50 years.
The primary aim of the present study was to understand whether WM and GM changes were present from the beginning of the illness and whether they
40
continued to be present over the course of the illness. Since patients with bipolar disorder types I (BD-I) and II (BD-II) have different symptomatology and severity, preliminarily we compared trajectories between the two subgroups to verify their homogeneity and investigate shared and unique diagnosis-related neuro-anatomical abnormalities.
2.2 Methods and Materials
The study was approved and undertaken in accordance with the guidelines of the Santa Lucia Foundation Ethics Committee. All participants gave their written informed consent to participate in the research after they had received a complete explanation of the study procedures.
G*Power statistical software (Erdfelder et al., 2009), was used to compute power analysis. Results shown that a sample size of at least 19 would have greater than 80% power to detect a difference between groups with an alpha value of <0.05 (two tailed).
Participants
Consecutive patients with a diagnosis of BD according to the Diagnostic and Statistical Manual of Mental Disorders IV-Edition, Text Revised (DSM-IV-TR)
41
(American Psychiatric Association, 2000) were assessed at the Santa Lucia Foundation in Rome, between January 2012 and January 2015. Inclusion criteria for all participants were: (i) age between 18 and 75 years, (ii) at least five years of education, and (iii) suitability for magnetic resonance imaging (MRI) scanning. Exclusion criteria were: (i) history of alcohol or drug abuse in the two years before the assessment, (ii) lifetime drug dependence, (iii) traumatic head injury with loss of consciousness, (iv) past or present major medical illness or neurological disorders, (v) any (for HC) or additional (for patients with BD) psychiatric disorder or mental retardation, (vi) dementia or cognitive deterioration according to DSM-IV-TR criteria, and Mini-Mental State Examination (MMSE) (Folstein et al., 1975a) score < 25, consistent with normative data in the Italian population (Measso, G., Cavarzeran, F., Zappalà, G., Lebowitz, B. D., Crook, T. H., Pirozzolo, F. J., ... & Grigoletto, 1993), and (vii) any potential brain abnormality or microvascular lesion as apparent on conventional fluid attenuated inversion recovery (FLAIR) scans; in particular, the presence, severity, and location of vascular lesions were computed according to the semi-automated method recently published by Santa Lucia Foundation neuropsychiatric research (Iorio et al., 2013).
All patients were recruited at three sites: the Lithium Clinic at Sant’Andrea Hospital, Villa Von Siebenthal, and the Santa Lucia Foundation in Rome. The clinical
42
psychiatrist who had been treating the patients and knew their clinical history, and who was blind to the aims of the study, made the preliminary diagnosis using the DSM-IV- TR criteria. All clinical diagnoses were confirmed by a research psychiatrist using the Structured Clinical Interview for DSM-IV-TR-Patient Edition (SCID-I/P) (First et al., 2002). If the diagnoses made at the two different steps were not consistent, more data were gathered and the diagnostic process continued until a final diagnostic consensus was reached. If an agreement could not be reached, the patient was removed from the sample.
The researchers involved in the assessment of the patients completed an intensive training program in preparation. The training program consisted of bi- or tri- weekly eight-hour sessions where junior researchers assessed the patients under the continuous supervision of a senior researcher. The training program lasted from three to six months, and did not end until all the researchers were able to make a psychopathological and neuropsychological assessment achieving good inter-rater reliability (k ≥ 0.8).
Eighty-five patients with BD were initially included in the present study. Of the original group of patients, three refused to undergo the MRI exam and four were excluded for the presence of moderate to severe brain vascular lesions (see exclusion criteria). The remaining sample of 78 patients included 49 with BD-I and 29 with BD-II.
43
We also recruited 78 HC in the same geographical area. They were carefully matched with the patients for age (2 years), gender, and educational level (2 years). All HC were screened for a current or lifetime history of DSM-IV- TR Axis I and II disorders using the SCID-I-NP ) (First et
al., 2002) and SCID-II (M. B. First et al., 1997); they were
also assessed to confirm that no first-degree relative had a history of mood - or schizophrenia-related disorders.
The overall severity of affective symptoms was assessed using the 17-item Hamilton Depression Rating Scale (HDRS) (Hamilton, 1960) and the Young Mania Rating Scale (YMRS) (Young et al., 1978). Age at onset was defined as ‘age at onset of first affective symptoms’, which were investigated in an interview with patients and first-degree relatives. All patients were under stable pharmacologic treatment for at least six months, usually polipharmacy, including treatment with antidepressants, mood-stabilizing agents, and stable oral dosages of one or more antipsychotics (data not shown; available upon request).
Image acquisition and processing
All 156 participants underwent the same imagingprotocol, which included 3D T1-weighted, T2- weighted and FLAIR sequences using a 3T AllegraMR imager (Siemens, Erlangen, Germany) with a standard
44
quadrature head coil. Whole-brain T1-weighted images were obtained in the sagittal plane using a modified driven equilibrium Fourier trans-form sequence (echo time/repetition: time=2.4/7.92msec, flip angle=15°, voxel size=19191mm3). T2 and FLAIR sequences were acquired to screen for brain pathology.
T1-weighted images were processed and examined using SPM8 software (Wellcome Department of Imaging
Neuroscience Group, London, UK;
www.fil.ion.ucl.ac.uk/spm) and specifically the VBM toolbox VBM8 (http://dbm.neuro.uni-jena.de/vbm.html) running in Matlab2007b (MathWorks, Natick, MA, USA). VBM8 extends the unified segmentation model (Ashburner and Friston, 2005) consisting of MRI field intensity inhomogeneity correction, spatial normalization and tissue segmentation at several pre-processing steps to further improve data quality. The segmented GM and WM maps were registered to the Montreal Neurological Institute (MNI) space using the iterative high-dimensional normalization approach provided by the Diffeomorphic Anatomical Registration Through Exponentiated Lie Algebra (DARTEL) (Ashburner, 2007) toolbox. The normalized tissue maps were written with anisotropic voxel resolution of 1.5 x 1.5 x 1.5 mm3. The tissue deformations were then used to modulate participants’ GM and WM maps. Finally, the modulated and normalized GM and WM segments were smoothed with an 8-mm full-width half-
45
maxi-mum Gaussian kernel. The segmented, normalized, modulated and smoothed GM and WM images were used for analyses.
Statistical analyses
Comparisons between the diagnostic groups on sociodemographic characteristics (age, gender, and educational level) were performed using the t-test or chi- square test.
Factorial analysis of covariance (ANCOVA) was used to compare, at the voxel level, the potential age-related changes in terms of brain volume, evaluated in GM and WM, between diagnostic groups. For both tissues, volume was the dependent variable, and diagnosis was included as a fixed factor (independent variable), and age as a covariate. We did not include illness duration as a regressor in the ANCOVA model since it was strongly collinear with age (R=0.65) and the presence of collinear regressors could reduce the strength of results (Berk, 1977). We first verified the linear dependence between volume and age, the primary hypothesis of ANCOVA. Then, we verified the ANCOVA assumption of homogeneity of regression slopes, i.e., we looked for the absence of any interaction between diagnosis and age. Where this hypothesis was fulfilled, we looked for
46
the presence of a main effect of the diagnosis. To avoid type I errors (i.e., accepting false positives) all these analyses were performed using the family-wise error (FWE) correction (p<0.05), which controls for the possibility of any false positives across the entire volume (Ashburner and Friston, 2005). In addition, results were considered statistically significant if they were part of a spatially contiguous cluster of 30 voxels or greater. As already mentioned, we used the normalized and modulated images for the analysis, which already accounted for different head sizes in the data. Therefore, there was no need for further corrections for head size in the statistical model.
Before comparing age-related trajectories between the whole group of patients with BD and HC, we first determined whether there was any difference in the age- related trajectories followed by GM and WM volumes between the two subgroups of patients, i.e., those with BD-I and BD-II. In this case, the comparisons were performed at the significance level of p<0.05, uncorrected for multiple comparisons, in order to avoid type II errors (i.e., rejecting false negatives) in the final results. These groups were not different for age and gender, but were different for illness duration (Table 1) and we therefore included this continuous variable in the ANCOVA model to correct for its potential effect.
47
4.4 Results
Sociodemographic and clinical characteristics
Sociodemographic and clinical characteristics of the patients are shown in Tables 1 and 2. The youngest patient was 21 years old, and the oldest was 72 years old. Specifically, we had 13 patients in the 21–30 years age group, 20 patients in the 31–40 years age group, 15 patients in the 41–50 years age group, 21 patients in the 51–60 years age group, six patients in the 61–70 years age group, and three patients in the 71–75 years age group. The groups of patients with BD-I and BD-II and the group of HC did not significantly differ for age, gender, and educational level, but the BD-I and BD-II groups differed for illness duration.
48
Age-related gray matter trajectories
When comparing age-related GM trajectories between patients with BD-I and BD-II, we did not find GM voxels with either a significant interaction between diagnosis and age or a main effect of diagnosis, indicating that the age- related GM trajectories of both patient subgroups were indistinguishable for all GM voxels. We therefore analyzed the two BD subtypes as one group and continued comparing age-related trajectories between patients with BD and HC. In the ANCOVA comparing patients with BD and HC, the test for voxel-wise linear dependence between GM volume and age revealed a negative linear correlation (p<0.05) in clusters distributed in the entire GM in both BD and HC. While no interaction between diagnosis and age emerged, the ANCOVA analysis unveiled a significant (p<0.05,
49
FWE-corrected) main effect of diagnosis in four clusters. As shown in Figure 1 and described in Table 3, one cluster was localized in the posterior cingulate cortex (PCC), one in the right thalamus and two clusters were localized bilaterally in the cerebellum. In order to identify which thalamic area the cluster in the thalamus belonged to, we employed the probabilistic thalamic Connectivity Atlas
(Johansen-Berg et al., 2004)
(http://www.fmrib.ox.ac.uk/connect) that divides the
thalamic structure according to the projections to different cortical regions, and it emerged that the whole cluster belonged to the thalamic area projecting to the temporal lobe.
Analogously, to obtain the precise anatomical localization of clusters in the cerebellum, we superimposed our results onto Diedrichsen’s probabilistic atlas, which subdivides the cerebellum into 10 different regions (Diedrichsen et al., 2009), and it appeared that the cerebellar clusters belonged bilaterally to lobules I–IV (see Table 3). In particular, the ANCOVA results suggested that the GM age-related trajectories of the two diagnostic groups were parallel (no interaction) and that they were significantly different starting from the youngest age (main effect of diagnosis). To confirm this, we calculated the mean GM intensity for each subject in those regions where an effect of diagnosis emerged and plotted the mean GM intensity as a function of age for the two groups. As shown in Figure 1,
50
the patients had reduced GM with respect to HC in the entire age range considered. In each cluster, the slopes of the linear regressions fitting the data of the two diagnostic groups were significant (p<0.05) and, as the absence of interaction between diagnosis and age suggested, statistically indistinguishable.
51
Age-related white matter trajectories
In accordance with results found in GM, WM trajectories of patients diagnosed with BD-I and BD-II were indistinguishable for all WM voxels. Therefore, we compared age-related trajectories between the whole BD group and HC. We first tested for the voxelwise linear
52
dependence between whole-brain WM and age inpatients with BD and HC, and we found a negative correlation (p<0.05) in both groups for all WM voxels. While no interaction between diagnosis and age emerged, the ANCOVA revealed a main effect of diagnosis in one cluster [1,242 voxels, Z-score=5.18, p (FEW-corrected) <0.0001] with the statistical peak localized in the left posterior limb of the internal capsule (MNI coordinates: x=-26, y=-13, z=- 2) (see Fig. 2). In particular, the ANCOVA results indicated that the WM age-related trajectories of the two diagnostic groups were parallel (no interaction) and that they were significantly different starting from the youngest age (main effect of diagnosis). Figure 2 shows that patients had reduced WM with respect to HC in the whole age range considered. The fitted linear regressions were both significant (pBD=0.006 and pHC=0.02), Pearson’s
correlations were rBD=-0.31 and rHC=-0.26, and the slopes
54
2.4 Discussion
The aim of this study was to investigate the presence of structural brain abnormalities at different ages in patients affected by BD and to compare them to those in HC. The present work was based on cross-sectional case–control comparisons.
Previous studies have already used a cross-sectional design to evaluate brain modifications over a span of time in patients diagnosed with schizophrenia (Chiapponi et al., 2014), BD (Lopez-Larson et al., 2010), major depressive disorder (Hagan et al., 2015), and autistic spectrum disorder (Greimel et al., 2013). Our results revealed age-related atrophy in GM and WM volumes in both patients and HC, as already found in a previous large study focused on patients with BD-I in the euthymic phase (Emsell et al., 2013). With respect to HC, patients with BD showed a reduced brain volume in areas comprising the PCC (BA23) bilaterally, the right thalamus, the bilateral cerebellum and the left posterior limb of the internal capsule. The fact that these areas were permanently reduced over the entire age range investigated here suggests that brain alterations are present from the very early phase of the disorder, and that the brain alterations are not the results of a neurodegenerative process.
All cerebral areas where a main effect of diagnosis was found are involved in the regulation of two important
55
dimensions in BD: mood/emotion and psychomotricity. The PCC plays a central role in the default mode network (DMN) (Buckner et al., 2007). PCC and DMN abnormalities are present in a wide range of neurological and psychiatric disorders (Buckner et al., 2007; Leech and Sharp, 2014), including mood disorders. Specifically, several MRI studies have reported abnormal functional activity in major depression, although the abnormalities reported are variable (Berman et al., 2011; Bluhm et al., 2009; Zhou et al., 2010; Zhu et al., 2012). Studies on patients with BD are still scarce and results are inconsistent. Compared to HC, volumes of PCC in patients with BD were found to be increased (Adler et al., 2007), unchanged (Sassi
et al., 2004) or decreased (Atmaca et al., 2007; Kaur et al.,
2005). Consistent with the findings of a previous report (Kaur et al., 2005), here we found that the volume of the PCC was decreased from the very early phase of the disease.
The thalamus, a fundamental relay station that connects cortical and subcortical structures as well as different cortical regions, has been reported to be functionally involved in the modulation of emotions, cognition and social behavior (Strakowski et al., 2005). There is an important heterogeneity in the findings of thalamic volume alterations in patients with BD (Ng et al., 2009). To summarize, the majority of studies reported no significant volumetric or GM thalamic differences in patients with BD
56
compared to HC, while few other studies found either increased or decreased thalamic volume. Our data are in line with the latter studies. In particular, we found a volume reduction in the thalamic area projecting to the temporal pole, hippocampal formation, and amygdala (Behrens et al., 2003). It is noteworthy that these structures are part of the limbic system, a group of interconnected are as that classically have been thought to be involved in control of emotions and episodic memory. Recently, a new model of the limbic system has been proposed and it was noted that the alterations of the temporo-amygdala-orbitofrontal network are often present in patients affected by several psychiatric conditions (Catani et al., 2013). According to present findings, it is possible to hypothesize that these alterations in patients with BD are associated with abnormalities in that specific thalamic subregion.
Our findings involving the cerebellum are intriguing, considering its role in the regulation of mood and emotions. Both structural and functional abnormalities were found in the cerebellum of psychiatric patients (Hoppenbrouwers et
al., 2008). Reduced volumes of the vermis and other
cerebellum abnormalities have been found in patients affected by BD (Hoppenbrouwers et al., 2008; Kim et al., 2013; Mills et al., 2005), even though a recent study did not confirm this result (Laidi et al., 2015). We found a decreased volume of the anterior cerebellar lobules, which are primarily involved in the motor control system.
![Verso gli eco-quartieri per la rigenerazione urbana di Pescara
[Towards the eco-quarters for the Pescara urban regeneration]](data:image/gif;base64,R0lGODlhAQABAIAAAP///wAAACH5BAEAAAAALAAAAAABAAEAAAICRAEAOw==)