Functional nanocomposites based on
graphene/DNA interface:
Towards a bio-inspired sensing of UV
radiation effects
Ph.D. Course in Electrical, Materials and Nanotechnology Engineering Curriculum B - Materials and Raw Materials Engineering
XXXII Cycle Ph.D. Candidate: Elisa Toto ID number 1187221 Advisor: Co-Advisor:
Thesis defended on 25 February 2020
Functional nanocomposites based on graphene/DNA interface: Towards a bio-inspired sensing of UV radiation effects
Ph.D. Thesis - Sapienza University of Rome Copyright © 2020 Elisa Toto. All rights reserved Author’s email: [email protected]
“He who fights, can lose. He who doesn't fight, has already lost.” Bertolt Brecht
i
Contents
1 Towards a bio-inspired sensing of UV radiation effects 1
1.1 Introduction 1
1.2 Concept of this Thesis 2
1.3 References 5
2 Composite materials: properties and applications in perspective of UV radiation sensing 9 2.1 Introduction to composite materials 9
2.2 Nanocomposite materials 14
2.2.1 Graphene-based nanocomposites: properties and fabrication 16
2.3 Applications of composite materials in sensing devices 23
2.4 The space environment and UV radiation 30
2.4.1 UV radiation effects on human health and structures 35
2.4.2 Radiation monitoring systems 41
2.5 References 46
3 UV-induced modification of PEDOT:PSS-based nanocomposite films investigated by Raman microscopy mapping 67 3.1 Introduction 68
3.2 Results and discussion 70
3.2.1 SEM analysis of UV-C effects on PEDOT:PSS-based nanocomposites 70
3.2.2 Electrical properties and wettability of PEDOT:PSS-based nanocomposites under UV-C irradiation 72
3.2.3 Raman microscopy investigations of PEDOT:PSS-based nanocomposites 75
3.3 Conclusions 81
Contents
ii
3.5 References 86
4 Direct effects of UV irradiation on graphene-based nanocomposite films revealed by electrical resistance tomography 93
4.1 Introduction 94
4.2 Results and discussion 96
4.2.1 ERT sensitivity analysis 96
4.2.2 ERT mapping of UV damage on nanocomposite surfaces and further investigations on their properties 99
4.3 Conclusions 105
4.4 Experimental section 106
4.5 References 111 5 Curing reactions of elastomeric nanocomposites filled with DNA-modified graphene investigated by differential scanning calorimetry 117
5.1 Introduction 118
5.2 Results and discussion 123
5.2.1 Modeling of the curing reactions of silicone-based nanocomposites filled with DNA-modified GNP 127
5.2.2 Mechanical properties and surface wettability of silicone-based GNP-DNA nanocomposites 133
5.3 Conclusions 136
5.4 Experimental section 136
5.5 References 140
6 Functional nanocomposites with graphene-DNA hybrid fillers: synthesis and surface properties under UV irradiation 145
6.1 Introduction 146
6.2 Results and discussion 147
6.2.1 Analysis of the properties of GNP-DNA/PDMS films and their modifications under UV-C exposure 148
6.3 Conclusions 157
6.4 Experimental section 157
Contents
iii 7 Experimental study of solar radiation effects on carbon nanocomposite
sensors in simulated space environment 165
7.1 Introduction 166
7.2 Results and discussion 167
7.3 Conclusions 174 7.4 Experimental section 174 7.5 References 178 8 Conclusions 181 List of publications 185 Acknowledgments 189
Contents
v
List of Acronyms
AC: alternating currents AFM: atomic force microscopy
CFRP: carbon-fiber reinforced polymer CMC: ceramic matrix composite CNT: carbon nanotube
CP: conductive polymer
CPD: cyclobutane pyrimidine dimer DC: direct currents
DNA: deoxyribonucleic acid
DSC: differential scanning calorimetry
dsDNA: double-stranded deoxyribonucleic acid EIS: electrical impedance spectroscopy
EIT: electrical impedance tomography ERT: electrical resistance tomography EUV: extreme ultraviolet radiation EVA: extravehicular activities
GFRP: glass fiber-reinforced polymer GNP: graphene nanoplatelet
GO: graphite oxide
HALS: hindered-amine light stabilizer IPA: isopropyl alcohol
ISS: international space station
KAS: Kissinger–Akahira–Sunose (method) LEO: low earth orbit
MMC: metal matrix composite OCA: optical contact angle
OFW: Ozawa–Flynn–Wall (method) PCR: polymerase chain reaction
List of Acronyms
vi
PDMS: polydimethylsiloxane
PDMS-OH: hydroxyl-terminated polydimethylsiloxane
PEDOT:PSS: poly(3,4-ethylenedioxythiophene) polystyrene sulfonate PEEK: poly(ether ether ketone)
PMC: polymer matrix composite
(6-4)PP: pyrimidine (6-4) pyrimidone (photoproduct) PPS: poly(phenylene sulfide)
PTFE: polytetrafluoroethylene PVC: poly(vinyl chloride) PVP: polyvinylpyrrolidone RNA: ribonucleic acid RTM: resin transfer molding
SEM: scanning electron microscopy SFE: surface free energy
TML: total mass loss UV: ultraviolet (radiation)
VCM: volatile condensable material WCA: water contact angle
vii
List of Figures
2.1 Schematic representation of composites with different geometrical and spatial characteristics of the dispersed phase: (a) concentration, (b) size,
(c) shape, (d) distribution, (e) orientation 13 2.2 Schematic representation of the assembly of a honeycomb core sandwich
panel 14 2.3 Schematic comparison between a macro-composite and a nanocomposite
at the same volume fraction of filler. The interfacial region (in green) extends into the matrix on the order of Rg, the radius of gyration of the
polymer. a) Scanning electron micrograph shows E-glass reinforced polyolefin (15 μm fiber) and b) transmission electron micrograph shows
montmorillonite-epoxy nanocomposite (1 nm thick layers) 15 2.4 Representation of 2D-structure of graphene that can be wrapped up into
a) 0D fullerenes, rolled into b) 1D nanotubes or stacked into c) 3D
graphite 17
2.5 a) Representation of graphene, graphene oxide, and reduced graphene oxide structures; b) Schematic steps from graphite to reduced graphene
oxide 19
2.6 Schematic representation of different filler arrangements in graphene-based nanocomposites: a) separated, b) intercalated and c) exfoliated
state 22
2.7 a) Representation of graphene sheets decorated with metal oxide nanoparticles acting for pollutants detection; b) Schematic representation of graphene coupled with biological molecules through different types of
interaction 23
2.8 a) Representation of graphene-chitosan composite biosensor for monitoring enzyme activity; b) Representation of graphene bio-
List of Figures
viii
2.9 a) Schematic representation of a photodetector based on a composite structure of gold nanoparticles embedded into silicon pores; b) Schematic representation of sensing composite arrays based on silver nanoparticles
onto zinc oxide nanowires 28
2.10 UV spectral irradiance at the top of the atmosphere (black line) and at
the Earth’s surface (red line) for clear sky conditions 31 2.11 a) Earth’s atmospheric components and pressure at different altitudes;
b) Characteristics of Mars atmosphere at different altitudes and
temperature profiles retrieved from the entry probes of Mars landers 33 2.12 Emission spectrum of different UV lamps. UV-A, UV-B and UV-C
emissions referred to B100 (UVP), RPR-3000 (Southern New England Ultraviolet Co.) and BLE-8T254 (Spectronics Corporation) lamps,
respectively 35
2.13 a) Schematic representation of direct and indirect damages induced in a biological system by UV exposure; b) Representation of typical UV-
induced DNA lesions (in green) 37
2.14 Representation of skin structure and depth of UV penetration at
different radiation wavelengths 38
2.15 Schematic representation of spectroradiometric equipment 43 2.16 UV response of a DNA dosimeter based on Escherichia coli plasmid
quantification of a) CPD and b) 6-4PP UV-induction relative to DNA control samples using the antibodies anti-CPD and anti-6-4PP,
respectively 45
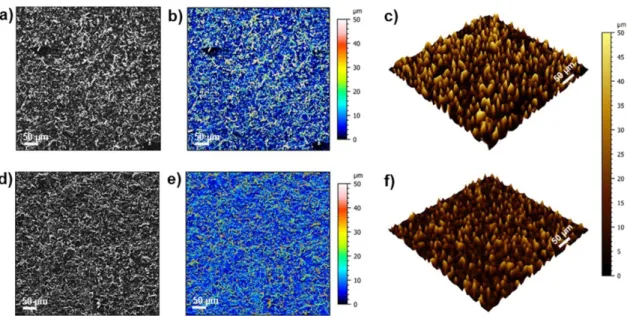
3.1 Morphology investigation by SEM of GNP/PEDOT:PSS nanocomposite not irradiated (top) and after exposure to UV-C for 6 days (bottom): a), d) SEM images acquired with magnification of 500X; b), e) 2D view of the surface topography reconstructions; c), f) 3D view of the surface
topography reconstructions 71
3.2 Morphology investigation by SEM of GNP-DNA/PEDOT:PSS nanocomposite not irradiated (top) and after exposure to UV-C for 6 days
List of Figures
ix (bottom): a), d) SEM images acquired with magnification of 500X; b), e)
2D view of the surface topography reconstructions; c), f) 3D view of the
surface topography reconstructions 71
3.3 Electrical properties of PEDOT:PSS-based nanocomposite films; a) Bode plot for EIS measurements of the films before and after exposure to UV-C for 24 h (radiation dose 54.4 J/cm2); b) changes of the surface
electrical conductivity of the films under UV-C irradiation up to 6 days 73 3.4 Raman analysis of PEDOT:PSS film (a, c) non-irradiated and (b, d) after
UV-C exposure for 6 days (irradiance of 0.63 mW/cm2, total dose of
326.6 J/cm2). a), b) Raman spectra acquired with an excitation
wavelength of 532 nm and a magnification of 10X; c), d) Raman maps obtained over an area of 200 µm 200 µm using the position of the main PEDOT:PSS peak as contrast parameter. Color transition from blue to red indicates a shift of the PEDOT:PSS peak to higher wavenumbers
after exposure to UV-C 76
3.5 Raman analysis of GNP/PEDOT:PSS film (a, c) non-irradiated and (b, d) after UV-C exposure for 6 days (irradiance of 0.63 mW/cm2, total dose of 326.6 J/cm2). a), b) Raman spectra acquired with an excitation wavelength of 532 nm and a magnification of 10X; c), d) Raman maps obtained over an area of 600 µm 600 µm using the intensity of the G peak of graphene normalized to the intensity of the main PEDOT:PSS
peak (IG/IPEDOT) as contrast parameter 77
3.6 Raman mapping of the position of the main PEDOT:PSS peak in (a) PEDOT:PSS film, (b) non-irradiated GNP/PEDOT:PSS film, and (c) irradiated GNP/PEDOT:PSS film after UV-C exposure for 6 days (irradiance of 0.63 mW/cm2, total dose of 326.6 J/cm2) using the position
of the main PEDOT:PSS peak as contrast parameter (investigated area 200 µm 200 µm). Color transition from blue to red indicates a shift
of the peak position to higher wavenumbers. 78 3.7 Raman analysis of the GNP/PEDOT:PSS film after UV-C exposure for
6 days (total radiation dose of 326.6 J/cm2) at magnification of 100X. a) Raman mapping over an area of 60 µm 60 µm using the intensity of the
List of Figures
x
G peak of graphene normalized to the intensity of the main PEDOT:PSS peak (IG/IPEDOT) as contrast parameter; b) Raman spectra corresponding
to the blue and red regions of the map showing the higher intensity of the
G peak with respect to PEDOT:PSS at the outermost surface 79 3.8 Raman analysis of GNP-DNA/PEDOT:PSS film (a, c) non-irradiated and
(b, d) after UV-C exposure for 6 days (irradiance of 0.63 mW/cm2, total dose of 326.6 J/cm2). a), b) Raman spectra acquired with an excitation
wavelength of 532 nm and a magnification of 10X; c), d) Raman maps obtained using the intensity of the DNA I peak normalized to the intensity of the main PEDOT:PSS peak (IDNA I/IPEDOT) as contrast parameter,
showing the decrease of the DNA I peak intensity after irradiation
(investigated area 600 µm 600 µm) 80
4.1 (a) GNP-DNA/PEDOT:PSS nanocomposite film on CFRP laminated substrate (size 40 mm × 40 mm) with sixteen electrode elements fixed by conductive silver epoxy; schemes of applied current injection patterns: (b) adjacent pattern, (c) opposite pattern, (d) 1-11 pattern, (e) 1-12
pattern, and (f) 1-13 pattern 97
4.2 Voltage changes of GNP-DNA/PEDOT:PSS surfaces due to UV-C irradiation recorded using the sixteen-electrode configuration with different injection patterns and currents of 10, 20 and 30 mA. UV-C
exposure: (a, b, c) 2.6 mW/cm2 for 24 h; (d, e, f) 4.0 mW/cm2 for 24 h 98 4.3 Voltage changes of GNP-DNA/PEDOT:PSS surfaces due to UV-C
irradiation recorded using the sixteen-electrode configuration with different injection patterns and currents of 40 and 50 mA. UV-C
exposure: (a, b) 2.6 mW/cm2 for 24 h; (c, d) 4.0 mW/cm2 for 24 h 99
4.4 ERT conductivity change maps of GNP-DNA/PEDOT:PSS film after UV-C irradiation (2.6 mW/cm2, 24 h) reconstructed using EIDORS.
Voltage data recorded with the opposite injection pattern and currents in the range 10-50 mA. The white dashed line denotes the UV-C irradiated
List of Figures
xi 4.5 Reconstructed conductivity change maps of irradiated
GNP-DNA/PEDOT:PSS films after exposure to UV-C intensities of (a) 2.6 mW/cm2 and (b) 4.0 mW/cm2 (exposure time 24 h). Tests with 20 mA current, opposite injection pattern. The yellow and blue colors indicate
negative and positive conductivity changes (normalized), respectively 101
4.6 SEM images of GNP-DNA/PEDOT:PSS nanocomposite surfaces (a, c) before irradiation and (b, d) after UV-C exposure (4.0 mW/cm2, 24 h)
showing local erosion effects on irradiated samples (right). Images acquired with accelerating voltage 10 kV and increasing magnification:
(a, b) 1000 X, (c, d) 3000 X 102
4.7 Surface conductivity changes of irradiated GNP-DNA/PEDOT:PSS films as a function of the UV-C dose determined by electrical impedance spectroscopy in two-electrode measurement cell. Dose range corresponds
to irradiation times from 0 to 7 days (UV-C irradiance of 0.63 mW/cm2) 103 4.8 Raman spectra of (a) GNP/PEDOT:PSS and (b) GNP-DNA/PEDOT:PSS
films before and after UV-C irradiation (0.63 mW/cm2 for 6 days corresponding to a dose of 327 J/cm2) acquired with an excitation
wavelength of 532 nm 105
5.1 DSC thermograms of (a) PDMS (Sylgard 184), (b) PDMS/GNP-DNA 1 wt% and (c) PDMS/GNP-DNA 5 wt% nanocomposite mixtures at
different heating rates 123
5.2 DSC thermograms of (a) PDMS/PDMS-OH (75:25 w/w), (b) PDMS/PDMS-OH/GNP-DNA 1 wt% and (c) PDMS/PDMS-OH/GNP-
DNA 5 wt% nanocomposite mixtures at different heating rates 124 5.3 Extent of conversion (α) as a function of temperature for nanocomposites
with PDMS (Sylgard 184) and PDMS/PDMS-OH (75:25 w/w) matrix at different heating rates: (a, d) neat matrix; (b, e) matrix filled with 1 wt%
GNP-DNA; (c, f) matrix filled with 5 wt% GNP-DNA 126 5.4 Plots of ln(β) versus 1/T at different extents of conversion (α), according
to Ozawa–Flynn–Wall model, for nanocomposites with PDMS and PDMS/PDMS-OH (75:25 w/w) matrix: (a, d) neat matrix; (b, e) matrix
List of Figures
xii
filled with 1 wt% GNP-DNA; (c, f) matrix filled with 5 wt% GNP-DNA 129 5.5 Plots of ln(β/T2) versus 1/T at different extent of conversion (α),
according to Kissinger–Akahira–Sunose model, for nanocomposites with PDMS and PDMS/PDMS-OH (75:25 w/w) matrix: (a, d) neat matrix; (b, e) matrix filled with 1 wt% GNP-DNA; (c, f) matrix filled with 5 wt%
GNP-DNA 130
5.6 Activation energy (Eα) for the curing process of unfilled PDMS matrix
and PDMS/PDMS-OH (75:25 w/w) blend as a function of the extent of conversion estimated by Ozawa–Flynn–Wall (OFW) and Kissinger–
Akahira–Sunose (KAS) methods 131
5.7 Activation energies (Eα) as a function of the conversion degree estimated
by Ozawa–Flynn–Wall (OFW) and Kissinger–Akahira–Sunose (KAS) methods for (a) PDMS-based nanocomposites filled with GNP-DNA (1 wt%, 5 wt%) and (b) PDMS/PDMS-OH based nanocomposites filled
with GNP-DNA (1 wt%, 5 wt%) 131
5.8 Comparison of surface hydrophobicity of standard PDMS Sylgard 184 (left) and PDMS/PDMS-OH blend (75:25 w/w) (right), neat and after addition of 1 wt% and 5 wt% of GNP-DNA, as determined by sessile
drop method 135
6.1 Optical microscope images of the surface of GNP-DNA/PDMS films with different filler concentration (wt%): (a) 20% GNP-DNA, (b) 30% GNP-DNA, (c) 35% GNP-DNA, (d) 40% GNP-DNA. Images taken
under reflected light (magnification 5X) 148
6.2 Surface electrical resistivity as a function of the concentration of GNP-DNA filler in the PDMS matrix, before and after exposure to UV-C
radiation (6.3 W/m2, 8 days) 149
6.3 Water contact angles as a function of the concentration of GNP-DNA filler in the PDMS matrix, before and after UV-C irradiation (6.3 W/m2,
8 days). WCA values are the means of ten replicates on different areas of
List of Figures
xiii 6.4 DSC thermograms of GNP-DNA/PDMS nanocomposites with different
concentrations of GNP-DNA filler, (a) before and (b) after UV-C
irradiation (6.3 W/m2, 8 days). Heating rate: 10 °C/min 154 6.5 DSC thermograms of pure DNA (powder form) before and after UV-C
irradiation (6.3 W/m2, 8 days). Heating rate: 10 °C/min 155
6.6 SEM images (magnification 500X) of 40% GNP-DNA/PDMS nanocomposite (left) and its 3D surface morphology reconstruction
(right), (a, b) before and (c, d) after UV-C exposure (6.3 W/m2, 8 days) 156
7.1 SEM images (magnification 500X) of 15% GNP/PDMS nanocomposite (left) and its 3D surface morphology reconstruction (right), before (a, b)
and after (c, d) the test in thermo-vacuum chamber 168 7.2 SEM images (magnification 500X) of 30% GNP-DNA/PDMS
nanocomposite (left) and its 3D surface morphology reconstruction
(right), before (a, b) and after (c, d) the test in thermo-vacuum chamber 168 7.3 DSC thermograms for neat PDMS, 15% GNP/PDMS and 30% GNP-
DNA/PDMS nanocomposites before (a) and after (b) test 172 7.4 a) Placement of 15% GNP/PDMS sample into the thermo-vacuum
chamber and b) report of the temperature values reached by the chamber walls (top chart) and by the sample (bottom chart) during the test
List of Figures
xv
List of Tables
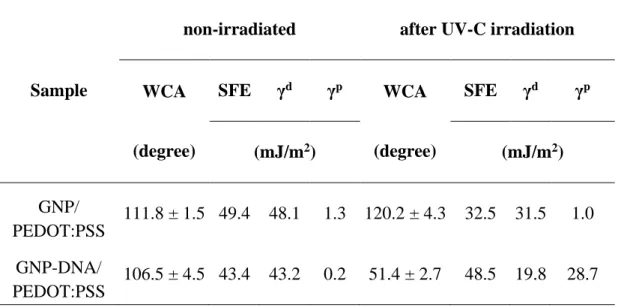
3.1 Water contact angles (WCA) and surface free energies (SFE) with dispersive (γd) and polar (γp) components for PEDOT:PSS-based nanocomposite films with GNP and GNP-DNA filler, before and after
exposure to UV-C for 6 days (radiation dose 326.6 J/cm2) 74
5.1 Curing process parameters for PDMS (Sylgard 184) and PDMS/GNP-
DNA nanocomposites from DSC dynamic scans at different heating rates 125 5.2 Curing process parameters for PDMS/PDMS-OH (75:25 w/w) blend and
PDMS/PDMS-OH/GNP-DNA nanocomposites from DSC dynamic
scans at different heating rates 125
5.3 Activation energies for the curing process of PDMS (Sylgard 184) and PDMS/PDMS-OH (75:25 w/w) nanocomposite systems estimated by Kissinger method (R-squared values from linear regression in parentheses), and isoconversional methods Ozawa–Flynn–Wall (OFW)
and Kissinger–Akahira–Sunose (KAS) 128
5.4 Hardnesses and reduced elastic moduli of nanocomposites with GNP-DNA nanofiller and silicone-based matrices, PDMS (Sylgard 184) and PDMS/PDMS-OH blend (75:25 w/w), from nanoindentation tests (applied load of 0.5 mN). Curing process at 50 °C for 24 h. Standard
deviations of the measurements are in the range 5-8% 134 5.5 Mean values of the water contact angle (WCA) determined by sessile
drop method for nanocomposites with PDMS and PDMS/PDMS-OH
blend (75:25 w/w) and GNP-DNA filler 135
6.1 Mean values and standard deviations of surface electrical conductivities (s) of nanocomposites with different concentrations of GNP-DNA filler
List of Tables
xvi
Conductivity values obtained after fitting the EIS data with a RC equivalent circuit model and converting the resistance values using Eq.
(6.1) 150
6.2 Water contact angles (WCA) and surface free energies (SFE) with dispersive and polar components for GNP-DNA/PDMS nanocomposites with different concentrations of GNP-DNA filler (wt%) before and after
UV-C exposure (6.3 W/m2, 8 days) 153
6.3 Endothermic peak temperatures (Tpeak) and enthalpy changes (H)
determined from DSC thermograms of DNA and GNP-DNA/PDMS
nanocomposites before and after UV-C exposure (6.3 W/m2, 8 days) 155
7.1 Roughness values of 15% GNP/PDMS and 30% GNP-DNA/PDMS nanocomposite surfaces, calculated after 3D reconstruction, before and
after test in thermo-vacuum chamber 169
7.2 Conductivity values of 15% GNP/PDMS and 30% GNP-DNA/PDMS nanocomposites, calculated by Eq. (7.1) before and after test in thermo-
vacuum chamber 170
7.3 Water contact angles of pure PDMS, 15% GNP/PDMS and 30% GNP-DNA/PDMS samples, evaluated before and after test in thermo-vacuum
chamber 170
7.4 Surface free energy values with dispersive and polar components of pure PDMS, 15% GNP/PDMS and 30% GNP-DNA/PDMS nanocomposites,
determined by Eq. (7.2) before and after test in thermo-vacuum chamber 171 7.5 Percentage values of total mass loss (TML%) and water vapor regained
(WVR%) for pure PDMS, 15% GNP/PDMS and 30% GNP-DNA/PDMS
1
Chapter 1
Towards a bio-inspired sensing of UV radiation effects
1.1 Introduction
Ultraviolet (UV) radiation naturally characterizes the Earth environment and the outer space, representing one of the most hazardous agents for human health and for the useful lifetime of organic materials, such as plastics and rubber [1-4]. UV exposure on Earth is limited by several factors, among them the presence of the ozone layer that shields the most dangerous shorter wavelengths, such as those forming the UV-C band (100 nm to 280 nm). Differently, the space environment is characterized by a massive and non-filtered incoming UV radiation, which amounts to about 10% of the total amount of the electromagnetic radiation from the Sun. A strict monitoring of the effects of UV radiation becomes therefore necessary in order to protect biological systems and materials that are typically involved during a space mission.
The possibility to develop a UV-detecting system able to ensure a good sensitivity and stability during measurements, and possessing at the same time endearing characteristics, such as low weight and a real-time response, represents a fascinating challenge towards new technological advances in the field of radiation sensitive materials. In particular, the engineering of devices characterized by a sensitive component in the form of a thin film or a reduced-size 3D material would be desirable to overcome traditional problems that afflict space mission equipment, such as onboard encumbrance, or that can limit their use on Earth.
Specifically, miniaturized UV sensors can be employed to monitor hazardous exposures during working activities involving artificial sources of radiation, without interfering with normal activities. Some applications, such as sterilization processes, involve the use of the highly damaging UV-C light, making necessary the presence of a space-saving sensitive system that is able to detect and quantify any accidental exposure for the workers. In addition, an enhanced UV sensitive device could allow to detect
Chapter 1
2
eventual small amounts of incoming UV-C radiation and to correlate these measurements with the phenomenon of depletion of the ozone layer, especially at the Earth regions that are most at risk, such as those near the equator.
A large number of studies have been focused on human diseases induced by hazardous UV exposure, from cataract to skin cancer, investigating the UV-promoted effects on the main biological molecules and the principal mechanisms of interaction [1, 5-8]. In particular, UV-induced damages on DNA represent the starting point of processes such as mutations, cell death, and development of tumors, which lead to the impairment of the health state of the overall biological system [9-12]. In light of this, several UV-detecting devices exploit biological molecules or simple biological systems, such as spores or bacteria, performing a biological-weighted monitoring of the UV exposure effects [13-17]. In particular, DNA exhibits its maximum sensitivity to short wavelengths, with a peak of absorption at 260 nm [1], which belongs to the UV-C radiation band causing the main direct alterations on the DNA structure. For this reason, this biomolecule can be considered a good candidate to integrate in the design of UV sensing materials.
A novel approach can be undertaken through the fusion of a bio-inspired UV sensing concept, based on the employment of UV-sensitive biological elements, and the field of advanced composite materials. Hence, the assembly of heterogeneous components can be opportunely tuned in order to obtain a functional material with tailored properties for an efficient UV detection. In this perspective, graphene represents a promising component of such sensitive materials, since it exhibits enhanced properties that make it one of the most used elements in the field of multifunctional sensors [18-20]. In addition, graphene nanostructures can be successfully combined with biological molecules using both covalent and non-covalent interactions [21, 22]. This represents the main starting point towards the engineering of a novel bio-inspired UV sensitive nanocomposite, possessing several attractive features, such as low weight, reduced size, and real-time response, which are useful for sensing applications in space and on Earth.
1.2 Concept of this Thesis
The concept of the research described in this Thesis is centered around the design, preparation and testing of bio-inspired UV sensitive nanocomposites based on graphene/DNA interface.
Towards a bio-inspired sensing of UV radiation effects
3 Chapter 2 provides the pathway from the heterogeneous field of composite materials towards the sensing of UV radiation, drawing from the literature background. In particular, the first part of the Chapter describes the fundamental characteristics of composite materials, starting from the concepts underlying their development and classification until their extensive application in sensing devices. Among the different types of composites, graphene-based nanofilled materials are discussed in detail, in order to elucidate their fabrication processes and the peculiar properties that make them good candidates for a bio-inspired approach to UV sensing. The second part of this Chapter contains a report of UV radiation as one of the constituent factors of the Earth and the outer space environments, highlighting sources and typical conditions of exposure. Moreover, UV-damaging effects on human health and materials are described, in order to underline the relevance of detecting and monitoring exposure to this type of radiation. At last, a background of the traditional equipment used for UV radiation monitoring is provided.
A first approach towards the development of UV sensitive nanocomposite materials is reported in Chapter 3. Graphene nanoplatelets were opportunely combined with DNA with the aim to obtain a sensitive filler and, at the same time, to improve their dispersibility in a polymer matrix [23]. GNP-DNA/poly(3,4-ethylenedioxythiophene) polystyrene sulfonate (PEDOT:PSS) films were fabricated and their properties analyzed before and after UV-C irradiation at different doses, in order to examine their UV response. Several techniques were used to characterize these films, including water contact angle measurements, electrical impedance spectroscopy, topography reconstruction from scanning electron microscopy (SEM). Moreover, Raman microscopy mapping was proved to be a useful technique to unveil the chemical modifications of the nanocomposite films induced by UV exposure.
The UV response of the GNP-DNA/PEDOT:PSS nanocomposites was further investigated using electrical resistance tomography (ERT). Chapter 4 describes the application and the optimization of this technique in order to provide conductivity changes that can be directly related to the UV damage caused on the nanocomposite surfaces. In particular, these nanocomposites were applied as coatings onto carbon-fiber reinforced polymer (CFRP) plates, which are advanced materials typically employed in structural elements for space applications [24-26]. This experimental study proposes the
Chapter 1
4
combination of GNP-DNA/PEDOT:PSS coatings and ERT as a possible method for the health monitoring of materials, such as CFRPs, and structures that are exposed to damaging levels of UV radiation. Moreover, other complementary techniques, including SEM and Raman microscopy, were used to validate the results.
The following experiments were focused on incorporating the graphene/DNA filler in a different polymer matrix, based on flexible polydimethylsiloxane (PDMS), with the aim to fabricate free-standing films or 3D materials with improved conformability and reduced size. Moreover, the specific optical properties of PDMS, such as its high transparency to UV radiation with a good transmittance in the UV-C band (above 240 nm) [27], allow for a major exposure of the incorporated filler during irradiation. Prior to testing the UV sensitivity of the PDMS-based nanocomposites with GNP-DNA filler, their curing reactions were fully investigated, and results are reported in Chapter 5. Starting from differential scanning calorimetry (DSC) measurements, the curing kinetics of different PDMS-based blends were examined, in order to add valuable information for the materials processing and highlights possible limitations due to the presence of the filler.
In the following experimental phase, the fabrication process of the GNP-DNA/PDMS films was optimized by the use of a suitable solvent, in order to reach a good level of dispersion of the filler into the PDMS matrix. The properties of these films were investigated before and after exposure to UV-C radiation, and the effect of different amounts of filler evaluated. Procedures and results are summarized and discussed in Chapter 6.
Finally, Chapter 7 describes the realization of GNP-DNA/PDMS nanocomposites with increased thickness and their testing as free-standing 3D materials in simulated space environment. The properties of the nanocomposites, in particular their surface morphology and electrical conductivity, were examined before and after tests performed in a thermal vacuum-chamber, under simulated solar irradiation. The sensitivity to solar radiation was also evaluated for the GNP/PDMS nanocomposites without the DNA element in order to compare their response to that of the samples containing the UV sensitive GNP-DNA filler.
Towards a bio-inspired sensing of UV radiation effects
5
1.3 References
[1] W. Harm, Biological effects of ultraviolet radiation, Cambridge University Press Cambridge1980.
[2] W.H. Organization, IARC monograph on the evaluation of carcinogenic risks to humans, Human Papillomaviruses, (2000).
[3] A.L. Andrady, S. Hamid, X. Hu, et al., Effects of increased solar ultraviolet radiation on materials, Journal of Photochemistry and Photobiology B: Biology, 46 (1998) 96-103. [4] A. Andrady, H. Hamid, A. Torikai, Effects of solar UV and climate change on materials, Photochemical & Photobiological Sciences, 10 (2011) 292-300.
[5] T. Schwarz, Mechanisms of UV-induced immunosuppression, The Keio Journal of Medicine, 54 (2005) 165-171.
[6] R.P. Rastogi, A. Kumar, M.B. Tyagi, et al., Molecular mechanisms of ultraviolet radiation-induced DNA damage and repair, Journal of Nucleic Acids, 2010 (2010). [7] C.-H. Lee, S.-B. Wu, C.-H. Hong, et al., Molecular mechanisms of UV-induced apoptosis and its effects on skin residential cells: the implication in UV-based phototherapy, International Journal of Molecular Sciences, 14 (2013) 6414-6435.
[8] H. Nakazawa, D. English, P.L. Randell, et al., UV and skin cancer: specific p53 gene mutation in normal skin as a biologically relevant exposure measurement, Proceedings of the National Academy of Sciences, 91 (1994) 360-364.
[9] J.H. Miller, Mutagenic specificity of ultraviolet light, Journal of Molecular Biology, 182 (1985) 45-65.
[10] G.P. Pfeifer, Y.-H. You, A. Besaratinia, Mutations induced by ultraviolet light, Mutation Research/Fundamental and Molecular Mechanisms of Mutagenesis, 571 (2005) 19-31.
[11] S. Tornaletti, G.P. Pfeifer, Slow repair of pyrimidine dimers at p53 mutation hotspots in skin cancer, Science, 263 (1994) 1436-1438.
[12] S.J. Kuerbitz, B.S. Plunkett, W.V. Walsh, et al., Wild-type p53 is a cell cycle checkpoint determinant following irradiation, Proceedings of the National Academy of Sciences, 89 (1992) 7491-7495.
[13] G. Horneck, P. Rettberg, E. Rabbow, et al., Biological dosimetry of solar radiation for different simulated ozone column thicknesses, Journal of Photochemistry and Photobiology B: Biology, 32 (1996) 189-196.
Chapter 1
6
[14] P. Rettberg, C.S. Cockell, Biological UV dosimetry using the DLR-biofilm, Photochemical & Photobiological Sciences, 3 (2004) 781-787.
[15] A.P. Schuch, R. da Silva Galhardo, K.M. de Lima-Bessa, et al., Development of a DNA-dosimeter system for monitoring the effects of solar-ultraviolet radiation, Photochemical & Photobiological Sciences, 8 (2009) 111-120.
[16] S.W. Wilhelm, W.H. Jeffrey, C.A. Suttle, et al., Estimation of Biologically Damaging UV Levels in Marine Surface Waters with DNA and Viral Dosimeters, Photochemistry and Photobiology, 76 (2002) 268-273.
[17] H. Yoshida, J.D. Regan, UVB DNA dosimeters analyzed by polymerase chain reactions, Photochemistry and Photobiology, 66 (1997) 82-88.
[18] H. Song, L. Zhang, C. He, et al., Graphene sheets decorated with SnO2 nanoparticles: in situ synthesis and highly efficient materials for cataluminescence gas sensors, Journal of Materials Chemistry, 21 (2011) 5972-5977.
[19] S.K. Hazra, S. Basu, Graphene-oxide nano composites for chemical sensor applications, C—Journal of Carbon Research, 2 (2016) 12.
[20] W. Zhang, J. Suhr, N. Koratkar, Carbon nanotube/polycarbonate composites as multifunctional strain sensors, Journal of Nanoscience and Nanotechnology, 6 (2006) 960-964.
[21] X. Zou, S. Wei, J. Jasensky, et al., Molecular interactions between graphene and biological molecules, Journal of the American Chemical Society, 139 (2017) 1928-1936. [22] D. Li, W. Zhang, X. Yu, et al., When biomolecules meet graphene: From molecular level interactions to material design and applications, Nanoscale, 8 (2016) 19491-19509. [23] A.J. Patil, J.L. Vickery, T.B. Scott, et al., Aqueous stabilization and self‐assembly of graphene sheets into layered bio‐nanocomposites using DNA, Advanced Materials, 21 (2009) 3159-3164.
[24] M. Martins, R. Gomes, L. Pina, et al., Highly Conductive Carbon Fiber-Reinforced Polymer Composite Electronic Box: Out-of-Autoclave Manufacturing for Space Applications, Fibers, 6 (2018) 92.
[25] A. Francesconi, C. Giacomuzzo, S. Kibe, et al., Effects of high-speed impacts on CFRP plates for space applications, Advances in Space Research, 50 (2012) 539-548.
Towards a bio-inspired sensing of UV radiation effects
7 [26] A.A. Abusafieh, D.R. Federico, S.J. Connell, et al., Dimensional stability of CFRP composites for space-based reflectors, Optomechanical Design and Engineering 2001, International Society for Optics and Photonics, 2001, pp. 9-16.
[27] M.D. Borysiak, K.S. Bielawski, N.J. Sniadecki, et al., Simple replica micromolding of biocompatible styrenic elastomers, Lab on a Chip, 13 (2013) 2773-2784.
Chapter 1
9
Chapter 2
Composite materials: properties and applications in
perspective of UV radiation sensing
2.1 Introduction to composite materials
In the last years, composite materials have been used in increasingly different fields due to their versatility and capability to be endowed with characteristic properties for a specific application. Their development has been promoted prevalently by the possibility to customize their properties depending on the environment of use and the required performances.Advances in leading technological areas, such as aerospace and biomedicine, have required enhanced properties not found in commonly used materials, such as metal alloys, ceramics and polymers. These needs have stimulated an increasing interest towards the engineering of composite materials with properties more and more corresponding to the expectations, leading to the concept of advanced materials [1]. This concept presupposes a high level of interaction between the identified materials and the specific environment of application, and typically it can be realized involving multiple phases in the composite arrangement, each contributing with different chemical, physical, mechanical and sometimes biological properties.
Composite materials base their nature on the combination of a matrix, typically made of a polymer, metal or ceramic, with one or more materials used as filler. The starting systems are opportunely mixed obtaining a material with more useful structural or functional properties, which are not shown by the components if considered singularly. As reported by Wang et al. [2], composites, according to their definition, should show the following characteristics:
- microscopically, a distinct interface between the components - single components with sufficiently different properties
Chapter 2
10
In particular, the interface separating the different phases shows properties able to influence significantly the composite performances [3], especially their mechanical behavior [4-7]. These properties are mainly determined by the chemical/morphological nature and physical/thermodynamic compatibility between the constituents, influencing in particular toughness in transverse and interlaminar fractures [8, 9]. Therefore, the design and development of composites need to take into account the specific interactions at the interface, in order to assure an efficient stress transfer and a good damage tolerance [10].
Composites can be grouped in three main categories based on the nature of the matrix:
1. Polymer matrix composites (PMCs): they are developed employing thermoset plastics, such as nylon, polyethylene, polypropylene, or thermoplastics, such as epoxy, polyester, or phenolic resins. These matrices are typically filled with materials that are able to enhance their mechanical properties, so the resulting composites exhibit high strength and stiffness-to-weight ratio.
2. Metal matrix composites (MMCs): they are realized using a metal matrix reinforced with fillers able to confer stiffness and strength, resulting in superior performances at high temperatures if compared with PMCs. For MMCs, the matrices are generally made of: aluminum, magnesium, titanium, iron, copper, nickel. This category of composites is characterized by high strength, high stiffness, abrasion resistance, dimensional stability and toughness.
3. Ceramic matrix composites (CMCs): ceramic matrices, such as alumina, silicon carbide and silicon nitride, are employed and generally reinforced with continuous ceramic fibers. They are developed with the main aim to overcome the brittleness of the monolithic ceramics, obtaining tough materials, with a high strain to failure. Differently from PMCs or MMCs, the failure strain of the matrix is lower than the failure strain of the fibers, so they are also known as “inverse composites” [11]. Polymer-matrix composites are widely used for their room-temperature properties, good processability and reasonable production costs. In particular, the most employed and least expensive polymer resins are polyesters and vinyl esters, which are mainly used when glass fibers are selected as filler [12, 13]. Conversely, epoxies represent a more expensive choice, but largely used for applications requiring high moisture resistance or enhanced
Composite materials: properties and applications in perspective of UV radiation sensing
11 mechanical properties, such as in the aerospace sector [14]. Moreover, a comparison among thermoplastic and thermoset composites can be made, taking into account some of the most relevant aspects. In particular, several thermoplastics exhibit properties that make them suitable for advanced applications, such as poly(ether ether ketone) (PEEK) and poly(phenylene sulfide) (PPS), with superior toughness and damage tolerance and, at the same time, they offer the potential for short processing times. Nevertheless, in the case of thermoplastics reinforced with continuous fibers, the thermoforming is complicated by the tendency of the fibers to wrinkle and buckle if not maintained under tension. For this reason, the use of continuous-fiber thermoplastic composites becomes advantageous in the case of a demand for a large quantity of parts, and when the process can be automated removing almost all manual operations. As a result, this type of composites is mainly employed in the automotive industry rather than in the aerospace field, where lot sizes are small and production rates cannot justify the investment for more automated equipment [15].
Depending on the type of filler selected, composites can be further classified into three main types: particle-reinforced, fiber-reinforced, and structural composites. Particle-reinforced materials can be further divided in large-particle and dispersion-strengthened composites. The first are characterized by particle–matrix interactions that cannot be treated at atomic or molecular level, and continuum mechanics is adopted. In this case, the system is generally composed by hard and stiff fillers that tend to restrain the movement of the matrix, which transfers a part of the applied stress to the particles [16]. The mechanical properties of this type of composites are strictly dependent on the volume fractions of the constituents and, in general, they can be enhanced by increasing the particles loading. Moreover, the size of the filler is approximately the same in all directions and higher than 0.1 mm. Cermets represent an example of large-particle reinforced composites, where strong and brittle ceramic particles are used as filler, with the effect to improve the toughness of a soft and ductile metal matrix. In particular, tungsten carbide or titanium carbide are typically dispersed in a matrix of cobalt or nickel. Differently, dispersion-strengthened composites involve smaller particles, with diameters between 0.01 and 0.1 mm, and they are characterized by particle–matrix interactions with strengthening at the atomic or molecular level [16]. In this type of system, the matrix typically bears the main load, whereas the particles hinder the motion of dislocations into
Chapter 2
12
the matrix. This limits plastic deformations, and the yield and tensile strengths have the effect of enhancing the particle-matrix interactions.
Fiber-reinforced composites exhibit properties strictly depending on the nature, geometry and dimension of the dispersed fibers. A schematic representation of fiber-based dispersed phases with different geometrical and spatial characteristics is shown in Figure 2.1. In the case of PMCs, the most used fibers are based on aramids, glass and carbon.
Aramid fibers are prevalently employed for ballistic products, sporting goods and as replacement for asbestos in automotive brake and clutch linings [17]. They are selected mainly for their outstanding strength-to weight ratios, which are superior to metals [18]. Further, these fibers show advantages such as toughness, impact resistance, resistance to creep and fatigue failure, with a thermal stability up to 500 °C [19]. Chemically, they are susceptible to degradation by strong acids and bases, showing a good grade of stability in other solvents [20]. Glass fibers are typically chosen for properties such as good chemical, biological and thermal resistance, thermal and electric insulation, low costs of fabrication [21]. Depending on the type of glass fiber, the properties of the resulting composites can differ particularly in terms of mechanical strength and thermal stability. For these reasons, S-glass fibers, that are known for their extreme temperature resistance, high strength and stiffness, and corrosive resistance, are generally employed in aerospace and aeronautic industries [22, 23], whereas the other types, in particular E-glass fibers, are mainly used for automotive and marine bodies, pipes, storage containers and industrial floorings. Carbon-fiber reinforced polymers (CFRPs) can be considered the materials prevalently selected for advanced technological applications, due to the high performances of the carbon-fibers. In fact, this type of fiber exhibits the highest specific modulus and strength if compared with the other types of reinforcement [24]. Moreover, at room temperature, they are not affected by moisture and by most solvents, acids and bases [25]. Characteristics such as high electrical and thermal conductivity, high mechanical strength, stiffness and low weight make them suitable for aerospace applications, but also for automotive, sports and recreational equipment [26-28].
Composite materials: properties and applications in perspective of UV radiation sensing
13 Figure 2.1. Schematic representation of composites with different geometrical and spatial characteristics of the dispersed phase: (a) concentration, (b) size, (c) shape, (d)
distribution, (e) orientation [29].
Structural composites are typically assembled starting from composite and homogeneous materials, with properties strictly related to the geometry of the structural elements. Laminar composites and sandwich panels are the main types of structural composites that are used. In particular, laminated composites can be obtained piling layers or lamina of unidirectional composite materials, and the properties can be varied not only with the type of piled materials, but also adopting different ways of piling the layers on top of each other. Sandwich composites are realized using external strong layers, the face sheets, attached to a layer of less dense material, the core, with low stiffness and low strength. For instance, in Figure 2.2, a schematic representation of the assembly of a honeycomb core sandwich panel is reported. The main role of the face sheets is to withstand most of the plane loads and transversal bending stresses, whereas the core separates both face sheets and resists deformations perpendicular to the face plane. Sandwich panels are used in a wide variety of applications including roofs, floors, walls of buildings, aerospace and aircraft [30, 31].
Chapter 2
14
Figure 2.2. Schematic representation of the assembly of a honeycomb core sandwich panel [32].
2.2 Nanocomposite materials
A promising type of composites base the enhancement of their properties on the dimensions of the interacting parts, particularly in the case of nanocomposites. These composite materials are characterized by at least one of the phases with dimensions in the nanometer range [33]. They have been developed taking into account the effective influence of the phases size on the overall performances. In fact, changes in particle properties can be observed when their size is less than a particular level, called critical size. Dimensions in the range of nanometers can favor an improvement of the interactions at the interfaces between the phases, inducing an enhancement of the overall materials properties [34]. In particular, the surface area-to-volume ratio of the reinforcements plays a crucial role on the nanocomposites performances.
In recent years, the research and development of nanofilled polymers have greatly increased due to the possibility to preserve the advantages offered by the resins, such as mechanical properties and processability, and, at the same time, enhancing their performances without affecting significantly the final weight. In fact, due to the nanoscale size of the reinforcing phase, the interface-to-volume ratio is higher than in conventional composites [35]. Therefore, the volume fraction of the second phase can be reduced, without inducing a degradation of the properties.
Nanoscale-filled polymer composites are characterized by fillers with at least one dimension <100 nm and can be grouped in three categories [36]:
Composite materials: properties and applications in perspective of UV radiation sensing
15 1. fiber or tube nanofillers, with a diameter and an aspect ratio of at least 100;
2. plate-like nanofillers, layered materials with a thickness of the order of 1 nm and an aspect ratio in the other two dimensions of at least 25;
3. three dimensional (3D) nanofillers, relatively equi-axed particles <100 nm in their largest dimension.
Nanometric dimensions and extreme aspect ratios of the tubes and plates used as filler determine peculiar properties, such as a low percolation threshold (0.1-2 vol%), a large number of particles per particle volume (106-108 particles/µm3), extensive interfacial area
per volume of particles (103-104 m2/mL) and short distances between particles (10-50 nm
at 1-8 vol%) [37].
Figure 2.3 offers a comparison between a macro-composite and a nanocomposite at the same volume fraction of filler, highlighting the dimensional differences at schematic level and by morphological investigations.
Figure 2.3. Schematic comparison between a macro-composite and a nanocomposite at the same volume fraction of filler. The interfacial region (in green) extends into the matrix on the order of Rg, the radius of gyration of the polymer. a) Scanning electron
micrograph shows E-glass reinforced polyolefin (15 μm fiber) and b) transmission electron micrograph shows montmorillonite-epoxy nanocomposite (1 nm thick layers)
Chapter 2
16
From the mechanical point of view, the main advantage offered by nanoparticles is that their size is smaller than the critical crack length that typically initiates failure in traditional composites [38]. As a result, nanoparticles can provide an improvement in terms of toughness and strength. Generally, nanocomposites also offer enhancements in terms of electrical conductivity due to a better compactness of the polymer, leading to a better coupling among the nanoparticles through the grain boundaries [35]. Moreover, the use of active optical nanofillers, such as gold and silver nanoparticles, can allow to opportunely modulate the overall optical properties of the resulting nanocomposites, depending on the size, distribution and shape of the particles [39-41]. Transparent nanocomposites with enhanced mechanical and electrical properties have been developed, using nanofillers to regulate the index of refraction [42, 43]. In this case, the desired grade of transparency can be achieved by opportunely modulating the volume fraction of the nanoparticles.
A crucial aspect concerning nanocomposites regards the improvement of the nanofiller dispersion. This represents a not trivial task, and is a fundamental requirement in order to ensure homogeneous properties of the nanocomposites and to prevent losses in terms of fracture toughness typically due to nanofiller agglomeration [44-46].
2.2.1 Graphene-based nanocomposites: properties and fabrication
Graphene represents one of the most attractive materials currently employed to develop functional nanocomposites. It is one of the allotropes of carbon and is composed by a one-atom-thick planar sheets of sp2 bonded carbon atoms that are densely packed in
a honeycomb crystal lattice. This 2D structure can be wrapped up into 0D fullerenes, rolled into 1D nanotubes or stacked into 3D graphite, as shown in Figure 2.4 [47]. The exceptional properties shown by graphene justify its increasing use as functional filler, especially for polymer matrix-based nanocomposites. In particular, it possesses peculiar electrical characteristics, such as an anomalous quantum hall effect and a high electron mobility at room temperature (23 x 104 cm2/Vs) [48, 49], and shows excellent mechanical performances [50]. Specifically, its high tensile strength, elasticity, Young’s modulus (~1 TPa) and spring constant are mainly due to its hexagonal lattice structure, with the sp2 bonds that confer stability and oppose in-plane deformations [51]. In addition, graphene shows a high thermal conductivity (~4-5 x 10³ Wm-1K-1) [52], and its field of application
Composite materials: properties and applications in perspective of UV radiation sensing
17 is further extended by the possibility to functionalize it chemically. Several biological applications involving graphene highlighted its biocompatibility [53-56], even though this aspect is currently the subject of extensive investigations due to the possible toxicity of nanomaterials.
Figure 2.4. Representation of 2D-structure of graphene that can be wrapped up into a) 0D fullerenes, rolled into b) 1D nanotubes or stacked into c) 3D graphite [57].
Different approaches are currently used for the synthesis of graphene. These can be grouped in two main categories that are referred to as bottom-up and top-down methods. The bottom-up approaches allow, typically, a small-scale production, characterized by high quality and large size sheets, starting from compounds comprising carbon. These methods include techniques such as carbon vapor deposition (CVD), arc discharge, epitaxial growth on silicon carbide, self-assembly, and reduction of CO2 [58], and allow
to produce both monolayer and multiple-layer graphene. Conversely, the top-down methods allow a large-scale production of graphene with small size, pure or opportunely functionalized. Therefore, this approach is particularly suitable to synthetize graphene to be used as filler in polymer nanocomposites. It involves the separation of graphene
Chapter 2
18
directly from graphite or graphite derivative, and includes several methods such as the exfoliation or super acid dissolution of graphite, the solvothermal reduction or chemical reduction of graphite oxide, and thermal exfoliation/reduction of graphite oxide.
In general, the commonly referred “graphite oxide” (GO) is made of graphene oxide sheets, stacked with an interlayer spacing between 6 and 10 Å depending on the water content [59]. According to the Lerf-Klinowski model [60-62], graphene oxide can be described as pristine aromatic “islands” separated from each other by aliphatic regions, containing epoxide and hydroxyl groups and carbon-carbon double bonds. Typically, hydroxyl and epoxy groups can be detected at higher concentrations on the basal plane of graphene oxide, whereas carbonyl and carboxylate acid groups at the sheet edges [62]. A representation of graphene, graphene oxide, and reduced graphene oxide structures is shown in Figure 2.5a.
The thermal exfoliation of GO allows to separate the graphene oxide sheets and reduce the oxygen content, generally leading to restore the attitude to conduct electricity [63]. In particular, GO can be reduced and exfoliated simultaneously upon a rapid heating, that induces the thermal decomposition of the oxygen-containing functional groups with the pressure of the gas products, in particular CO2, that builds up instantaneously between
the sheets [63-65]. The obtained graphene can be dispersed in polar organic solvents due to the polar oxygen-containing functional groups remained on it and to its wrinkled nature preventing the sheets from restacking [63, 64, 66]. The oxygen-to-carbon element ratio and the electrical conductivity of the resulting graphene can be modulated depending on the time and temperature adopted during the process [67]. For instance, high quality graphene with less structural and topological defects was obtained at lower process temperatures, under vacuum, or in presence of accelerating agent, such as H2 or HCl, or
with microwave or irradiation assistance [68, 69]. Figure 2.5b shows the possible steps leading from graphite to reduced graphene oxide during synthesis.
Composite materials: properties and applications in perspective of UV radiation sensing
19 Figure 2.5. a) Representation of graphene, graphene oxide, and reduced graphene oxide structures; b) Schematic steps from graphite to reduced graphene oxide [70].
The chemical functionalization of graphene represents a valid aim approach in the perspective to improve the interaction between the filler and the polymer matrix, further increasing the solubility of the reinforcement [71-74]. The process involves functional groups that can be small molecules [75] or polymer chains [76], and both covalent and non-covalent functionalization can be carried out [77]. In particular, covalent functionalization can be performed at the end of the graphene sheets or on their surface and involves a rehybridization of one or more sp2 carbon atoms into the sp3 configuration by means of the mechanisms of nucleophilic substitution, electrophilic addition, condensation or addition [78]. Concerning the non-covalent functionalization, it allows the connection between the molecules without involving chemical bonds and, generally, requires the physical adsorption of suitable molecules on the graphene surface [79]. Specifically, these molecules wrap around graphene by means of van der Waals forces and can involve π–π interactions, electrostatic attraction, adsorption of surfactants and polymer wrapping [80-83].
After selection of the desired polymer and graphene nanofiller, taking into account their starting properties and the possibilities to maximize and optimize their interaction, three different methods can be commonly used to fabricate the related nanocomposites:
Chapter 2
20
solution blending, in-situ polymerization and melt-mixing. In particular, solution blending, which can be considered the most known technique, involves the polymer solubilization in a suitable solvent and the mixing with graphene to form a dispersion. Generally, polymers such as polystyrene, polycarbonate, polyacrylamide, polyimides and poly(methyl methacrylate) are mixed with graphene oxide [84-87], that can be previously functionalized with isocyanates, alkylamine or alkyl-chlorosilanes in order to improve its dispersibility in organic solvents.
In-situ polymerization is based on the polymerization of the matrix in presence of the selected filler, starting from the monomer mixed with the reinforcement. Typically, this approach allows to obtain a good grade of dispersion of graphene-based nanofillers avoiding their previous exfoliation. Concerning melt mixing technique, it allows to disperse the filler in the polymer matrix exploiting high temperatures and shear forces. In particular, the high temperature liquefies the polymer phase facilitating the dispersion or intercalation of graphene oxide nanoplatelets avoiding the use of toxic solvents.
After fabrication, the properties of the resulting nanocomposites can be further related to interfacial adhesion, spatial distribution and alignment of the graphene nanofiller. In particular, polymer nanocomposites with low loadings of functionalized graphene sheets generally exhibit a shift in the glass transition temperature [84], if compared with the value of the uncharged polymer. This behavior can be ascribed to a reduced mobility of the polymer chains at the interfaces between the filler and the matrix [88, 89]. Therefore, the effect of constraint applied on the chains can directly induce an increase in glass transition temperature.
Performances in terms of thermal conductivity can be evaluated referring to the 2D geometry of the graphene fillers. They are characterized by a lower interfacial thermal resistance that provides a higher thermal conductivity to the host polymer matrix. Nevertheless, the 2D structure can be source of anisotropy in the nanocomposites arrangement, for which thermal conductivity in plane results as much as ten times higher than the cross-plane conductivity [90]. It is typically evaluated following the percolation theory, therefore considering phonons as the main mode for thermal conduction in polymers. Covalent bonding between filler and matrix can reduce phonon scattering at the interfaces leading to an overall enhancement of the thermal conductivity [91].
Composite materials: properties and applications in perspective of UV radiation sensing
21 The behavior of nanocomposites in terms of electrical conductivity can be assessed considering the influence of different factors and their overall effect. In particular, the characteristics of the specific graphene-based filler, such as its aspect ratio and morphology, as well as its inter-sheet junction, can affect the electrical performances. In the same way, processing and dispersion, and the related state of aggregation and alignment of the nanoparticles concur to determine the electrical behavior of the resulting nanocomposites. Several theoretical models and experiments have focused, in particular, to effectively relate the effect of filler shape, geometry and state of dispersion to the percolation threshold [92, 93].
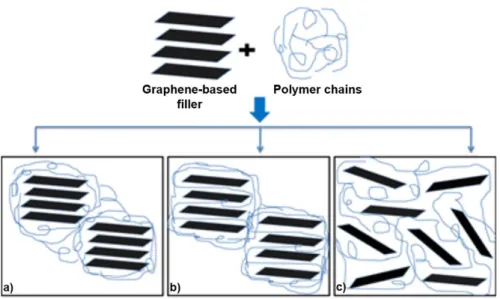
As mentioned above, the overall performance of nanocomposite materials can be related to the quality and stability of the polymer/filler interphase region. Typically, physical and mechanical properties and chemical composition of this region are different from the bulk polymer matrix [94, 95]. In the case of an interphase stiffer than the surrounding polymer, this can result in higher overall stiffness and strength of the composite, but with lower resistance to fracture [96]. The interphase properties can interfere with the mechanical behavior of the nanocomposites also depending on their morphology and size, therefore its thickness can be tailored with the aim to achieve both higher strength and improved toughness of the resulting nanocomposites. Generally, force modulation AFM and nanoindentation are used to investigate the interphase and its properties [94, 97]. In particular, AFM phase imaging is currently considered a useful tool to evaluate the thickness and the relative stiffness of the interphase, since it involves much lower interaction forces between the probe and the sample than force modulation or nanoindentation [96]. The arrangement of graphene-based fillers inside the matrix is also investigated in order to assess the state of dispersion at the microstructural level and its impact on the nanocomposites properties. Results reveal that graphene-based fillers, such as graphene oxide or graphene nanoplatelets (GNPs), can arrange differently in the host polymer, originating structural states that can be classified as stacked, intercalated or exfoliated, as shown in Figure 2.6.
Chapter 2
22
Figure 2.6. Schematic representation of different filler arrangements in graphene-based nanocomposites: a) separated, b) intercalated and c) exfoliated state. Adapted from Ref.
[98].
The intercalated state can be considered a particular stacked structure characterized by a greater interlayer spacing, but within a few nanometers [99]. Generally, in the exfoliated structure, GNPs have the largest interfacial contact with the polymer matrix, and this allows to improve the performances of the composites in different ways. Due to the interactions with the matrix, the exfoliated phase can exhibit a curved shape. In this case, the rumpled shape assumed by the filler can result in a mechanical interlocking that represents a possible mechanism of strengthening. Therefore, the compatibility between the host polymer and the nanoplatelets is one of the factors that influence the filler arrangement encouraging it to adopt a more extended conformation in case of affinity or, conversely, a crumpled conformation when the affinity decreases [100]. Further, the technique used to fabricate the nanocomposites can affect the microstructure, as well as the characteristics of the filler prior to the process. Solution mixing or in-situ polymerization generally induce an exfoliated and randomly oriented status of the nanoplatelets, whereas the melt mixing technique originates a more oriented and intercalated or stacked structure [101].
Composite materials: properties and applications in perspective of UV radiation sensing
23
2.3 Applications of composite materials in sensing devices
The enhanced properties of composite and nanocomposite materials and the possibility to tailor their performances towards more and more specific applications make them suitable materials for sensing. In this perspective, the ability to detect an external stimulus, having a chemical, physical or biological nature, and give information about it can be developed through an accurate selection and a successive engineering of the starting materials.
Graphene is one of the most promising materials for sensing applications, and its properties are widely employed singularly or functionally combined with other suitable materials. Metal oxide nanoparticles, for instance, are usually coupled with graphene (Figure 2.7a), graphene oxide or reduced graphene oxide for large-scale production of sensing devices in different fields, from environmental pollutions, safety and security to clinical and pharmacological detections. Another effective fusion has been realized coupling graphene and biological molecules, which results in hybrid nanomaterials with enhanced and functional properties that can be wisely employed for sensing applications [102, 103]. Figure 2.7b summarizes the main biomolecules that are typically combined with graphene and the possible interactions (covalent, electrostatic) between them.
Figure 2.7. a) Representation of graphene sheets decorated with metal oxide nanoparticles acting for pollutants detection [104]; b) Schematic representation of
graphene coupled with biological molecules through different types of interaction [102].
Chapter 2
24
For instance, DNA molecules can be effectively immobilized onto graphene surface by physical adsorption or chemical binding, creating sensitive platforms where each binding event with the analyte can be detected through the changes of the electric or electrochemical properties of these platforms [105]. Noncovalent interactions can be promoted through the physical adsorption, involving π-π stacking interactions between the DNA nucleobases and the aromatic surface of graphene. In particular, in the case of single-stranded DNA (ssDNA), stable aqueous dispersions of graphene/DNA can be obtained, without traces of sedimentation for months [106]. Double-stranded DNA (dsDNA) is also used as dispersing agent for graphene nanoplatelets. However, in this case less stable aqueous solutions are obtained due to the weaker hydrophobic interactions arising from the base pairing of the nucleobases. Nevertheless, the graphene/dsDNA affinity can be significantly enhanced by further functionalizing graphene oxide with polar groups, which are able to establish electrostatic interactions with the DNA bases. The immobilization of DNA onto graphene through covalent bonds is generally carried out after functionalizing DNA with an amino group, which is able to interact with the graphene oxide surface via carbodiimide chemistry. In particular, amine-terminated ssDNA can be linked to the surface of graphene oxide directly or through the involvement of specific molecules that act as carriers. Zhang et al. developed a sensing surface based on graphene/DNA, where dopamine molecules were used for the reduction of graphene oxide and as carriers to link ssDNA that was previously treated with an alkylamino modifier. This graphene/DNA assembly was employed as a rapid and low-cost detection platform for mercury ions (Hg2+), showing a detection limit of 5.0 × 10⁻⁹ M [107].
Graphene nanocomposites decorated with metals or metal oxides are widely used as gas sensors, such as in the case of copper oxide (Cu2O) and zinc oxide (ZnO),
respectively employed for detecting nitrogen dioxide (NO2) and carbon monoxide (CO)
[108, 109]. Graphene oxide and reduced graphene oxide can trap gas molecules causing a variation in the conducting properties, with a different effect promoted by oxidizing and reducing gases, which induce carrier generation or carrier annihilation, leading to a change in the device resistance or current. The cumulative contributions from metals and graphene oxide can enhance the response of the sensing nanocomposite, whereas the choice of the specific metal can be performed evaluating the best solid-gas interactions, depending on the nature of the analyte. In particular, palladium exhibits a significant
![Figure 2.2. Schematic representation of the assembly of a honeycomb core sandwich panel [32]](https://thumb-eu.123doks.com/thumbv2/123dokorg/2886957.10974/34.892.185.717.123.351/figure-schematic-representation-assembly-honeycomb-core-sandwich-panel.webp)
![Figure 2.4. Representation of 2D-structure of graphene that can be wrapped up into a) 0D fullerenes, rolled into b) 1D nanotubes or stacked into c) 3D graphite [57]](https://thumb-eu.123doks.com/thumbv2/123dokorg/2886957.10974/37.892.212.699.278.706/figure-representation-structure-graphene-wrapped-fullerenes-nanotubes-graphite.webp)
![Figure 2.7. a) Representation of graphene sheets decorated with metal oxide nanoparticles acting for pollutants detection [104]; b) Schematic representation of](https://thumb-eu.123doks.com/thumbv2/123dokorg/2886957.10974/43.892.140.766.710.950/representation-graphene-decorated-nanoparticles-pollutants-detection-schematic-representation.webp)
![Figure 2.9. a) Schematic representation of a photodetector based on a composite structure of gold nanoparticles embedded into silicon pores [127]; b) Schematic representation of sensing composite arrays based on silver nanoparticles onto zinc](https://thumb-eu.123doks.com/thumbv2/123dokorg/2886957.10974/48.892.146.783.258.475/schematic-representation-photodetector-nanoparticles-schematic-representation-composite-nanoparticles.webp)
![Figure 2.10. UV spectral irradiance at the top of the atmosphere (black line) and at the Earth’s surface (red line) for clear sky conditions [152]](https://thumb-eu.123doks.com/thumbv2/123dokorg/2886957.10974/51.892.135.767.294.490/figure-spectral-irradiance-atmosphere-black-earth-surface-conditions.webp)
![Figure 2.11. a) Earth’s atmospheric components and pressure at different altitudes [162]; b) Characteristics of Mars atmosphere at different altitudes and temperature](https://thumb-eu.123doks.com/thumbv2/123dokorg/2886957.10974/53.892.134.772.255.634/atmospheric-components-different-altitudes-characteristics-atmosphere-different-temperature.webp)
![Figure 2.14. Representation of skin structure and depth of UV penetration at different radiation wavelengths [200]](https://thumb-eu.123doks.com/thumbv2/123dokorg/2886957.10974/58.892.150.740.447.832/figure-representation-structure-depth-penetration-different-radiation-wavelengths.webp)