https://doi.org/10.1038/s41409-019-0693-z
A R T I C L E
Analysis of data collected in the European Society for Blood and
Marrow Transplantation (EBMT) Registry on a cohort of lymphoma
patients receiving plerixafor
Anna Sureda1●Christian Chabannon 2●Tamás Masszi3●David Pohlreich4●Christof Scheid5●
Catherine Thieblemont6●Björn E. Wahlin7●Ioanna Sakellari 8●Nigel Russell9●Andrea Janikova10 ●
Anna Dabrowska-Iwanicka11●Cyrille Touzeau12●Albert Esquirol13●Esa Jantunen14 ●Steffie van der Werf15●
Paul Bosman15●Ariane Boumendil16●Qianying Liu17 ●Marina Celanovic17●Silvia Montoto18●Peter Dreger19
Received: 14 February 2019 / Revised: 3 July 2019 / Accepted: 20 July 2019 / Published online: 30 September 2019 © The Author(s) 2019. This article is published with open access
Abstract
Plerixafor+ granulocyte-colony stimulating factor (G-CSF) is administered to patients with lymphoma who are poor mobilizers of hematopoietic stem cells (HSCs) in Europe. This international, multicenter, non-interventional registry study (NCT01362972) evaluated long-term follow-up of patients with lymphoma who received plerixafor for HSC mobilization versus other mobilization methods. Propensity score matching was conducted to balance baseline characteristics between comparison groups. The following mobilization regimens were compared: G-CSF+ plerixafor (G + P) versus G-CSF alone; G+ P versus G-CSF + chemotherapy (G + C); and G-CSF + plerixafor + chemotherapy (G + P + C) versus G + C. The primary outcomes were progression-free survival (PFS), overall survival (OS), and cumulative incidence of relapse (CIR). Overall, 313/3749 (8.3%) eligible patients were mobilized with plerixafor-containing regimens. After propensity score matching, 70 versus 36 patients were matched in the G+ P versus G-CSF alone cohort, 124 versus 124 in the G + P versus G+ C cohort, and 130 versus 130 in the G + P + C versus G + C cohort. For both PFS and OS, the upper bound of confidence interval for the hazard ratio was >1.3 for all comparisons, implying that non-inferiority was not demonstrated. No major differences in PFS, OS, and CIR were observed between the plerixafor and comparison groups.
* Anna Sureda
1 Institut Català d’Oncologia, Hospital Duran i Reynals, Barcelona, Spain
2 Institut Paoli-Calmettes, Marseille, France 3 Semmelweis University, Budapest, Hungary 4 Charles University Hospital, Prague, Czech Republic 5 University of Cologne, Cologne, Germany
6 APHP, Hôpital Saint-Louis, Service d’hémato-oncologie, Université Paris Diderot - and Université Sorbonne Paris Cité, Paris, France
7 Karolinska University Hospital, Stockholm, Sweden 8 George Papanicolaou General Hospital, Thessaloniki, Greece
9 Nottingham University Hospital, Nottingham, UK 10 University Hospital Brno, Brno, Czech Republic 11 Maria Sklodowska-Curie Institute-Oncology Center,
Warsaw, Poland
12 CHU Nantes, Nantes, France
13 Hospital de la Santa Creu Sant Pau, Barcelona, Spain 14 University of Eastern Finland and Kuopio University Hospital,
Kuopio, Finland
15 EBMT Data Office, Leiden, Netherlands 16 EBMT Statistical Unit, Paris, France 17 Sanofi Genzyme, Cambridge, MA, USA
18 St Bartholomew’s Hospital, Barts Health NHS Trust, London, UK 19 University of Heidelberg, Heidelberg, Germany
123456789
0();,:
123456789
Introduction
Lymphomas are the second most common indication for autologous hematopoietic stem cell (HSC) transplantation (HSCT). The most common method for mobilizing HSCs from the peripheral blood is treatment with granulocyte-colony stimulating factor (G-CSF) alone or combined with chemotherapy [1, 2]. However, a sizable minority of patients fail to mobilize sufficiently with G-CSF-based regimens [3,4].
Plerixafor has a mode of action different from other HSC mobilizing agents and acts by binding to chemokine (C-X-C motif) receptor 4 (CXCR4), preventing the binding of its ligand stromal cell-derived factor 1 (SDF-1, now C-X-C motif chemokine 12, CXCL12) and thereby inhibiting events downstream of CXCL12 including SDF-1-mediated G-protein activation, receptor internalization, calciumflux, and chemotaxis [5,6]. The CXCL12/CXCR4 interaction is an integral part of the mechanism of homing and retention of HSC in the bone marrow and inhibition of this interaction by plerixafor mobilizes HSCs from the bone marrow [7,8]. Unlike cytokines used for HSC mobilization (e.g., G-CSF), plerixafor is not a growth factor and does not cause cell proliferation or expansion. Therefore, the approved use for plerixafor is in combination with G-CSF [9,10].
As there is a theoretical risk of tumor cell mobilization with any stem cell mobilization method for HSCT, the European Medicines Agency requested a postapproval analysis of plerixafor to evaluate the possible long-term negative impact related to tumor cell mobilization.
The European Society for Blood and Marrow Trans-plantation (EBMT) database is run and accessed through a project manager internet server and is accessible to all EBMT registered centers. Our analysis of the EBMT reg-istry data for long-term clinical outcomes included progression-free survival (PFS), overall survival (OS), and cumulative incidence of relapse (CIR) in patients with lymphoma. Patients who received plerixafor for mobiliza-tion of HSCs were matched by propensity scoring with patients who received other standard mobilization methods. Only patients who had a subsequent HSCT were included in the study.
Methods
Study design
This was an international, multicenter, non-interventional registry study, with patient follow-up ranging from 3.5 to 7.5 years, which evaluated the outcomes for patients with lymphoma who received G-CSF+ plerixafor compared with other mobilization methods for HSC mobilization and
who received an autologous HSCT (ClinicalTrials.gov number NCT01362972). All patients ≥18 years from the EBMT registry, with a diagnosis of lymphoma who were considered poor mobilizers and had undergone their first autologous HSCT between 2008 and 2012, were considered eligible for the study. Patients in the plerixafor groups who were poor mobilizers were those treated according to the label. Patients enrolled in the registry and evaluated in this study were from Austria, Belgium, Bulgaria, Czech Republic, Finland, France, Germany, Greece, Hungary, Ireland, Israel, Italy, Netherlands, Poland, Romania, Spain, Sweden, Switzerland, and the United Kingdom.
The study was conducted in accordance with the Declaration of Helsinki and the International Conference on Harmonization Guidelines for Good Clinical Practice. Approval of the protocol was obtained from all participating sites, local governmental authorities, and Institutional Review Boards. This was a non-inferiority study, with a non-inferiority margin of a 30% increase in PFS and OS corresponding to a hazard ratio (HR) upper bound of 1.3; no lower limit was set.
Poor mobilizers
Predicted poor mobilizers were defined as patients who had received prior irradiation to marrow bearing areas or had high exposure to marrow-damaging chemotherapy. Proven poor mobilizers were defined as patients who in a previous mobilization attempt failed to mobilize sufficient CD34+ cells in peripheral blood to proceed to apheresis or to pro-ceed to transplantation, or who, in the current mobilization, failed to achieve a sufficient increase in peripheral blood CD34+ cells at the predicted time for peak mobilization [11]. In this study, only poor mobilizers (either predicted or proven) have been considered in the propensity score matching and analyses.
Data collection
The data were entered, managed, and maintained centrally in an internet accessible database. Variables present on the EBMT Minimum Essential Data A and B forms were used to derive the data for the study and Medical C form was used to obtain plerixafor data.
Outcomes
The primary efficacy outcomes were OS, PFS, and CIR. Secondary efficacy outcomes were hematological recovery (time to achieve absolute neutrophil counts of≥0.5 × 10⁹/L and platelet counts of ≥50 × 109/L). All transplant compli-cations occurring within 100 days of transplantation were recorded.
The following mobilization regimens were assessed:
● G-CSF+ plerixafor versus G-CSF alone;
● G-CSF+ plerixafor versus G-CSF + chemotherapy; ● G-CSF+ plerixafor + chemotherapy versus G-CSF +
chemotherapy.
Graft failure was defined as: (1) the loss of the graft with neutrophils reaching ≥ 0.5 × 10⁹ cells/L but subsequently decreasing to a lower level of cells until additional treatment for engraftment was provided, or (2) no engraftment, where neutrophils never reached≥0.5 × 10⁹cells/L.
Statistical analyses
Due to the observational nature of the study, no formal statistical hypothesis testing was planned with adequate power or Type 1 error control.
Propensity score method was used to identify study com-parison groups that were balanced with respect to baseline characteristics, including, demographics, lymphoma type, disease characteristics and staging, prior treatment character-istics, and disease status [12]. The baseline variables and patient demographics used for propensity score matching are shown in Table 1. Only patients who were identified as a “proven or predicted poor mobilizer” were included in the analysis.
A single imputation approach was implemented to create complete data sets for analyses. Propensity scores were then fit using logistic regression models. Matches for plerixafor patients were identified from the non-plerixafor groups based on the estimated propensity scores. Matching was performed without replacement. Model success was based on whether balance between the plerixafor and the control groups matched samples was achieved.
Following the propensity score analysis, the outcomes for each mobilization treatment group were analyzed for comparable groups. Cox proportional hazards model with covariates was used for OS and PFS. The 95% confidence intervals (CI) and HR for the effect of treatment were cal-culated. Potential covariates included: interval from diag-nosis to transplantation, disease status at conditioning and conditioning regimen, and disease status at time of transplantation.
Survival curves were developed for each treatment group using nonparametric Kaplan–Meier estimates [13], as well as survival rates at 6 months, and at 1, 2, 3, 4, and 5 years.
A competing risk model was developed for CIR; death without prior progression/relapse was treated as a compet-ing event. The 95% CI and cumulative incidence at each year post transplantation were estimated.
Sample size was estimated using the following assumptions: 15% of transplanted lymphoma patients would receive CSF alone and 85% would receive G-CSF+ chemotherapy; 10% of patients transplanted from each regimen would receive plerixafor treatment; and 70% of patients receiving plerixafor would be matched at a ratio of 1:2 plerixafor to comparator.
Results
Participants and demographics
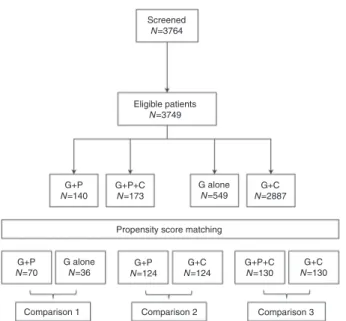
Overall, 3764 patients were screened and 3749 were eligible to be included in the study (Fig. 1). These included 140 patients treated with G-CSF+ plerixafor, 173 patients treated with G-CSF+ chemotherapy + plerixafor, 549 patients treated with G-CSF alone, and 2887 patients treated with G-CSF+ chemotherapy. The propensity score matching of predicted and proven poor mobilizers identified matched groups for the comparative analysis (Table 1). The number of patients classified as predicted or proven poor mobilizers was 136 treated with G-CSF+ plerixafor, 173 treated with G-CSF + che-motherapy+ plerixafor, 54 treated with G-CSF alone, and 245 treated with G-CSF+ chemotherapy.
After propensity scoring, 70 patients in the G-CSF+ plerixafor were matched with 36 patients in the G-CSF alone cohort, 124 matched with 124 in the G-CSF+ plerixafor versus G-CSF+ chemotherapy cohort, and 130 matched with 130 in the G-CSF+ plerixafor + chemotherapy versus G-CSF+ chemotherapy cohort. Disease history and baseline demographics of the patients are shown in Table1.
The proportion of patients who were proven poor mobilizers was greater in the plerixafor cohorts (ranging from 97.1 to 98.4%) compared with the comparator cohorts (ranging from 68.3 to 75.0%). More patients in the plerix-afor groups failed to mobilize sufficient CD34+ cells at the predicted peak mobilization time compared with patients in the comparator groups (Table 2).
Primary outcomes
Progression-free survivalThe estimated PFS at 3 years are shown in Table3and were similar between comparison groups. The Kaplan–Meier estimates for PFS were also similar for all the comparisons, G-CSF+ plerixafor versus G-CSF alone (Fig.2a), G-CSF+ plerixafor versus G-CSF+ chemotherapy (Fig. 2b), and G-CSF+ plerixafor + chemotherapy versus G-CSF + che-motherapy (Fig.2c).
Table 1 Patient demographics in the matched comparison groups used for propensity score matching Comparison 1 Comparison 2 Comparison 3 G-CSF + plerixafor (N = 70) G-CSF alone (N = 36) G-CSF + plerixafor (N = 124) G-CSF + chemotherapy (N = 124) G-CSF + plerixafor + chemotherapy (N = 130) G-CSF + chemotherapy (N = 130) Age at fi rst mobilization, mean ± SD, years (N = 65) (N = 32) (N = 117) (N = 107) (N = 130) (N = 115) 51.4 ± 13.5 51.2 ± 15.8 52.5 ± 12.6 51.5 ± 12.8 52.6 ± 13.6 52.3 ± 12.3 Females, n (%) 33 (47.1) 15 (41.7) 56 (45.2) 47 (37.9) 51 (39.2) 54 (41.5) Bone marrow involvement at the start of mobilization, n/ N (%) 2/66 (3.0) 2/33 (6.1) 8/104 (7.7) 4/102 (3.9) 8/112 (7.1) 4/105 (3.8) Status of disease at collection, n (%) N = 67 N = 34 N = 113 N = 108 N = 117 N = 115 Complete response 1 o r partial response 1 or very good partial response 42 (62.7) 23 (67.6) 61 (54.0) 57 (52.8) 63 (53.8) 58 (50.4) Refractory disease 2 (3.0) 1 (2.9) 14 (12.4) 9 (8.3) 15 (12.8) 12 (10.4) Sensitive disease, complete response >1, partial response >1 23 (34.3) 10 (29.4) 38 (33.6) 42 (38.9) 39 (33.3) 45 (39.1) Ann Arbor stage at diagnosis, n (%) N = 65 N = 35 N = 111 N = 111 N = 112 N = 117 I 5 (7.7) 5 (14.3) 8 (7.2) 9 (8.1) 5 (4.5) 6 (5.1) II 10 (15.4) 4 (11.4) 23 (20.7) 24 (21.6) 24 (21.4) 23 (19.7) III 13 (20.0) 5 (14.3) 22 (19.8) 21 (18.9) 23 (20.5) 26 (22.2) IV 37 (56.9) 21 (60.0) 58 (52.3) 57 (51.4) 60 (53.6) 62 (53.0) Interval between diagnosis and fi rst collection, mean ± SD, months N = 65 N = 32 N = 117 N = 107 N = 130 N = 115 Year of fi rst transplant 18.9 ± 20.2 16.3 ± 20.6 32.5 ± 48.1 30.6 ± 45.3 23.6 ± 28.7 23.7 ± 28.4 2009 20 (28.6) 12 (33.3) 32 (25.8) 39 (31.5) 21 (16.2) 34 (26.2) 2010 23 (32.9) 13 (36.1) 31 (25.0) 35 (28.2) 44 (33.8) 48 (36.9) 2011 16 (22.9) 7 (19.4) 37 (29.8) 39 (31.5) 46 (35.4) 37 (28.5) 2012 11 (15.7) 4 (11.1) 24 (19.4) 11 (8.9) 19 (14.6) 11 (8.5) Geographic region, n (%) South and East Europe 28 (40.0) 18 (50.0) 52 (41.9) 42 (33.9) 43 (33.1) 41 (31.5) North and West Europe 42 (60.0) 18 (50.0) 72 (58.1) 82 (66.1) 87 (66.9) 89 (68.5) Lymphoma disease types, n (%) Hodgkin ’s lymphoma 13 (18.4) 8 (22.2) 22 (17.7) 26 (21.0) 21 (16.2) 24 (18.5) Aggressive B-cell lymphoma 24 (34.3) 12 (33.3) 43 (34.7) 44 (35.5) 56 (43.1) 52 (40.0) Indolent B-cell lymphoma 12 (17.1) 6 (16.7) 21 (16.9) 23 (18.5) 25 (19.2) 24 (18.5) Mantle cell lymphoma 20 (28.6) 9 (25.0) 26 (21.0) 19 (15.3) 13 (10.0) 14 (10.8) T-cell lymphoma 1 (1.4) 1 (2.8) 12 (9.7) 12 (9.7) 14 (10.8) 14 (10.8) Others a 0 0 0 0 1 (0.8) 2 (1.5) G-CSF granulocyte-colony stimulating factor, SD standard deviation a Not disclosed
Overall survival
Due to censoring median follow-up and interquartile ran-ges were not calculable for some comparison groups. Kaplan–Meier estimates of OS for the G-CSF + plerixafor versus the G-CSF alone group (comparison 1, Fig. 3a) were similar. Similarly, Kaplan–Meier estimates of OS for the G-CSF+ plerixafor group versus G-CSF + che-motherapy group (comparison 2, Fig. 3b) were also similar, although the G-CSF+ plerixafor group trended lower after 0.5 years compared with the G-CSF+ che-motherapy group. For the G-CSF+ plerixafor +
che-motherapy group compared with the G-CSF+
chemotherapy group OS was also similar between groups (comparison 3, Fig.3c). As the upper limit of the HR was >1.3, based on predetermined boundaries, non-inferiority of plerixafor was not demonstrated for any of the com-parison groups. Estimated OS at 3 years are shown in Table3.
Cumulative incidence of relapse rates
Cumulative incidence of relapse rates at 3 years are shown in Table 3. The CIR trended higher in the G-CSF alone group compared with the G-CSF+ plerixafor group until year 5. However, the CIR was similar between the G-CSF+ plerixafor versus the G-CSF + chemotherapy group, and was similar between the G-CSF+ plerixafor + chemotherapy group versus the G-CSF+ chemotherapy group (Fig.4). Screened N=3764 Eligible patients N=3749 G+P N=140 G+P N=70
Comparison 1 Comparison 2 Comparison 3 G alone N=36 G+P N=124 G+C N=124 G+P+C N=130 G+C N=130 G+P+C N=173
Propensity score matching G alone
N=549
G+C
N=2887
Fig. 1 Patient eligibility and treatment. Key: G G-CSF, P plerixafor, C chemotherapy Table 2 Mobilization characteristics for the matched comparator groups Comparison 1 Comparison 2 Comparison 3 G-CSF + plerixafor (N = 70) G-CSF alone (N = 36) G-CSF + plerixafor (N = 124) G-CSF + chemotherapy (N = 124) G-CSF + plerixafor + chemotherapy (N = 130) G-CSF + chemotherapy (N = 130) Predicted poor mobilizers,* n/ N (%) 16/64 (25.0) 14/34 (41.2) 29/116 (25.0) 62/122 (50.8) 26/130 (20.0) 60/127 (47.2) Proven poor mobilizers,** n/ N (%) 68/70 (97.1) 27/36 (75.0) 120/122 (98.4) 84/123 (68.3) 127/130 (97.7) 89/129 (69.0) Current mobilization Failed to mobilize suf fi cient CD34 + cells at predicted time, n/ N 33/46 (71.7) 6/16 (37.5) 56/81 (69.1) 12/47 (25.5) 72/97 (74.2) 13/53 (24.5) (%) CD34 + cell count, median × 10 9/L 5.0 (n = 39) 16.0 (n = 10) 5.2 (n = 66) 8.9 (n = 16) 5.0 (n = 76) 8.8 (n = 17) G-CSF granulocyte-colony stimulating factor, SD standard deviation *Predicted poor mobilizers were de fi ned as patients who had received prior irradiation to marrow bearing areas or had high exposure to marrow-damaging chemotherapy **Proven poor mobilizers were de fi ned as patients who in a previous mobilization attempt failed to mobilize suf fi cient CD34 + cells in the peripheral blood to proceed to apheresis or to proceed to transplantation or who, in the current mobilization, failed to achieve a suf fi cient increase in peripheral blood CD34 + cells at the predicted time for peak mobilization
Secondary outcomes
Post transplantationAdverse events occurring in more than one patient in any treatment group up to 100 days postfirst transplantation are
Table 3 Primary outcomes progression-free survival, overall survival, and cumulative incidence of relapse for each of the comparator groups Comparison 1 Comparison 2 Comparison 3 G-CSF + plerixafor (N = 70) G-CSF alone (N = 36) G-CSF + plerixafor (N = 124) G-CSF + chemotherapy (N = 124) G-CSF + plerixafor + chemotherapy (N = 130) G-CSF + chemotherapy (N = 130) Estimated PFS, at 3 years, [95% CI] 0.59 [0.46, 0.70] 0.50 [0.32, 0.65] 0.56 [0.47, 0.65] 0.59 [0.50, 0.67] 0.48 [0.39, 0.57] 0.56 [0.46, 0.64] PFS hazard ratio [95% CI] a 0.82 [0.44, 1.53] 1.16 [0.78, 1.73] 1.16 [0.80, 1.67] Estimated OS at 3 years, [95% CI] 0.75 [0.62, 0.84] 0.70 [0.51, 0.83] 0.69 [0.59, 0.76] 0.76 [0.68, 0.83] 0.67 [0.58, 0.75] 0.71 [0.62, 0.78] OS hazard ratio [95% CI] a 0.97 [0.47, 2.03] 1.45 [0.91, 2.32] 1.29 [0.78, 2.11] Deaths, n (%) 20 (28.6) 11 (30.6) 41 (33.1) 31 (25.0) 45 (34.6) 38 (29.2) Deaths Hazard ratio [95% CI] a 0.97 [0.47, 2.03] 1.45 [0.91, 2.32] 1.29 [0.78, 2.11] CIR, 3 years [95% CI] 0.33 [0.22, 0.45] 0.44 [0.27, 0.61] 0.38 [0.29, 0.47] 0.36 [0.28, 0.45] 0.44 [0.35, 0.52] 0.38 [0.30, 0.47] CI con fi dence interval, CIR cumulative incidence of relapse, G-CSF granulocyte-colony stimulating factor, OS overall survival, PFS progression-free survival aHazard ratio with covariate adjustment including status of disease at time of transplant, conditioning regimens, and interval from diagnosis to tra nsplantation and performance status (Karnofsky) Ev ent-free probability 1.0 a b c 0.9 0.8 0.7 0.6 0.5 0.4 0.3 0.2 0.1 0.0 Ev ent-free probability 1.0 0.9 0.8 0.7 0.6 0.5 0.4 0.3 0.2 0.1 0.0 Ev ent-free probability 1.0 0.9 0.8 0.7 0.6 0.5 0.4 0.3 0.2 0.1 0.0 Number at risk Number at risk Number at risk 0 1 2 Time (years) 3 4 5 6 7 0.5 0 1 2 Time (years) 3 4 5 6 7 0.5 0 1 2 Time (years) 3 4 5 6 7 0.5 70 36 124 124 104 95 130 130 102 93 81 66 68 48 57 32 16 18 1 4 0 0 37 87 84 70 51 35 15 4 0 0 7 20 38 58 74 91 56 28 48 27 40 22 29 13 22 11 8 3 1 0 0 Plerixafor + G-CSF Plerixafor + G-CSF G-CSF alone Plerixafor + G-CSF Plerixafor + G-CSF + chemo Plerixafor + G-CSF Plerixafor + G-CSF + chemo G-CSF + chemo G-CSF + chemo G-CSF + chemo G-CSF + chemo G-CSF alone
Fig. 2 Progression-free survival for each of the comparison groups,a G-CSF+ plerixafor versus G-CSF alone (comparison 1); b G-CSF + plerixafor versus G-CSF+ chemotherapy (comparison 2); and c G-CSF+ plerixafor + chemotherapy versus G-CSF + chemotherapy (comparison 3)
shown in Table4. Infections and infestations were the most common standard organ class complication in all plerixafor and comparator groups.
Engraftment was reported in ≥88% of patients in each treatment group of the three comparisons. Similarly, engraftment of both platelets and neutrophils was reported in≥82% of patients in each treatment group. The median
number of days to reach a platelet count of≥20 × 109/L was 14 days for each of the plerixafor groups and 12–13 days for the respective comparator groups. The median number of days to reach a neutrophil count of ≥0.5 × 10⁹/L was 11–12 days for each group.
Ev ent-free probability 1.0 a 0.9 0.8 0.7 0.6 0.5 0.4 0.3 0.2 0.1 0.0 Ev ent-free probability 1.0 b c 0.9 0.8 0.7 0.6 0.5 0.4 0.3 0.2 0.1 0.0 Ev ent-free probability 1.0 0.9 0.8 0.7 0.6 0.5 0.4 0.3 0.2 0.1 0.0 Number at risk Plerixafor + G-CSF Plerixafor + G-CSF G-CSF alone Number at risk Plerixafor + G-CSF G-CSF + chemo G-CSF alone Plerixafor + G-CSF G-CSF + chemo Plerixafor + G-CSF + chemo G-CSF + chemo 0 1 2 Time (years) 3 4 5 6 7 0.5 0 1 2 Time (years) 3 4 5 6 7 0.5 0 1 2 Time (years) 3 4 5 6 7 0.5 70 36 124 124 130 130 105 117 96 106 81 84 62 70 43 49 22 26 1 5 0 0 108 116 97 107 82 91 64 70 44 51 22 29 4 9 0 0 62 32 57 31 47 27 38 19 28 16 13 5 1 0 2 0 Number at risk Plerixafor + G-CSF + chemo G-CSF + chemo
Fig. 3 Overall survival for each of the comparison groups,a G-CSF + plerixafor versus G-CSF alone (comparison 1);b G-CSF + plerixafor versus G-CSF+ chemotherapy (comparison 2); and c G-CSF + pler-ixafor+ chemotherapy versus G-CSF + chemotherapy (comparison 3)
0.5 a 0.4 Cum ulativ e incidence estimate 0.3 0.2 0.1 0.0 0 1 2 3 4 Time (years) Plerixafor + G-CSF G-CSF alone Plerixafor + G-CSF G-CSF + chemo Plerixafor + G-CSF + chemo G-CSF + chemo 5 6 7 0 1 2 3 4 Time (years) 5 6 7 0 1 2 3 4 Time (years) 5 6 7 0.5 b 0.4 Cum ulativ e incidence estimate 0.3 0.2 0.1 0.0 0.5 c 0.4 Cum ulativ e incidence estimate 0.3 0.2 0.1 0.0
Fig. 4 Cumulative incidence of relapse for each of the comparison groups,a G-CSF + plerixafor versus G-CSF alone (comparison 1); b G-CSF+ plerixafor versus G-CSF + chemotherapy (comparison 2); and c G-CSF + plerixafor + chemotherapy versus G-CSF + che-motherapy (comparison 3)
Discussion
This study was a postapproval measure to investigate clin-ical disease outcome as a surrogate of potential enhance-ment of tumor cell release when combining G-CSF+ plerixafor. The study was not designed to evaluate the benefit of stem cell mobilization with plerixafor compared with other methods. In general, no major differences were observed in PFS, OS, or CIR between the plerixafor and the comparison groups.
In line with the plerixafor label all patients in the study had to be poor mobilizers, either as proven poor mobilizers, based on their mobilization history, or as predicted poor mobilizers through exposure to high-dose chemotherapy. However, despite propensity score matching, which tried to balance the groups, there were still substantially more proven poor mobilizers in the plerixafor cohorts, which may have led to an imbalance between comparison groups. Consistently the median pre-apheresis CD34+ cell counts in the plerixafor cohorts during the current mobilization at the predicted time of peak mobilization were lower com-pared with comparison cohorts. Therefore, it appears that the groups were not well balanced for disease and HSCT risk.
Others have shown that lymphoma patients’ poor mobilization of autologous stem cells, defined as the inability to obtain ≥1 × 10⁶ CD34+ cells/kg body weight, resulted in substantially lower PFS and OS compared with good mobilizers [14,15]. Therefore, in our study, the higher proportion of proven poor mobilizers in the plerixafor groups may, at least in part, explain the PFS, OS, and CIR results versus those in the comparison groups. Furthermore, there are two confounders, which might have skewed the analysis of the data in the current study. Firstly, poor mobilization could be an indicator of more severe or prognostically worse disease. Therefore, the post-plerixafor outcomes trending toward slightly worse OS, PFS, and CIR could be the result of more advanced lymphoma disease and not a trend toward inferiority of plerixafor-mobilized grafts. Secondly, data on the lymphoma biology were not avail-able, which does not allow the confirmation that the pler-ixafor and comparator groups were balanced in relation to the stage of the lymphoma disease.
Engraftment was reported in≥88% of patients in each of the three comparator cohorts and the median number of days to achieve the target levels of platelets and neutrophils was similar for all cohorts (12–13 days and 11–12 days, respectively), which was in line withfindings from a pre-vious study [16].
In support of our findings, results from a 5-year, long-term, phase 3, follow-up study (not restricted to poor mobilizers) suggested that the use of G-CSF+ plerixafor did not have a negative outcome on PFS and OS in patients
Table 4 Adverse events occurring in more than one patient in any treatment group up to 100 days post fi rst transplantation Comparison 1 Comparison 2 Comparison 3 Adverse event standard organ class, n (%) preferred term G-CSF + plerixafor (N = 70) G-CSF alone (N = 36) G-CSF + plerixafor (N = 124) G-CSF + chemotherapy (N = 124) G-CSF + plerixafor + chemotherapy (N = 130) G-CSF + chemotherapy (N = 130) Any adverse event up to 100 days post transplantation 37 (52.9) 19 (52.8) 66 (53.2) 62 (50.0) 55 (42.3) 68 (52.3) Infections and infestations 32 (45.7) 13 (36.1) 56 (45.2) 51 (41.1) 42 (32.3) 59 (45.4) Bacterial infections 16 (22.9) 8 (22.2) 29 (23.4) 31 (25.0) 33 (25.4) 36 (27.7) Blood and lymphatic disorders 5 (7.1) 3 (8.3) 8 (6.5) 5 (4.0) 2 (1.5) 3 (2.3) Gastrointestinal disorders 2 (2.9) 1 (2.8) 4 (3.2) 3 (2.4) 3 (2.3) 4 (3.1) General disorders and administration site disorders 8 (11.4) 1 (2.8) 11 (8.9) 14 (11.3) 21 (16.2) 17 (13.1) Metabolism and nutritional disorders 0 0 0 2 (1.6) 0 2 (1.5) Renal and urinary disorders 1 (1.4) 1 (2.8) 2 (1.6) 1 (0.8) 3 (2.3) 2 (1.5) Vascular disorders 0 1 (2.8) 0 1 (0.8) 2 (1.5) 2 (1.5) Cardiac disorders 0 0 0 2 (1.6) 1 (0.8) 3 (2.3) Nervous system disorders 0 0 1 (0.8) 0 2 (1.5) 0 Respiratory, thoracic, and mediastinal disorders 0 0 0 1 (0.8) 3 (2.3) 1 (0.8) Skin and subcutaneous disorders 0 0 0 0 2 (1.5) 0 G-CSF granulocyte-colony stimulating factor
with lymphoma, with more than a half of patients with lymphoma remaining alive 5 years post transplantation [17]. Propensity scores are increasingly used in non-randomized studies to assess marginal treatment effects and to reduce potential bias and imbalances of baseline cov-ariates [12]. The assumption of propensity scores is that none of the unmeasured covariates affecting treatment choice confound the association between treatment and outcome [18]. Unobserved differences between groups cannot be adjusted by propensity scores; therefore, this is both a source of potential bias and a limitation of propensity scores [19]. Despite the modest sample size in the com-parisons resulting from propensity scoring matching, in our study, an adequate balance for certain key disease char-acteristics collected in the database was maintained. How-ever, we acknowledge that some key factors affecting mobilization outcome were unavailable in the database, such as, the number of rounds and the type of chemotherapy administered, and for those who received radiotherapy the extension of irradiated fields. These limitations in data collection may have had a major impact on the outcomes in our study.
Moreover, in line with the reimbursement criteria for the drug and the obligation on some clinicians to closely manage treatment costs [20], plerixafor may have been selectively given to patients who were the poorest mobi-lizers at highest risk, and this may have been a factor in the trend for slightly worse outcomes in the plerixafor-treated groups. Conversely, only patients with successful mobilization were included in the study, this may have inadvertently introduced selection bias in favor of the non-plerixafor cohorts. Furthermore, our study was not adequately powered, as there were small to moderate numbers of patients in each cohort after propensity score matching. Although every effort was made to remove potential biases in this study, biases may not have been removed completely due to the observational nature of the data.
Conclusions
Although non-inferiority of the plerixafor groups could not be formally shown, PFS, OS, and CIR were numerically similar between comparators. Results from this study should be interpreted with caution due to a number of limitations. These include an imbalance between treatment groups due to the greater proportion of proven poor mobi-lizers in the groups treated with plerixafor, the limited scope of the EBMT database, the lack of power, and the obser-vational nature of the study. In particular, a higher pro-portion of patients treated with plerixafor failed to mobilize
sufficient CD34+ cells at the predicted time. Therefore, these patients represent a group that is likely predisposed to worse outcomes. Infections and infestations were the most common standard organ class posttransplant complication for plerixafor and comparator cohorts. Without plerixafor treatment, it is likely that some patients may not have proceeded to transplantation. Altogether, this study does not provide evidence that plerixafor mobilization is associated with an increased risk of relapse or post-transplant toxicities in patients undergoing HSCT for lymphoma.
Data availability
Qualified researchers may request access to patient level data and related study documents including the clinical study report, study protocol with any amendments, blank case report form, statistical analysis plan, and dataset spe-cifications. Patient level data will be anonymized and study documents will be redacted to protect the privacy of trial participants. Further details on Sanofi’s data sharing criteria, eligible studies, and process for requesting access can be found at: https://www.clinicalstudydatarequest.com.
Acknowledgements The study was sponsored by Sanofi, Cambridge, MA, USA. The authors were responsible for all content and editorial decisions and received no honoraria related to the development of this publication. Medical writing assistance was provided by John Clarke, Ph.D., Elevate Scientific Solutions, Horsham, UK, funded by Sanofi. The authors would like to thank Remi Castan for comments and helpful discussion of the content of the manuscript, the data managers at the contributing centers, and at the EBMT office for their invaluable contributions to the conduct of the study.
Compliance with ethical standards
Conflict of interest AS has received personal fees from Sanofi, grants and personal fees from BMS and Celgene, personal fees from Janssen, Gilead, Novartis, and Takeda. CC reports receiving fees for data transfer from EBMT during the conduct of the study and grants, and personal fees and nonfinancial support from Sanofi outside the scope of the submitted work. TM received financial supports for advisory board membership for AbbVie, BMS, Janssen-Cilag, Novartis, Pfizer, and Takeda outside the scope of the submitted work. CS reports personal fees from Sanofi. CT received financial supports for advisory board membership for Roche, Takeda, Janssen-Cilag, Bayer, and Celgene outside the scope of the submitted work. IS received personal fees from Sanofi. AD-I received personal fees from the EBMT foun-dation for data transfer during the conduct of the study. EJ received speaker’s fee and research grant from Sanofi. QL and MC are employees of Sanofi. SM received grants for travel from Gilead, and speaker fees from Roche and is an advisory board member for Bayer, outside the scope of submitted work. PD has received speaker’s honoraria from Gilead, Kite; Consultancy: AbbVie, Gilead, Janssen, and Roche. SvdW, PB, AB, DP, BEW, NR, AJ, CT, and AE declare that they have no conflict of interest.
Publisher’s note Springer Nature remains neutral with regard to jurisdictional claims in published maps and institutional affiliations.
Open Access This article is licensed under a Creative Commons Attribution 4.0 International License, which permits use, sharing, adaptation, distribution and reproduction in any medium or format, as long as you give appropriate credit to the original author(s) and the source, provide a link to the Creative Commons license, and indicate if changes were made. The images or other third party material in this article are included in the article’s Creative Commons license, unless indicated otherwise in a credit line to the material. If material is not included in the article’s Creative Commons license and your intended use is not permitted by statutory regulation or exceeds the permitted use, you will need to obtain permission directly from the copyright holder. To view a copy of this license, visithttp://creativecommons.
org/licenses/by/4.0/.
References
1. Kim MG, Han N, Lee EK, Kim T. Pegfilgrastim vs filgrastim in PBSC mobilization for autologous hematopoietic SCT: a sys-tematic review and meta-analysis. Bone Marrow Transpl. 2015;50:523–30.https://doi.org/10.1038/bmt.2014.297.
2. Tse WT, Egalka MC. Stem cell plasticity and blood and marrow transplantation: a clinical strategy. J Cell Biochem Suppl. 2002;38:96–103.
3. Mohty M, Hubel K, Kroger N, Aljurf M, Apperley J, Basak GW, et al. Autologous haematopoietic stem cell mobilisation in mul-tiple myeloma and lymphoma patients: a position statement from the European Group for Blood and Marrow Transplantation. Bone Marrow Transpl. 2014;49:865–72. https://doi.org/10.1038/bmt.
2014.39.
4. Giralt S, Costa L, Schriber J, Dipersio J, Maziarz R, McCarty J, et al. Optimizing autologous stem cell mobilization strategies to improve patient outcomes: consensus guidelines and recommen-dations. Biol Blood Marrow Transpl. 2014;20:295–308.https://
doi.org/10.1016/j.bbmt.2013.10.013.
5. Fricker SP, Anastassov V, Cox J, Darkes MC, Grujic O, Idzan SR, et al. Characterization of the molecular pharmacology of AMD3100: a specific antagonist of the G-protein coupled che-mokine receptor, CXCR4. Biochem Pharm. 2006;72:588–96.
https://doi.org/10.1016/j.bcp.2006.05.010.
6. Hatse S, Princen K, Bridger G, De Clercq E, Schols D. Chemo-kine receptor inhibition by AMD3100 is strictly confined to CXCR4. FEBS Lett. 2002;527:255–62.
7. Fruehauf S, Seeger T. New strategies for mobilization of hema-topoietic stem cells. Future Oncol. 2005;1:375–83.https://doi.org/
10.1517/14796694.1.3.375.
8. Lapidot T, Dar A, Kollet O. How do stem cells find their way home? Blood. 2005;106:1901–10.
https://doi.org/10.1182/blood-2005-04-1417.
9. DiPersio JF, Uy GL, Yasothan U, Kirkpatrick P. Plerixafor. Nat Rev Drug Discov. 2009;8:105–6. https://doi.org/10.1038/
nrd2819.
10. Nervi B, Link DC, DiPersio JF. Cytokines and hematopoietic stem cell mobilization. J Cell Biochem. 2006;99:690–705.https://doi.
org/10.1002/jcb.21043.
11. Olivieri A, Marchetti M, Lemoli R, Tarella C, Iacone A, Lanza F, et al. Proposed definition of ‘poor mobilizer’ in lymphoma and multiple myeloma: an analytic hierarchy process by ad hoc working group Gruppo ItalianoTrapianto di Midollo Osseo. Bone Marrow Transpl. 2012;47:342–51. https://doi.org/10.1038/bmt.
2011.82.
12. Pirracchio R, Resche-Rigon M, Chevret S. Evaluation of the propensity score methods for estimating marginal odds ratios in case of small sample size. BMC Med Res Methodol. 2012;12:70
https://doi.org/10.1186/1471-2288-12-70.
13. Kaplan EL, Meier P. Nonparametric estimation from incomplete observation. J Am Stat Assoc. 1958;53:457–81.
14. Gordan LN, Sugrue MW, Lynch JW, Williams KD, Khan SA, Wingard JR, et al. Poor mobilization of peripheral blood stem cells is a risk factor for worse outcome in lymphoma patients under-going autologous stem cell transplantation. Leuk Lymphoma. 2003;44:815–20.https://doi.org/10.1080/1042819031000067585. 15. Pavone V, Gaudio F, Console G, Vitolo U, Iacopino P, Guarini A,
et al. Poor mobilization is an independent prognostic factor in patients with malignant lymphomas treated by peripheral blood stem cell transplantation. Bone Marrow Transpl. 2006;37:719–24.
https://doi.org/10.1038/sj.bmt.1705298.
16. Varmavuo V, Rimpilainen J, Kuitunen H, Nihtinen A, Vasala K, Mikkola M, et al. Engraftment and outcome after autologous stem cell transplantation in plerixafor-mobilized non-Hodgkin’s lym-phoma patients. Transfusion. 2014;54:1243–50.https://doi.org/10.
1111/trf.12434.
17. Micallef IN, Stiff PJ, Nademanee A, Maziarz RT, Horwitz M, Stadtmauer EA, et al. Plerixafor plus granulocyte colony-stimulating factor for patients with non-Hodgkin’s lymphoma and multiple myeloma: long-term follow-up report. Biol Blood Marrow Transpl. 2018;24:1187–95.
18. Brooks JM, Ohsfeldt RL. Squeezing the balloon: propensity scores and unmeasured covariate balance. Health Serv Res. 2013;48:1487–507.https://doi.org/10.1111/1475-6773.12020. 19. Garrido MM, Kelley AS, Paris J, Roza K, Meier DE, Morrison
RS, et al. Methods for constructing and assessing propensity scores. Health Serv Res. 2014;49:1701–20. https://doi.org/10.
1111/1475-6773.12182.
20. Veltri L, Cumpston A, Shillingburg A, Wen S, Luo J, Leadmon S, et al. Hematopoietic progenitor cell mobilization with “just-in-time” plerixafor approach is a cost-effective alternative to routine plerixafor use. Cytotherapy. 2015;17:1785–92.https://doi.org/10.