Global and Local Centrality of
Emerging Countries in the World Trade Network
Luca De Benedictis
∗Lucia Tajoli
†February 2018
Abstract
Among the many changes that characterized the world trading system in the past decades, a very
relevant and much discussed one concerns the role of the so-called “emerging countries.” In this Chapter,
we study the position of a number of “emerging countries” in the World Trade Network (WTN) in order
to assess whether they are standing out from the rest of developing countries as far as the central position
they occupy, making a comparison between local centrality measures and global centrality measures.
The case of China and Mexico are compared. The analysis shows that the core-periphery structure of
the WTN apparent in the mid-1990s is no longer so evident and that the number and relevance of trade
connections of most emerging and developing countries has increased significantly. Finally, we analyze
whether the trade evolution of the emerging economies is related to their trade partnerships and to
their position in the network, estimating the relationship between their centrality and their growth
rates. Results indicate that centrality is positively and significantly correlated to emerging countries’
growth rates.
Keywords: Centrality, International Trade, Network analysis. JEL Classification: C02, F10, F14.
∗DED - Universit`a di Macerata; Rossi-Doria Centre, University Roma Tre; Luiss.
†DIG - Politecnico di Milano. [email protected]
We are grateful to Sara Gorgoni for her encouragement and endless patience, and to an anonymous reviewer for pointing out many useful improvements. This chapter would not be as it is without the influence of long term talks with Rodolfo Helg, Lelio Iapadre, Silvia Nenci, Gianluca Santoni, Claudio Vicarelli, Luca Salvatici, Carlo Piccardi, Vladimir Batagelj, Valerio Leone Sciabolazza, Patrick Doreian and most of all with Giorgio Fagiolo. We are grateful to all of them. They are not responsible for our mistakes, so the usual disclaimer applies.
Contents
1 Introduction: Hubs and Satellites 3
1.1 The evolution of the World Trade Network . . . 4
2 Which countries are emerging? 8
2.1 The changing role of emerging countries in world trade . . . . 9
2.2 Two cases: China and Mexico . . . 12
3 Emerging countries’ position in the World Trade Network 13
3.1 Visualization . . . 14
3.2 Network statistics: Centrality . . . 16
3.3 Regressions . . . 20
4 Concluding remarks 24
1
Introduction: Hubs and Satellites
Many changes characterized the world trading system in the past decades. A very relevant and much discussed one concerns the role of the so-called “emerging countries.” In general terms, emerging countries are a group of de-veloping countries that attracted much attention by economists and investors because of their rapidly expanding economies. There is no consensus on the exact definition of the term, and the countries which are supposed to be in the process of emergence are often referred to as middle-low income countries under rapid transformation by the IMF World Economic Outlook, or rapidly growing countries (in terms of GDP) by the World Economic Forum, or coun-tries with increasing market shares in world exports by the European Central Bank, or reference is made to some other economic characteristic. One of the reasons for the difficulty in pinning down an exact definition is that emerging countries display quite different characteristics and their economies followed separate paths (Jain, 2006, Aggarwal and Goodell, 2008). In this work, we want to look at emerging countries considering in particular their position in the world trading system and comparing their role within such a system.
To obtain a broad and heterogenous group of emerging countries, among the many possible and evolving classifications (see Sect. 2), in this work we have chosen to follow the list by Kearney (2012), including 27 countries obtained combining various criteria, also used by some other classifications. The countries are Argentina, Brazil, Czech Republic, Chile, China, Colom-bia, Egypt, Hungary, India, Indonesia, Israel, Jordan, Malaysia, Morocco, Mexico, Pakistan, Peru, Philippines, Poland, Russia, South Africa, South Korea, Taiwan, Thailand, Turkey, United Arab Emirates and Venezuela.1 This is indeed a miscellaneous group under many perspectives: these coun-tries are scattered in all continents, they are quite different in economic size
1 With respect to other classifications the one byKearney(2012) includes, in addition
to the usual suspects, some oil producing countries such as the United Arab Emirates and Venezuela, some African countries such Egypt, Morocco and South Africa, a few OECD countries, and Taiwan.
and population, they present different levels of development, different mod-els of specialization and they followed uneven growth paths. Certainly, they are playing an increasingly important role in changing the patterns of in-ternational trade (Hanson, 2012, Iapadre and Tajoli, 2014). Among them, we will particularly focus our analysis on two cases, the one of China and the one of Mexico. They followed a different trajectory that, according to us, is quite paradigmatic in interpreting the role of of emerging countries in world trade. China rises to a hub position, certainly at the regional level and for some specific manufacturing sectors, but also globally to a certain extent. Mexico became the satellite of the US economy. Hubs and Satellites seem the potential strategies for all other emerging countries, exploiting the advantages captured by the notions of degree centrality (a high number of trade connections with respect to other countries, i.e. a high number of trade partners) and eigenvector centrality (links to the most connected countries of the world, i.e. trade with the most ”important” countries).2
1.1
The evolution of the World Trade Network
In the past decades, the world trading system in itself has undergone a num-ber of transformations, that also involved emerging countries. The numnum-ber of countries with a relevant role in world trade increased (De Benedictis and Tajoli, 2011), and we can also observe an increased heterogeneity of the important traders, that appear to be at very different stages of devel-opment. Finally, trade in commodities, while still important, is by far out-paced by trade in more complex goods. This phenomenon is associated with an increasing share of trade due to intermediate inputs and semi-finished goods, as international fragmentation of production and global value chains have become widespread (Grossman and Rossi-Hansberg,2008,Johnson and Noguera, 2012, Baldwin and Lopez-Gonzalez,2015).
These transformations give rise to a changing World Trade Network (WTN). As observed, the density of the WTN (measured by the number of links in the network over the maximum possible number of links) has been growing over time (De Benedictis and Tajoli,2011,De Benedictis et al.,2014), even if also in this context it is visible the trade shock that followed the international financial crisis.
In a directed network, like the one considered here, density is formally
defined as γ = mm
max ≡
m
n(n−1), where m is the number of observed arcs in
the network, while n is the number of nodes. Among the many properties of the density, two are particularly handy, in the present context: the first one is that being a measure bounded between 0 and 1 it can be interpreted in a probabilistic way; the second one is that it can be decomposed among the different contributions of countries or of group of countries to the overall density.
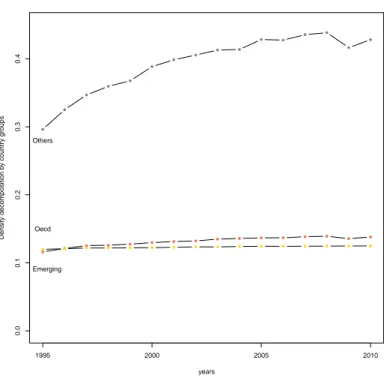
This decomposition is presented in Figure1, where γ - the density of the WTN - is shown split in three time series, one for each group of countries analyzed. The overall density γ is rising, with a decreasing slope: the WTN is becoming more connected, as reported by many studies in recent years (Fagiolo et al., 2008, Bhattacharya et al., 2008, Krapohl and Fink, 2013). More specifically, in 1995 the density of the overall trade network was 0.53,3
meaning that two countries picked at random had 53 per cent of probability of sharing a common link. In 2010 that probability rose to 0.69, after a peak of 0.70 in 2008 and a sudden drop in the aftermath of the financial crisis.
Splitting the total number of countries into three groups - OECD coun-tries, Emerging countries and a residual category that, lacking a better al-ternative, we call Others, including Less Developed Countries, Oil producing countries and the rest – we can trace the dynamics of the corresponding sub-densities. During the years between 1995 and 2010, trade links involv-ing Emerginvolv-ing countries were contributinvolv-ing already in a substantial manner to overall density. In 1995, the overall density of 0.53 was due to links involving Emerging countries up to 0.11, as γE = mE1995
n(n−1)=0.11, while links involving
OECD countries contributed in a similar way for an additional 0.12 and the much larger group of Others made up the remaining 0.30.
The dynamics of the two time series associated to OECD and Emerging countries slowly diverges, approaching the maximum number of possible links of each group.4 As for OECD countries, many Emerging countries were al-ready trading with the majority of possible trading partners in 1995. In facts, the large bulk of the increase in the density of the trade network, between 1995 and 2010, can be attributed to the growing connectivity of the
resid-3 The formula of the density is in this case γ
1995= n(n−1)m1995 =
7553+18666+7301
178×177 ≡ 0.53 ≡
0.11 + 0.30 + 0.12 ≡ γE
1995+ γ1995O + γ1995D ; where E stands for Emerging, O stands for
Others and D stands for OECD countries.
4 In the case of Emerging countries mE
max=
27×177
178×177 = 0.15, while for OECD countries
is mD
Figure 1: Density of the World Trade Network 1995 2000 2005 2010 0.0 0.1 0.2 0.3 0.4 years Density decomposition b y countr y groups Emerging Others Oecd
Note: Yellow dots indicate OECD, orange dots indicate Emerging and gray dots Others .
Source: Authors’ elaboration on ComTrade database.
ual category of Others (see Figure 1). The same group is the one the most affected by the trade effect of the financial crisis, with the Emerging coun-tries showing only a modest negative blip, and OECD councoun-tries remaining basically unaffected.
The level of the contribution of each one of the three groups of countries depends, of course, by the numerosity of each group. While the the residual category is composed of 125 countries, the OECD countries in our sample set are 26, while the Emerging countries are 27. With a sample of 178 countries it is not a surprise that the group that contributes the most to the overall density is the one of Others. To make evident why that group is also shaping the dynamics of γ it is convenient to calculate the average degree of each group, that is the average number of incoming and outgoing trade links. In
1995 the average indegree of OECD countries was 160.39: on average an OECD country was importing from little bit more than 160 country trade partners, over a maximum of 177. The standard deviation was 16.03 and the minimum value was corresponding to Iceland, importing only from 106 trade partners. The statistics on the outdegree are similar for the OECD countries in 1995, showing average intensive trade surplus. On average they were exporting to 168 countries, with a standard deviation of 17.86 and with Iceland exporting to 96 country trade partners. In fifteen years both averages increased, to 168.43 and 173.35 with several OECD countries trading with 177 trade partners, and variances decreasing to 11.26 and 8.1, showing both a mean convergence towards the highest levels of connectivity and a reduction in variance (Barro, 1991, Rodrik,2012, Acemoglu,2008).
In 1995, the group of Others had an average indegree of 74.94, with a standard deviation of 30.52 (Micronesia was importing from 18 countries, while Hong Kong was from 152 countries), an average outdegree of 70.89, with a standard deviation of 31.55 (with the same two countries exporting to 9 and 198 trade partners), and an average intensive trade deficit. In 2010, the countries in the Others group moved to an average indegree of 106.68 and an average outdegree of 104.09, with the standard deviations slightly increasing to 31.35 and 36.22, respectively, with no σ convergence whatsoever.
The average indegree of Emerging countries in 1995 was 128.85, lower than the one of OECD countries but higher than the one of Others. The indegree standard deviation was 28.09, comparable to the one of the group of Others. The average outdegree was 141.56, with a very similar outdegree standard deviation of 28.82, showing an average intensive trade surplus. In fifteen years, the group of Emerging countries, also in terms of connectivity showed a high speed of both β and σ convergence. Average indegree and outdegree moved to 156.93 and 165.04, respectively; indegree and outdegree standard deviations decreased to 16.98 and 15.88. Many Emerging coun-tries reached the maximum possible level of connectivity: Brazil, the Czech Repubblic, Indonesia, India, South Korea, Malaysia, Pakistan, Poland, the Russian Federation, Thailand, Turkey and South Africa, all have both a level of indegree and outdegree higher that the mean value for Emerging countries, quite similar to the one of the average OECD country. Mexico and China are also among this group. China was fairly connected in 1995, already, with a level of indegree of 160 and a level of outdegree of 176, that reached the level of 176 and 177, respectively, in 2010. Mexico was a follower in 1995, with a level of indegree of 152 and a level of outdegree of 155. It moved fast in terms
of indegree, reaching a level of 176 in 2010, but lagged a little bit behind in terms of outdegree, with a level of 170. In spite of this little difference their trajectories look quite similar, at least in terms of the indicators used so far, degrees and density.
The transformations of the WTN involve much more than a changing density or the distribution of average degree. The overall structure of the WTN changed in the past decades in terms of centralization, clusterization and hierarchy, and the strength of connections, shifting the relative position of many countries. For example, the rise of China as a trader in the last decades occurred mainly in terms of intensity of trade flows and with a dramatic change of its position within the WTN, rather than in terms of the number of connections. In this work, the aim is to assess the position of countries at an intermediate level of development in the WTN in order to assess whether they are truly “emerging” within the system and they occupy central positions so to affect the overall connectivity of the WTN. Furthermore, we assess how the position in the WTN of countries is related to their economic changes, using Mexico and China as examples of satellites and hubs among emerging economies.
2
Which countries are emerging?
The term emerging countries or emerging economies is normally used to identify a group of countries with an intermediate level of development whose role in the international markets became much more relevant and visible in the recent past. As mentioned, it is not easy to single out the members of this group, as there is no clear-cut consensus on the definition of “emerging”. The term initially become widespread especially in the financial literature, usually referring to “emerging markets”. In this field of analysis, the links between the financial markets of the advanced and emerging countries have been highlighted to understand to what extent the economic performance of this latter group of countries is exposed to foreign shocks and to the business cycle of the rest of world (Devereux and Mendoza, 2006, Kose et al., 2006,
Aggarwal and Goodell, 2008).
But emerging countries have been analyzed also from different perspec-tives and the existing literature provides similar but not overlapping crite-ria to identify emerging countries: middle-low income countries under rapid transformation, rapidly growing countries in terms of GDP, countries with
increasing market shares in world export. Vercueil (2012) proposes a def-inition of emerging economies that requires to apply simultaneously these three criteria, saying that emerging economies display an intermediate level of per capita income, and they are undergoing a process of economic and in-stitutional transformation that generates a high rate of economic growth and increased participation to the world trading system. Applying this definition, there are about fifty or sixty countries that can be defined as emerging. Still, there is no general consensus on the list of countries belonging to this group. The International Monetary Fund in its official publications often refers to “emerging countries,” but its definition of this group is not clear-cut.5 The
World Bank explicitly states that it does not use this type of groupings, but it only groups countries by per capita income levels.
Here we want to highlight the role of emerging countries in participating to the transformation of the structure of the trading system, as shown for example by Hanson (2012) and Iapadre and Tajoli (2014). Therefore, we have chosen here to identify as emerging countries the ones listed by Kear-ney (2012), because this group includes the middle economies mentioned by
Hanson (2012) as well as some other important trader with different char-acteristics. We will focus on dyadic relations among countries, especially on their trade outcomes, starting by considering their market shares, even if we are aware that this is not the only criterion that applies.
2.1
The changing role of emerging countries in world
trade
According to the calculations by Hanson (2012), using data similar to the one we will shortly report about, since the early 1990s, low- and middle-income economies more than doubled their total share of world exports: the 15 largest middle-income countries had an average annual export growth of 8 percent. In particular, between 1992 and 2008, average annual growth in exports was 18 percent in China and 14 percent in India. In the analysis
5 On the IMF website it is stated that “the main criteria used by the IMF World
Economic Outlook to classify the world into advanced economies and emerging market and developing economies are (1) per capita income level averaged over a number of years, (2) export diversification, and (3) degree of integration into the global financial system [...] Note, however, that these are not the only factors considered in deciding the classification of countries [...] This classification is not based on strict criteria, economic or otherwise, and it has evolved over time.”
by Iapadre and Tajoli (2014), using a network framework, already in 1995, the so-called BRICs (Brazil, Russia, India and China, the largest among the emerging economies) appeared well connected and central in the system in terms of degree centrality (with the exception of Russia). All the BRICs catch-up considerably in terms of the number of their connections in the past decade. But that work highlights that with respect to more complex centrality measures, such as eigenvector centrality, the position of the BRICs was much weaker. Even if China has an export market share higher than USA since 2007, in 2011 its total eigenvector centrality was half of USA’s, in spite of an impressive growth over time of this indicator.6 Here we want to
discuss this evidence taking a long run perspective, focusing on two specific years 1995 and 2010, later on.
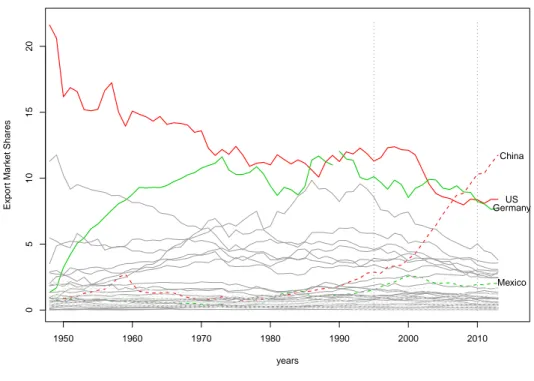
In Figure2, using historical data on aggregate exports collected by UNC-TAD, we are able to plot the long term dynamics of international trade market shares of each one of the 178 countries in our dataset. Highlighting the evolution of market shares of the US, Germany, Mexico and China helps us tracing the general trend of OECD countries (shown by continuous lines in Figure 2), on the one side, and Emerging countries (dotted lines), on the other, since the 1950s.
The US were the leading country, in terms of world trade market share, during the years immediately after the Second World War. With a market share above 20% they dominated international markets. The negative US trend that marks the the period between the 1950s and the second half of the 1980s is almost specular to the one of Germany. From an export market share of less than 2%, Germany rapidly rose at a level around 10% in the 1960s and reached a peak around 12% at the beginning of the 1960s. This is a period of catching-up among OECD countries. The dominant actors of the post-War period, such as the US and the UK, reduce their relative position in favor of rising countries such as Germany, France, Italy and, especially, Japan. All these catching-up OECD countries share an inverted-U long-run trend, reaching its maximum at the end of the 1980s and beginning of the 1990s.
The rebalancing of world trade takes a different direction after the 1980s. The group of Emerging countries, characterized by a level of export market
6 A significant improvement is recorded also for India and Brazil, but both countries
are still far from the Chinese position in the global scenario. SeeIapadre and Tajoli(2014) on that.
Figure 2: International trade market shares 1950 1960 1970 1980 1990 2000 2010 0 5 10 15 20 years Expor t Mar k et Shares US Germany China Mexico
Note: Export market shares (in percent) are the ratio of each country’s merchiandise export in dollars at current prices
over the total value of world exports.
Source: Authors’ elaboration on UNCTAD database.
share around 1% in the 1950s, recovered a little in the first pace but then as a group, with only a few exceptions, they reduced their market shares in the 1960’s, as they cut their colonial ties and many of them turned toward a more autarchic development policy. After a couple of decades of full dominance of advanced countries in world trade, toward the end of the 1980s, market shares of emerging countries begin to grow, and by the beginning of the new millennium a dramatic change in the distribution of market shares has occurred, and it keeps going. In our period of observation, the striking feature is the growth of China’s market share, whose trend started rising in the 1980s and has become steeper in the new millenium. A number of other emerging countries display a significant change in their market shares, even if not
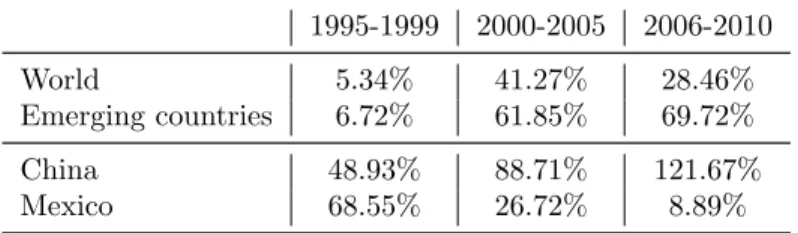
Table 1: GDP growth rates in 5-year periods 1995-1999 2000-2005 2006-2010 World 5.34% 41.27% 28.46% Emerging countries 6.72% 61.85% 69.72% China 48.93% 88.71% 121.67% Mexico 68.55% 26.72% 8.89%
Source: Authors’ elaboration on World Bank database.
comparable to China. Mexico is one of those cases.
2.2
Two cases: China and Mexico
As mentioned, we want to consider the cases of China and Mexico as paradig-matic of different paths followed in developing the countries’ export position. A key feature of emerging economies in the high growth rate of their GDP and their exports. Table 1 presents a comparison of GDP growth rates over the period 1995-2010.
As expected, emerging countries grew at a rate significantly higher than the one recorded for the world average over the entire period. The GDP growth rate accelerated dramatically in the new millennium, and it further increased between 2006 and 2010, when the world economy slowed down because of the international financial crisis. But as the data suggest, the path was quite different from country to country. Mexico displayed a very high GDP growth rate in the late 1990s, earlier than many other Emerging countries, right after joining the North America Free Trade Agreement, that fostered its trade with the US. In that period, Mexico consolidates its position as a crucial production and assembly platform for many US manufacturing firms, and its export growth was spurred also by the country participation to the North American production chains, increasing its export market share to 2.57% in 2000, more than double with respect to ten years earlier. In the early 2000s, the growth of the Mexican economy was still strong, but lower than the world average and much lower than the growth recorded by the Emerging countries, while at the same time its export share was flattening out. From 2006 to 2010, Mexico, very linked to the U.S. economy, hit hardly by the crisis, slowed down well below its previous records, even if maintaining
or even slightly increasing its export share.
China’s growth was remarkable already in the late 1990s, but it contin-ued to accelerate even in the last time span observed here, like other Asian countries, more than doubling its GDP in a few years. At the same time, it kept increasing its export share on world markets. Even if starting with an export market share very similar to Mexico in the late 1980s, China ex-panded rapidly from the 1990s, with an acceleration after 2001, following its entrance in the WTO, and reaching by 2010 a world market share over 10%. Given that China already had a high outdegree in the late 1990s, the impact of joining the WTO was mainly on its outstrength (i.e. its export volumes) and on its incoming trade links. Also for China, like for Mexico, it seems that joining a trade agreement had a sharp impact on its trade, even if for China this was a global multilateral agreement rather than a re-gional one. 7 China’s export as well was helped by the participation of its
industries to international production chains, but China’s production link-ages were also quite global rather than regional, being deeply involved in the production and assembly of consumers’ goods commercialized by American and European multinational enterprises.
We will see that these differences are apparent also in the network position of these countries.
3
Emerging countries’ position in the World
Trade Network
The traditional descriptive empirical analysis put forward so far lack of two elements which instead are crucial in understanding the changes that oc-curred in the 1980s and the 1990s in world trade, and that are characterizing the recent evolution of the trade system: (a) how much the changes occur-ring in one countries are related to other countries? (b) Have those changes a systemic effect on the structure of international trade nowadays?
To answer to those question we expand the use of Network Analysis tools to describe the level of connectivity among countries or different group of countries. We focus just on two sample years 1995 and 2010, the ones de-picted in Figure 2 by the two gray vertical dotted lines on the right. A
7On the impact of trade agreements on the structure of connections of countries see
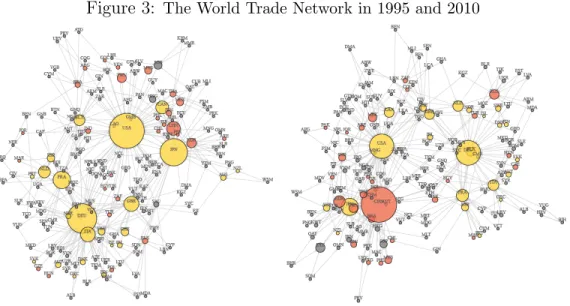
Figure 3: The World Trade Network in 1995 and 2010
Source: Authors’ elaboration on ComTrade database. The 1995 WTN is plotted on the left, while the 2010 WTN is plotted on the right. Country labels are the Iso3 country codes. For each country, only the export flows toward the first and second main trade partners are considered. Weights of trade flows are disregarded in determining the position of nodes. The size of the circle associated to each country is proportional to indegrees. Different colors correspond to different country groups: OECD (yellow), Emerging (red) and Others (gray). The algorithm used for the visualization is the traditionalFruchterman and Reingold(1991) algorithm.
time in which Emerging countries were taking off and were accelerating their participation to World markets, like China, or were falling back and then stabilize their position, like Mexico.
3.1
Visualization
In order to examine the structure and evolution of the WTN, we move from aggregate trade date to bilateral trade data. We use the UN ComTrade / BACI-CEPII database (Gaulier and Zignago,2010), reporting bilateral trade flows measured in U.S. dollars among 178 countries, allowing to obtain a weighted directed network for the two years 1995 and 2010. As in De Bene-dictis et al. (2014) and Zhou et al. (2016), to visualize the WTN we need to sparsify the Trade Matrix to reduce the trade density that impedes any meaningful visualization. We operate a two-steps procedure to select the information contained in the 178×178 Weighted Trade Matrix: (a) for every country we rank export flows in a descending order; (b) for every obtained serie on number, we substitute the two higher export flows with a 1 and all the remaining value (also the missing values and the zeros) with a 0. The
resulting Trade Matrix is binary and includes trade relations only with the two major exporting international markets for every country. Isolates are ruled out by construction.
For the case of the WTN in 1995, this procedure transforms the weighted network G1995 = (V1995, L1995) = (178, 16760) (where V and L represent the
number of nodes and the number of links, respectively)into the binary net-work G1995∗ = (V1995∗ , L∗1995) = (178, 356). The reduction in the number of arcs is substantial, but the selection procedure allows the major arcs from each country to determine the resulting visualization. Since those arcs ac-count for more than 60% of total world trade in 1995 the cost of losing some information is compensated by the possibility of visualizing the bulk of the structure of trade flows. The case of the WTN in 2010 is analogous: the pro-cedure transforms the weighted network G2010 = (178, 21766) into the binary
network G2010∗ = (178, 356).
The resulting visualization is plotted in Figure 3, with the 1995 WTN plotted in the left panel and the 2010 WTN plotted in the right one. Country-node labels are the Iso3 country codes. Whether the outdeegre of each Country-node is fixed to two, the size of the circle associated to each country is proportional to the indegrees, which are highly heterogeneous. Different colours correspond to different country groups: OECD (yellow), Emerging (red) and Others (gray). Finally, the position of a country in the resulting topological space depends on the influence exerted by all other countries, both the ones directly connected to the country under scrutiny and the ones which are not directly connected to it. The location of a node is, therefore, relative to the position of all other nodes.
The algorithm that generates the networks in Figure 3 tends to bring together connected nodes, putting them in the same area of the topological space, while disconnected nodes are put far apart. Nodes that are highly connected (due to the high number of receiving links) tend to be at the center of the network, the ones that are not tend to be placed at the periphery.
In 1995, the OECD are well placed at the core of the network;8 they show
the higher dimension in terms of indegree; and a bi-polar structure with one cluster of countries gravitating around the main European economies, and a second cluster gravitating around North America and Japan. The position
8With the notable exceptions of small countries, such as Austria or Finland; transition
economies, such as the Slovak Republic; and remote countries, such as New Zealand and Australia.
of Emerging countries replicates the same structure, with Asian and Latin American countries close to Japan and the US and Canada, and transition economies close to European countries. African countries are linked to their former colonial rulers, and India and Pakistan placed in intermediate posi-tions. Countries pertaining to the group of Other are not neatly separated from the Emerging countries, and a clear hierarchical structure is not really evident.
In 2010, the structure of the WTN has changed, as the bipolarity has given rise to a three-polar structure, with China, the US and Germany playing the a pivotal role. China is now a major world trade partner and a regional hub, but the star structure is still more evident around Germany and the US. This suggests that the organization of trade flows between Germany and many European countries, especially in Central and Eastern Europe is built around the German productive structure. Mexico has increased its proximity to the US and it is now in its close orbit, like - but to a lower extent - other Latin American countries. Instead, the position of China is less clear: other Asian countries, like Japan, contend its centrality, and China’s strong trade links with the US pull it away from its geographical neighbors. Overall, rather than a core-periphery conformation, with a highly connected group of central countries and a number of loosely connected nodes, there seem to be a multi-hub-and-satellites structure, with the Emerging countries assuming an intermediate position, and other developing countries at the periphery, which has become thinner.9
The visualization of the WTN shows some elements of the structure of the network and of the relative position of countries but needs to be integrated by less subjective statistical analysis.10
3.2
Network statistics: Centrality
The position of countries can be asserted through the use of local and global centrality measures, as in De Benedictis et al. (2014).
The network visualization of Figure3is based on the information included in Gt∗ = (Vt∗, L∗t), for t = 1995; 2010, where L∗t is binary - reporting the existence (L∗ijt= 1) or non-existence (L∗ijt= 0) of a trade link – and L∗t Lt.
9For a discussion on the difference of these network structures, seeNewman(2010) and
?.
10Any network visualization is prone the projection-bias associated the bi-dimensional
In the calculus of the relative position of nodes we need to exploit all the information included in the network: Nt = (Gt(Vt, Lt), Wt, Pt), where the
elements included in the line value function W indicate the strength of the link between country i and country j (e.g. the export volume).
The degree centrality, CD, is the simplest measure of the position of a node
in a network: it just counts the number of direct connections of a node, as we did already in the Introduction. Here we make use a normalized version of the degree centrality, using - for t = 1995; 2010 – the total number of possible neighbors excluding self, n − 1, as a normalized factor:
CDnout = Pn j6=iLij (n − 1) C n Din = Pn j6=iLji (n − 1) . (1)
This indicator ranges from 0 to 1: the more is the degree centrality close to 1, the more a country is directly connected to the rest of the network. In a directed network there will be two measures of degree centrality: in-degree centrality, measuring the number of arcs pointing to ego, and out-degree centrality, measuring the number of arcs exiting from ego.11
Moving to the weighted version of the network, we calculate the strength centrality, considering trade volumes instead of trade partnerships. Given the very strong heterogeneity among trade flows, strength centrality mea-sures will differ from degree centralities. Unweighted and weighted networks conceive different information (Newman,????).
In equation 2, the centrality measure are computed aggregating over of the weights of the arcs (export or imports flows) connected to the node and normalizing by (n − 1). The index we obtain is a measure of the out-strength and in-strength. CSnout = Pn j6=iWij (n − 1) C n Sin = Pn j6=iWji (n − 1) . (2)
If we normalize the in-strength and out-strength by total world trade (P i P jWij = P i P jWji) we obtain: CSP out = Pn j6=iWij P i P jWij CSP in = Pn j6=iWji P i P jWji , (3)
11 In the case of out-degree, Pn
j6=iLij is the total number of countries toward which
country i is exporting; in the case of in-degree,Pn
j6=iLjiis the total number of countries
which measure the strength centralities in percentage terms. Obviously, the measures defined in equation 3 are fully equivalent to the trade shares we examined in the Introduction: export market shares are a measure of (out)strength centrality.
The measure of global centrality that we use for comparative purposes with respect to out-strength centralities is the eigenvector centrality mea-sured over outgoing links. As we showed in Figure 3, it is not irrelevant for the relative position of a node if the same node is connected to central players or to peripheral ones. The basic idea, as stated in De Benedictis et al.(2014) is that “ ... a node’s eigenvector centrality is determined by the eigenvector centrality of its neighbors. It is not the country’s centrality itself that matters, what really matters is the centrality of the countries linked to him.12” The circularity of the argument is evident, but can be tackled using
some matrix algebra.
Starting from a binary trade-matrix, it is possible to use the Bonacich
(1987) eigenvector centrality to define the centrality of country i as the sum of the eigenvector centralities of its neighbors. That is:
CE(i) = Li1CE(1) + Li2CE(2) + · · · + Li(n−1)CE(n − 1) + LinCE(n). (4)
The system of equations can be rewritten in matrix form as:
(I − L)−C→E = 0, (5)
where I is a n × n identity matrix, L is the adjacency matrix of the trade network and −C→E is the n × 1 vector of countries’ eigenvector centralities.13
The weighted version of the out-eigenvector centrality measure, CN W Eout , is
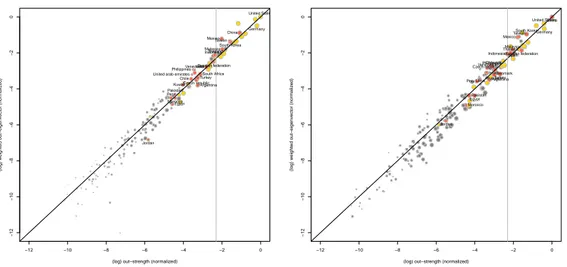
calculates using the trade data for 1995 and 2010 and is plotted on a log-log scale against the strength centrality in Figure 4.
The comparison of the local centrality, captured by the out-strength cen-trality (i.e. the export market shares), and the global cencen-trality, measured by the weighted out-eigenvector centrality, shows how the two measures are correlated in such a dense network as the WTN, both in 1995 and in 2010. The dots representing the various countries grouped within OECD, Emerg-ing and Others nicely align along the 45 degree line in the left and in the
12 In general, countries with a high value of eigenvector centrality are the ones which
are connected to many other countries which are, in turn, connected to many others.
13 Equation 5 is the trade-matrix characteristic equation for an eigenvalue λ=1. See
Figure 4: Comparing local and global centralities: 1995 and 2010 −12 −10 −8 −6 −4 −2 0 −12 −10 −8 −6 −4 −2 0
(log) out−strength (normalized)
(log) w eighted out−eigen v ector (nor maliz ed)
United arab emirates Argentina Chile China Czech republic Germany Egypt Indonesia India Jordan South Korea Kuwait Morocco Mexico Malaysia Pakistan Peru
Philippines Russian federation Thailand Turkey Taiwan United States Venezuela South Africa −12 −10 −8 −6 −4 −2 0 −12 −10 −8 −6 −4 −2 0
(log) out−strength (normalized)
(log) w eighted out−eigen v ector (nor maliz ed) Argentina Chile China Czech republic Germany Denmark Egypt Spain Hungary Indonesia Israel Jordan South Korea Libya Morocco Mexico Malaysia Pakistan Peru Philippines Russian federation Thailand Turkey Taiwan United States Venezuela
Source: Authors’ elaboration on ComTrade database. The local (horizontal axis) and global centralities (vertical axis) in 1995 are plotted on the left, while equivalent for 2010 are plotted on the right. The size of the circle associated to each country is proportional to indegrees. Different colors correspond to different country groups: OECD (yellow), Emerging (red) and Others (gray).
right panes of Figure 4. At the same time there is quite a bit of variabil-ity around that very line. Local and global centralities correlate, less so for some countries. Whether OECD countries tend to align, Emerging countries distinguish themselves from Others because they tend to group above the 45 degree line, while the latter tend to place themselves below the line in greater number.
The simple interpretation of being below or above the line is based on the value that neighbors have in increasing the centrality of a country. Countries above the line receive a plus from their neighbors, the ones below receive a penalization. China appears unaffected, being in itself much more central than most of its neighbors. Instead, Mexico’s eigenvector centrality is posi-tively affected by the high centrality of its most important neighbor, the US, suggesting that it is getting an advantage from being a satellite of the US economy. And Mexico is maintaining its rank among the Emerging countries in spite of a degree centrality much lower in 1995 that other Emerging coun-tries. The same seems to be true for South Korea, Chile, Venezuela and the Philippines (see Figure 4). Less so for Argentina, Egypt or Jordan.14
14 Most European countries are below the 45 degree line, indicating that they hold
3.3
Regressions
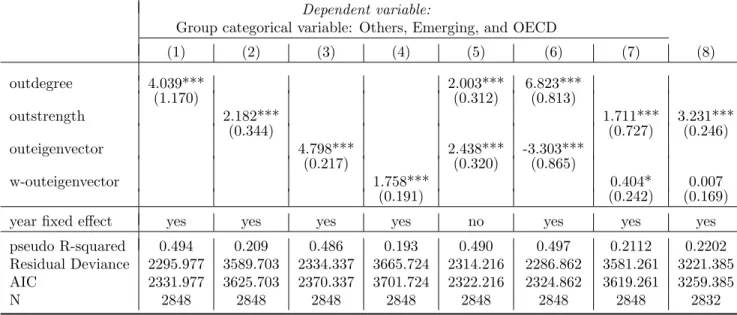
How relevant is the position of the Emerging countries in the WTN in af-fecting their economic performance? To address this question, we test the conditional correlation between the centrality indices discussed above with other economic variables. As a first step, we verify that the position of coun-tries in the WTN (and not only their export market share) is a good indicator of a country being or becoming Emerging. From the results of the propor-tional odds logistic regressions reported in Table2, we observe a positive and significant correlation between the probability of being an Emerging country and outdegree or outeigenvector centrality, both weighted and not.
Taking into account the general tendency to increase connectivity along time - that is controlled for by the use of year fixed effects – the increase of outdegree by one standard deviation makes 4.039 times more likely to be in a higher category, as shown in column 1 of Table 2.15 The corresponding
predicted probability when oudegree is at mean value is for an OECD country 0.13, while the one of being and Emerging country is 0.15, and the one of being an “Others” is 0.71. In other terms, the former two categories tend to be more connected than a random country in the latter category. The marginal effects indicate, in fact, that the change in probability when outdegree increases by one standard deviation is -0.170 for “Others”, 0.022 for “OECD” and 0.148 for “Emerging’,’ much higher for this latter category. Qualitatively similar results are obtained with the other centrality measures (columns 2, 3, and 4 in Table 2). Interestingly enough, unweighted centrality measures (columns 1 and 3 of Table 2) result in similar probabilities and similar fitting of the model, the same being true for the weighted centrality measures (columns 2 and 4 of Table 2), resulting in lower probabilities and lower fitting.
When the model includes both local and global centralities, the general picture is confirmed. In column 5, we report the outcome of the proportional
be the result of the high level of regionalization of European trade. Instead, among OECD countries, Canada is above that line, thanks to their strong ties to the USA. Most smaller and less developed countries are below the line and have a small number of trade links: they still have relatively small market shares, but more than that, they are not well connected and often not to the main traders.
15Being the dependent variable an ordered variable taking value 1 if the country is in
the “Others” category, 2 if the country is “Emerging”, and 3 if the country is “OECD,” the odds of moving to an higher category is 304% (e.g. (4.039 - 1)×100) when the variable oudegree increases by one standard deviation.
Table 2: Emerging countries: Proportional odds logistic regressions
Dependent variable:
Group categorical variable: Others, Emerging, and OECD
(1) (2) (3) (4) (5) (6) (7) (8) outdegree 4.039*** 2.003*** 6.823*** (1.170) (0.312) (0.813) outstrength 2.182*** 1.711*** 3.231*** (0.344) (0.727) (0.246) outeigenvector 4.798*** 2.438*** -3.303*** (0.217) (0.320) (0.865) w-outeigenvector 1.758*** 0.404* 0.007 (0.191) (0.242) (0.169)
year fixed effect yes yes yes yes no yes yes yes
pseudo R-squared 0.494 0.209 0.486 0.193 0.490 0.497 0.2112 0.2202
Residual Deviance 2295.977 3589.703 2334.337 3665.724 2314.216 2286.862 3581.261 3221.385
AIC 2331.977 3625.703 2370.337 3701.724 2322.216 2324.862 3619.261 3259.385
N 2848 2848 2848 2848 2848 2848 2848 2832
Note: ∗p<0.1;∗∗p<0.05;∗∗∗p<0.01. All centrality measures are standardized. Bootstrapped standard errors (1000 number of replications) in parenthesis.
odds logistic regression when outdegree and outeigenvector centralities are included as regressors. In absence of time fixed effects the coefficients of the two unweighted centrality measures add up to a probability very close to one of column 1 or column 3. When a time fixed effect is included, as in column 6, and the general tendency of increasing trade connectivity is controlled for, the two coefficients show opposite signs. Il is possible to further qualify this issue looking at the marginal effects for the three categories: the change in probability when outdegree increases by one standard deviation is negative for “Others” (-0.441) and positive for the other two categories (0.385 for “Emerging” and 0.056 for “OECD”); on the other hand, change in probability when outeigenvector increases by one standard deviation is positive for “Others” (0.214) and negative for the other two categories (-0.187 for “Emerging” and -0.027 for “OECD”). Countries in the “Others” category seems to be characterized by different structural position with respect to the other two categories. The “Emerging” seems to be the most sensitive category to change in centrality, both local (with a positive marginal effect) and global (with a negative marginal effect). The results in terms of weighted centralities show the relevance of the intensive margin of trade.
Considering the marginal impact of centrality on each ordered category of countries, we see that the stronger impact for all indicators is always on the Emerging group, confirming that a relevant position in trade, in particular access to relevant export markets - as a hub or as a satellite - is a relevant feature of an emerging economy. We also verify how the resulta are driven by the special case of China, removing China from the sample (column 8 in Table
2). In this last case, the w-outeigenvector centrality becomes statistically insignificant showing the role of China as a hub, also for other Emerging countries.16
Having confirmed the relevance of trade, we then test the correlation between a country’s centrality in the WTN and the most general indicator of economic performance, that is GDP growth. It is never easy to specify correctly a growth regression, as a country’s growth is affected by such a
16 The marginal effects corresponding to the no-China case show that the change in
probability when outstength increases by one standard deviation is negative for “Others” (-0.691) and positive for the other two categories (0.438 for “Emerging” and 0.254 for “OECD”); while the change in probability when w-outeigenvector increases by one stan-dard deviation is also negative for “Others” (-0.002), and positive for “Emerging” (0.001) and “OECD” countries (0.001). In all cases the marginal effect of global centrality is really very small.
Figure 5: Nonparametric unconditional relation between centrality and growth 0.0 0.2 0.4 0.6 0.8 1.0 −60 −40 −20 0 20 40 60 Outdegree centrality An nual rate of gr owth (fi ve years after) 0 2 4 6 8 10 12 14 −60 −40 −20 0 20 40 60 Outstrength centrality An nual rate of gr owth (fi ve years after) 0.02 0.04 0.06 0.08 0.10 0.12 −60 −40 −20 0 20 40 60 Out−eigenvector centrality An nual rate of gr owth (fi ve years after) 0.0 0.1 0.2 0.3 0.4 0.5 0.6 −60 −40 −20 0 20 40 60
Weighted Out−eigenvector centrality
An nual rate of gr owth (fi ve years after)
Source: Authors’ elaboration on ComTrade database and World Bank data on annual GDP growth. The four panels include different centrality indices (horizontal axes) plotted against annual GDP growth of countries, five years later (vertical axis). Different colors correspond to different country groups: OECD (yellow), Emerging (red) and Others (gray). Smoothing splines are plotted for every group of countries.
large set of factors that mis-specification and omitted variables are always a problem in this type of regression (Baldwin, 2004, Acemoglu, 2008). For this reason we try to be less restrictive as possible and we start from a simple bivariate non-parametric regression. As shown in Figure5, the scatter plots and the associated bivariate nonparametric regression don’t show a significant correlation between different centrality indices and annual GDP
growth after five years, for the whole sample of countries. This result is not surprising, as it is driven by the group of Other countries (in gray in Figure
5), making up the bulk of our sample, generally non-central and with very different growth performances over our observation period. But if we restrict the analysis to Emerging countries only (in red in Figure 5), we find that the general absence of a relation between eigenvector centrality and GDP growth is not confirmed for a subset of countries for which the correlation is inverted-U shaped. This result confirms not only the relevance of trade for emerging countries, but the important of choosing the appropriate partners and markets for export.
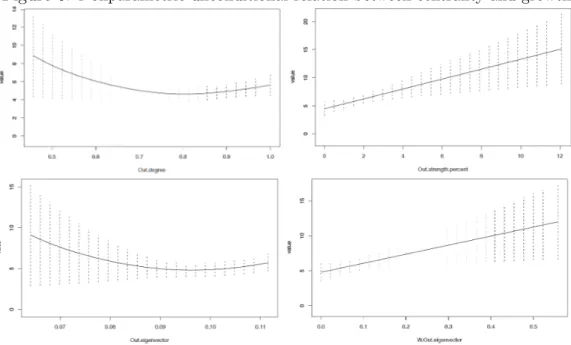
In Figure 6 we plot, just for the subsample of Emerging countries, the marginal effects of centrality measures on annual GDP growth after five years of a semi-parametric regression that includes year and country fixed effects. The bandwidth is set optimally and jointly including the role of fixed effects through aic expected Kullback-Leibler, as in Hurvich, Simonoff, and Tsai (1998). Once controlling for year and country heterogeneity through fixed effects, both outdegree and out-eigenvector centralities show a U-shaped relation: increasing the connectivity after being already connected with more than 50% of the countries in the WTN is negatively correlated with annual GDP growth. This is especially true for eigenvector centrality: connecting with central countries becomes effective only in a second stage. Finally, weighting both centrality measures with trade volumes shows that the effect is always positive on the intensive margin of trade, while it is non-linear in the extensive margin.
4
Concluding remarks
The analysis of the World Trade Network shows that relevant changes oc-curred in the last two decades and the changing position of emerging countries contributed significantly to the shift observed. Nowadays we observe a net-work composed by a system of hubs and satellites, with emerging countries occupying different positions in this structure. China has become one of the main hubs, but a few other emerging countries play the role of regional hubs. Instead other emerging countries appear as satellites, like Mexico, be-ing strongly linked to important central markets. In any case, the analysis confirms the crucial role of trade links for emerging economies. The WTN position can be relevant for a country’s growth, but at this stage it is still
Figure 6: Nonparametric unconditional relation between centrality and growth
Source: Authors’ elaboration on ComTrade database and World Bank data on annual GDP growth. The four panes include different centrality indices (horizontal axes) plotted against annual GDP growth of countries, five years later (vertical axis). Different colors correspond to different country groups: OECD (yellow), Emerging (red) and Others (gray). Smoothing splines are plotted for every group of countries.
impossible to establish a robust relationship between the two variables at a global level, as many nodes in the WTN are still in uncertain positions. But a positive relationship between centrality and growth can be found for emerging countries, confirming the existence of a relationship between trade and growth as far as the intensive margin of trade is concerned. Observing the recent evolution of the WTN, we can expect that emerging economies will shape the trade network still for quite some time.
References
Acemoglu D. (2008) Introduction to Modern Economic Growth, Princeton University Press.
Aggarwal R. and Goodell J.W. (2008) Equity premia in emerging markets: National characteristics as determinants, Journal of Multinational Finan-cial Management , 18, 4, 389 – 404, international Influences on Asset Mar-kets.
Baldwin R. and Lopez-Gonzalez J. (2015) Supply-chain trade: A portrait of global patterns and several testable hypotheses, The World Economy, 38, 11, 1682–1721.
Baldwin R.E. (2004) Openness and growth: Whats the empirical relation-ship?, in: Challenges to Globalization: Analyzing the Economics, Baldwin R. and Winters L., eds., University of Chicago Press.
Barro R.J. (1991) Economic growth in a cross section of countries, The Quar-terly Journal of Economics, 106, 2, 407–443.
Bhattacharya K., Mukherjee G., Sar¨amaki J., Kaski K. and Manna S. (2008) The international trade network: Weighted network analysis and modeling, Journal of Statistical Mechanics: Theory Exp. A, 2, P02002.
Bonacich P. (1987) Power and centrality: A family of measures, American journal of sociology, 92, 5, 1170–1182.
De Benedictis L., Nenci S., Santoni G., Tajoli L. and Vicarelli C. (2014) Network Analysis of World Trade using the BACI-CEPII Dataset, Global Economy Journal , 14, 287–343.
De Benedictis L. and Tajoli L. (2011) The World Trade Network, The World Economy, 34, 1417–1454.
Devereux M.B. and Mendoza E.G. (2006) Emerging markets and macroeco-nomic volatility: Lessons from a decade of financial debacles, Journal of International Economics, 69, 1, 1 – 5.
Fagiolo G., Schiavo S. and Reyes J. (2008) On the topological properties of the world trade web: A weighted network analysis, Physica A, 387, 3868–3873.
Fruchterman T.M. and Reingold E.M. (1991) Graph drawing by force-directed placement, Software: Practice and experience, 21, 11, 1129–1164. Gaulier G. and Zignago S. (2010) BACI: International Trade Database at
the Product-Level, CEPII Working Paper , , 23, 128.
Grossman G. and Rossi-Hansberg E. (2008) Trading tasks: A simple theory of offshoring, American Economic Review , 98, 5, 1978–1997.
Hanson G.H. (2012) The rise of middle kingdoms: Emerging economies in global trade, Journal of Economic Perspectives, 26, 2, 41–64.
Iapadre P.L. and Tajoli L. (2014) Emerging countries and trade regionaliza-tion. A network analysis, Journal of Policy Modeling, 36, 1, 89110.
Jain S.C. (2006) Emerging economies and the transformation of international business: Brazil, Russia, India and China (BRICs), Edward Elgar Pub-lishing.
Johnson R. and Noguera G. (2012) Accounting for intermediates: Production sharing and trade in value added, Journal of International Economics, 86, 2, 224–236.
Kearney C. (2012) Emerging markets research: Trends, issues and future directions, Emerging Markets Review , 13, 2, 159 – 183.
Kose M.A., Prasad E.S. and Terrones M.E. (2006) How do trade and financial integration affect the relationship between growth and volatility?, Journal of International Economics, 69, 1, 176 – 202.
Krapohl S. and Fink S. (2013) Different paths of regional integration: Trade networks and regional institution-building in europe, southeast asia and southern africa, Journal of Common Market Studies, 51, 3, 472–488. Newman M. (2010) Networks. An introduction, Oxford Univesity Press. Newman M.E.J. (????) Analysis of weighted networks.
Piccardi C. and Tajoli L. (2015) Are preferential agreements significant for the world trade structure? a network community analysis, Kyklos, 68, 2, 220–239.
Rodrik D. (2012) Unconditional convergence in manufacturing, The Quar-terly Journal of Economics, 128, 1, 165–204.
Vercueil J. (2012) Que nous apprennent les BRIC? Trois conjectures sur les conomies mergentes, Mondes en dveloppement , 2, 158, 25–34.
Zhou M., Wu G. and Xu H. (2016) Structure and formation of top networks in international trade, 2001–2010, Social Networks, 44, 9–21.