UNIVERSITY
OF TRENTO
DEPARTMENT OF INFORMATION AND COMMUNICATION TECHNOLOGY
38050 Povo – Trento (Italy), Via Sommarive 14
http://www.dit.unitn.it
Modelling Risk and Identifying Countermeasure in Organizations
Yudistira Asnar
Paolo Giorgini
July 2006
Modelling Risk and Identifying Countermeasure
in Organizations
?Yudistira Asnar and Paolo Giorgini
Department of Information and Communication Technology University of Trento, Italy
yudis.asnar,[email protected]
Abstract. Modelling and analysing risk is one of the most critical ac-tivity in system engineering. However, in literature approaches like Fault Tree Analysis, Event Tree Analysis, Failure Modes and Criticality Anal-ysis focus on the system-to-be without considering the impact of the associated risks to the organization where the system will operate. The Tropos framework has been proved effective in modelling strategic terests of the stakeholders at organizational level. In this paper, we in-troduce the extended Tropos goal model to analyse risk at organization level and we illustrate a number of different techniques to help the an-alyst in identifying and enumerating relevant countermeasures for risk mitigation.
Keyword: risk analysis, countermeasure identification, goal modelling
1
Introduction
Software systems are more and more part of our life (look how many computers and electronic gadgets are around us), and very often they have a strong influence in our daily life decisions. Considering software systems as integral and active part of the organization introduces the needs of including the software develop-ment as part of the organizational developdevelop-ment. In this direction, some software engineering methodologies have been proposed (e.g., Tropos [1] and KAOS [2]) to capture relationships between system-to-be and the organizational setting since the early phases of software development. Traditional techniques for modelling and analysing risk, such as Fault Tree Analysis (FTA) [3], Event Tree Analysis (ETA) [3], Failure Mode Effect and Criticality Analysis (FMECA) [4], are com-monly used in Reliability and Safety community. Unfortunately, these techniques are not conceived to model risks at organizational level and they focus mainly on risks at the system level.
In this paper we present a modelling and reasoning framework that considers risk (in more general uncertain event) at organizational level. Several models
?Presented in International Workshop on Critical Information Infrastructures
have been proposed in literature to represent the intentions of the stakeholders in an organization, such as Tropos/i* [1, 5], KAOS [6], GBRM [7], and ERM-COSO [8]. We propose a framework, called Goal-Risk Model, that extends the Tropos methodology [9, 10] with three basic layers (i.e., goal, event, and treat-ment). The framework introduces also number of techniques to analyse risk and identify countermeasures. The rest of the paper is organise as follows. Section 2 overviews briefly about Goal-Risk framework introducing the London Ambu-lance Service (LAS) [11, 12] case study, then using this framework we define several categories of countermeasures that can be applied as a part of the solu-tion to protect an organizasolu-tion from its risks. We define the guidelines to choose and model them in Section 3 and draw an example in LAS and Vehicle com-pany case study. Finally, we conclude the paper and outline the future work in Section 4.
2
Tropos Goal-Risk Framework
Tropos goal model [9, 10] proposes a formal framework to do requirement anal-ysis by refining stakeholders’ goals and ending up with the elicitation of the requirements. The framework results in a number of goal models represented as graphs hG, Ri, where G are goals and R are relations (decomposition or contribution relations). In Tropos, a goal is defined as a strategic interest of a stakeholder that intended to be achieved [1].
Each goal has two attributesSAT- Sat(G) andDEN- Den(G) , which quantify the value of evidence for the goal being satisfied and denied, respectively1. The
values of the attributes are qualitatively divided in the range of (F)ull, (P)artial,
(N)one. These attributes can infer the probability of the goal to be satisfied and
denied.
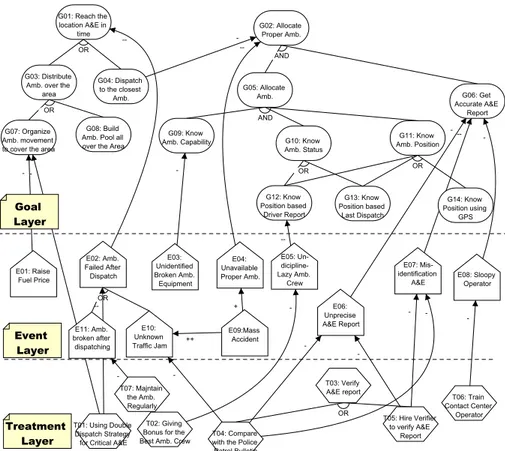
Goal analysis in Tropos starts with a number of top goals (i.e., ellipse in Fig. 1) of stakeholders and each of them is refined by decomposition (AND or OR) into subgoals. For example, consider in modelling the strategic objectives of London Ambulance Service (LAS) where an ambulance needs to reach the location of Accident and Emergency (A&E) in time (Fig. 1). The goal reach the location A&E in time can be achieved by distributing ambulance over the area or dispatching the closest ambulance from the A&E location to handle the accident. Moreover, distributing ambulance over area can be achieved either by organizing the movement of ambulance s.t. cover all the area or by building many ambulance pool all over the area. This decomposition and refinements will continue until the goals are considered tangible goals, i.e., when there is an actor that can fulfil the goal.
Moreover, Tropos goal analysis allows the analyst to model the influence of the satisfaction (denial) of a goal to the satisfaction (denial) of other goals. This influence can be positive or negative and is graphically indicated by “+/−”
1 There is no relation between SAT and DEN, unlike Probability Theory P’(x) = 1
Fig. 1. London Ambulance Services (LAS) Case Study
contribution relations. Tropos also has “++” and “−−” to express strong
posi-tive contribution and strong negaposi-tive contribution, respecposi-tively. For example, the
goal, applying dispatch to the closest ambulance from the A&E location to reach the location in time, can result the assigned ambulance is not the most appro-priate one, indeed the closest ambulance could be not equipped to handle that particular accident (i.e., dispatch to the closest ambulance from the A&E location gives “−” contribution to the achievement of goal allocate the proper ambulance). We extend the Tropos goal model [9, 10] introducing two new entities: event2
(e.g., risk, opportunity) and treatment (e.g., tasks, countermeasure, mitigation). This allows for modelling uncertain events, mainly risks, that can influence the fulfilment of one or more goals, and treatments that are needed to manage the effect of risks. Each entity has a separate layer of analysis as shown in Fig. 1: Goal layer, Event layer, and Treatment layer.
2 a risk is defined as an uncertain event with negative impact and an opportunity with
The analysis starts identifying a relevant event or an uncertain circumstance, depicted as pentagon in Fig. 1, that can influence the fulfilment of a goal in the goal layer. Top events are decomposed and related one to another with contri-bution relations. A top-event is identified applying the approaches proposed in literature, such as obstacle analysis in KAOS [13], taxonomy-base risk identifica-tion [14], or Risk in Finance [15]. We represent likelihood as the level of evidence that supports or prevents the occurrence of an event (SATorDEN), and the level of influence or impact of an event is encoded as the type of contribution relation between events and goals.
An event can influence more than one goal and one event can be considered as a risk for certain goals and, at the same time, as an opportunity for other goals. For instance in LAS of Fig. 1, the risk of failure in contact center computer system is a risk that obstructs the achievement of the goal allocate ambulance properly because LAS can not know the status of current ambulance. However, the event can also be seen as an opportunity for the goal having reliable manual standard operating procedure (SOP) for A&E, because it can give the opportunity to exercise the manual SOP. Events refinement continues until leaf-events are assessable (i.e., we can assess the likelihood of leaf-event) and the analyst ensures that each leaf-event is mutually exclusive. When a risk obstructs a goal, the denial evidence-DENof being fulfilled is added.
Once the events have been analysed, the analyst identifies and analyses the countermeasures (denoted as hexagon in Fig. 1) to be adopted in order to miti-gate the risks. We categorise a countermeasures into five categories: avoidance, prevention, alleviation, detection, and retention (the guidelines for choosing among the categories are presented in the next section). A countermeasure can be realised in two different ways: reducing the likelihood or reducing the impact [16]. In this work, we concentrate on modelling a countermeasure that reduces the likelihood of risk. Similarly for goals and events, we use SAT and DEN to rep-resent the evidence that supports and prevents a treatment/countermeasure to be successfully executed, called success-rate. A countermeasure effects the event layer, and in particular risks. We represent the effect of a countermeasure as a relation, where its strength is expressed by the type of contribution relations. For instance in Fig. 1, the countermeasure maintaining ambulances regularly re-duces the risk of having ambulance is broken after receiving A&E dispatch, which is denoted by “−” contribution. A countermeasure mitigates a risk by adding (propagating) evidence for the risk denial-DEN.
In our model, we also allow for relations between the treatment layer and the goal layer. This is useful to model situations where a countermeasure adopted to mitigate a risk has also a contribution (especially negative effects) to some goals. For instance in Fig. 1, the countermeasure double-dispatch ambulances for critical A&E can reduce the likelihood of the risk of ambulance failed to reach location after dispatch because there are 2 ambulances that dispatch to handle a critical A&E. This countermeasure leads to the difficulties in achieving the goal organizing the movement of ambulance s.t. cover all the area, because the
countermeasure needs a greater number of ambulances than in the case of normal strategy.
The idea of model separation into 3 layers makes a flexibility in interchang-ing the model language in each layer, as far as the model still has the same intuition (e.g., model for goal layer is to represent the structure of the needs of the stakeholders). This flexibility helps the modeller that has already had prior experience in a particular modelling framework to reduce the learning cost. For instance, reliable engineers have been familiar with FTA [3] s.t. they can use FTA in event layer, or enterprise risk analysts are well train to build COSO-Objective model [8], then they can use that model instead of Tropos goal model. However, semantic re-definition of relations between layer are needed to be done to adopt those modelling frameworks.
When the model has been fully developed, we start analysing the model and eliciting the most reasonable solution to fulfil the stakeholders’ goals and satisfy certain preference (e.g., minimizing the total cost). A solution consists of the leaf-goals that need to be fulfilled, the treatments which need to be employed to manage the risks, and the total cost (leaf goals and treatments). The steps of analysis are the following:
Find alternative solutions, Stakeholders define their targets in terms of as-signment ofSATvalues to top-goals. Backward reasoning, as presented in [10], is used to search all the possibleSAT/DENvalues assignments for leaf-goals that satisfy the stakeholder’s targets. These assignments are called alterna-tive solutions.
Evaluate alternative solutions against relevant risks, Stakeholders define the acceptable level of risk, in terms of assignment ofDENvalues to top-goals. Forward reasoning, as presented on [9], is used to propagate theSAT/DEN
values of risk on the goal layer. If the level of risk of top-goals are below the acceptable level of risk (namely, if they produce DEN values for top-goals less than theDENvalues specified by the stakeholders) then the alternative solution is considered as a candidate solution. Conversely, if theDENof top-goals are higher than the acceptable level of risk, then we move to the next step.
Assess countermeasures to mitigate risks, Combination of countermeasures are identified to reduce the effects of risk of an alternative solution such that it becomes acceptable for the stakeholders. The alternative solution and the combination of countermeasure are considered as a candidate solution. After identified “all” the candidate solutions, we evaluate them adopting the “minimal cost” criteria as a preference. The candidate solution with the cheapest cost, in terms of total cost of the leaf-goals and the necessary countermeasures, is the selected solution to be implemented. The complete framework of Tropos Goal-Risk (i.e., semantic definitions, reasoning mechanisms, analysis guidelines) has been defined in [17].
3
Countermeasure Identification
As mention before, in this paper we also provide the guidelines to identify coun-termeasures, in particular countermeasures that reduce the likelihood of risk. There are two ways to manage a risk: one can choose alternative goals with free of risk (avoidance) or trying to anticipate the risk with the countermeasures.
We categorise treatments into 5 categories of measure that can be used to manage the risk: avoidance3, prevention, alleviation, detection, and retention.
The order of the categories can also be seen as the steps in eliciting the treat-ments. First, the analysts try to find the way to avoid the risks, if it is not possible then they should try to prevent the occurrence of the risks. If the pre-vention measures are not adequate, then they try to identify the alleviation measures. If it is still not adequate, then they have to identify the detection measures, otherwise the organization should be prepared to retain the risk.
In the next sub-section section, we detail the measures by specifying what are the characteristics of the goal-risk model that can lead the analyst in choosing the proper category of measure and what are the consequences (advantages and drawbacks) of each category. In the model, goals, events and treatments are characterised as follows:
– Goal (i.e., leaf goal in goal layer): the importance of a goal from the stake-holder point of view and its fulfilment type (i.e., achieve goal, maintain goal, and achieve-maintain goal [18]);
– Event (i.e., top event in event layer): the impacts and the likelihood of the event, the structure of event tree in event layer, and the type of risk (e.g., avoidable, preventable, reducible);
– Treatment (i.e., leaf treatment in treatment layer), the success rate in miti-gating the risk, the cost of the treatment, and the probability of cost.
3.1 Avoidance
It defines as an activity that tries to achieve the stakeholders’ goals by choosing a risk free alternative.
Characteristics of the model The goal fulfilment results being very important for
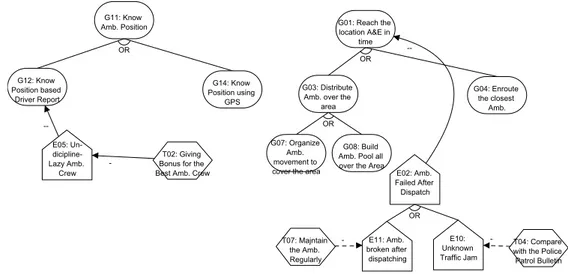
the stakeholder, and most of the time the goal is categorised as a maintain goal or an achieve-maintain goal (i.e., the goal that needs to be fulfilled from certain time until the future). Thus, the analyst has to ensure its fulfilment during the time. For example in Fig. 2, the stakeholder can fulfil the goal knowing ambulance position (G11) by means of choosing knowing ambulance position from
driver’s report (G12) or knowing from Global Positioning System (GPS) (G14) .
In this scenario, the modeller choose G14 instead of G12 because G11
needs to be fulfilled all over the time. However, this category of measure can not always being elicited, while there could exist a circumstance where there are no alternatives to fulfil the goal with risk-free.
Fig. 2. Avoidance Means Fig. 3. Prevention Means
Consequences There is no need to introduce any treatment and/or additional
cost to use countermeasures. The only possible drawback of this category is that the risk-free alternative could be more costly than the total cost for the risky alternative and relative countermeasures. For instance, the cost of G14 is much
higher than the cost G12 and its treatment (e.g., T2).
3.2 Prevention
This category aims at preventing the risk occurrence by employing certain mea-sures. Preventing risk means reducing the risk until an acceptable value for the fulfilment of stakeholders’ goals. This measure operates mitigating leaf-events.
Characteristics of the model The risk obstructs significantly the stakeholders’
goals and it results unavoidable. This category of measure is carried on by re-ducing the likelihood of related leaf-events s.t. the likelihood of the top-event is also reduced. To identify the related leaf-events, we use the same technique that commonly used in defining minimal cut-set in FTA [3]. For instance in Fig. 3,
T7 and T4 try to prevent E2 occurrence by mitigating all the leaf-events of
E2 which are E10 and E11. This category is less efficient while meeting the
risk/top-event with many alternative occurrences (or-decomposition), because the risk will be really reduced when we prevent all the leaf-events from risk (as we have seen in the example, we need to prevent two events in order to mitigate an event).
Consequences Differently from avoidance, here it is not possible to guarantee
mitigate the risk. This category is not suitable for mitigating the unlikely risk, because it has to be taken before the risk occurs, and frequently, the organization does this measure as part of their daily activity even the likelihood of risk is low.
3.3 Alleviation
This measure intends to reduce the risk/top-event by employing a countermea-sure over the top-event. This meacountermea-sure does not intend to prevent the risk to be developed (i.e., the occurrence sub-events), it just mitigates top-events that impact directly to the goals fulfilment.
Fig. 4. Alleviation Means
Characteristics of the model The analyst can not find any measures from the
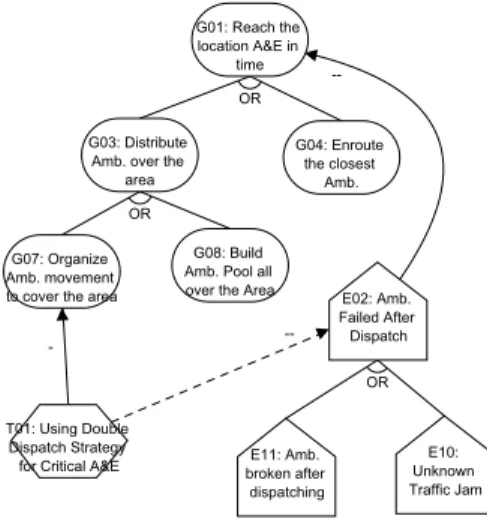
previous categories and then introduces a new treatment. For instance in Fig. 4,
E2 can be caused by E10 or E11 and the analyst mitigates E2 introducing
T1. In this scenario, the analysts can not prevent the occurrence of E10 and
E11, and they argue that it is fine having high-risk at E10 and E11 as far
as they can contain E2 on low-risk. This type is suited for circumstances in
which there are many leaf-events that need to be mitigated to prevent a top-event and thus the total cost of mitigating risk is not economical as we mention in prevention measure.
Consequences Once the measure fails to mitigate the event than the
top-event will impact to the goal layer severely without any mitigation. Unlike, in the prevention category, a failure in a countermeasure can be compensated by
the effect of other countermeasures, because prevention measures, typically, are employed as a group. This measure is recommended to be applied when the an-alyst is really satisfied with the success-rate of the countermeasure in mitigating the risk. The probability of cost follows the likelihood of top-event/risk, which is usually less or equal than the likelihood of its sub-events. The measure is very suitable for the unlikely risks.
3.4 Detection
This category mitigates an intermediate event in the event tree so to reduce the risk/top-event. The advantage of applying this category is that there is a chance that several top-events share intermediate-event so mitigating an intermediate event can consequently reduce several risks/top-events at the same time.
Fig. 5. Detection Means
Characteristics of the model The event-trees of the risk layer share
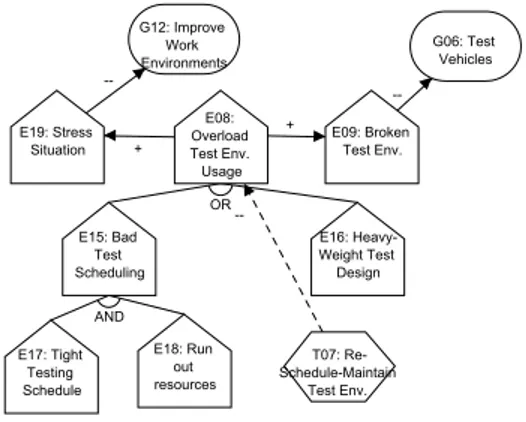
intermediate-event/sub-tree. Mitigating risks/top-events can be done employing a counter-measure over the shared intermediate-event and consequently, reducing several risks/top-events. Suppose, we are the managers of a vehicle testing plant (Fig. 5) and we need to ensure that the plant performs test vehicle (G6) correctly.
More-over, we need to improve the situation of work environments (G12) so to maintain
quality of employees. As you see in Fig. 5, each goal has own risk, and in-terestingly there is a common sub-tree from these risks, namely overload test environment usage (E8). By re-schedule and maintain test environment (T7), it will
reduce, hopefully, the likelihood of overload test environment usage (E8).
Con-sequently, E8 reduces the possibility of stress condition (E19) for employees,
which in turn can obstruct the achievement goal G12. E8 also reduces the
chance of having broken test environment (E9) that could lead to the denial of
Consequences Very bad consequences if the measure fails to reduce an
interme-diate event. Indeed, it results in the obstruction of one or more goals. Therefore, the analyst has to be aware of the final consequences if the countermeasure fails and how much the success rate of the countermeasure is, before choosing this type. The probability of cost of the detection measures follows the likelihood of its intermediate event (i.e., equal or higher than likelihood of top-events, and equal or less than likelihood of leaf-events).
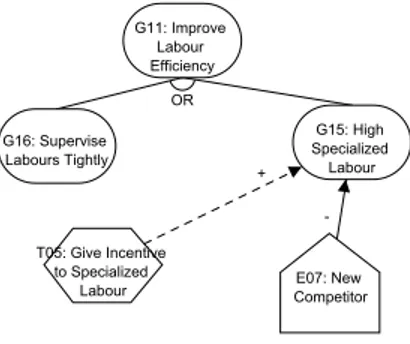
3.5 Retention
It is the last alternative to deal with risks, once we can not find any treatments from the previous types.
Fig. 6. Retention Means
Characteristics of the model It is used when the organization does not have the
capability to mitigate or control the risk (e.g., war, inflation, new competitor, natural disaster). The best thing that the organization can do is predicting the likelihood of risk and work for its consequences. For instance in Fig. 6, the risk of having new competitor (E7) is beyond the control of the company and it could
obstruct the goal of having high specialized labour (G15) because the competitors
can give a better offer to the specialize labour. The only thing that the company can do is trying to give incentive for specialized labour (T5) s.t. the achievement of
G15 is maintained. Transferring the risk to an insurance company, restore the
obstructed goals, and design fault tolerance system can be categorised in this type, because they neither reduce the likelihood nor the effects of risks, rather they just repair the consequence of the risk.
Consequences There will be a certain period of time where the goal might be
un-satisfied before it is restored. Besides that, this measure can be seen as a mean to fulfil the goal besides as a treatment for the risk.
4
Conclusions
In this paper, we have presented a framework to model and reason about risk within the early phase of the system development. We have adopted and
ex-tended the Tropos goal modelling framework to analyse, evaluate, and select risk among the alternatives that are able to fulfil the stakeholders’ goals and satisfies the preference (e.g., minimizing the total cost). The framework elicits a solution that is not only based on the stakeholders’ goals but it also anticipates the existence of malicious events by introducing several treatments to manage their impacts. Therefore, the solution from 3-layers model is more robust com-pared to the solution that comes from the goal model.
The paper has also presented different categories of measures that typically are used to deal with the existence of risks in organizations. They are categorised as: avoidance, prevention, detection, alleviation, and retention. The analyst must understand the characteristics of the model before choosing them, especially pre-vention, detection, alleviation, and be aware of their consequences. Differently, an avoidance measure is usually chosen if it is feasible finding risk-free alter-native, and a retention measure is the last option if there is no other type of measures which fits with the model.
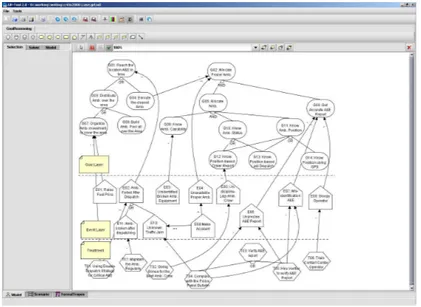
The framework has been implemented as an extension of the Goal Reasoning Tool4(GR-Tool), shown in Fig. 7. The tool is graphical tool in which it is possible
to draw the extended goal models and analyse them.
Fig. 7. Extended GR-Tool for Goal-Risk Modelling
Finally, as future work we want to propose also a quantitative reasoning mechanisms where evidence is expressed in term of probability model. The idea is to propose something similar to what have been already developed for the Tropos goal models.
Acknowledgement
This work has been partly supported by the projects EU-SERENITY, FIRB-ASTRO, PAT-MOSTRO, PAT-STAMPS.
References
1. Bresciani, P., Perini, A., Giorgini, P., Giunchiglia, F., Mylopoulos, J.: Tropos: An Agent-Oriented Software Development Methodology. Autonomous Agents and Multi-Agent Systems 8(3) (2004) 203–236
2. van Lamsweerde, A., Letier, E.: Handling Obstacles in Goal-Oriented Require-ments Engineering. IEEE Transaction Software Engineering 26(10) (2000) 978– 1005
3. Stamatelatos, M., Vesely, W., Dugan, J., Fragola, J., Minarick, J., Railsback, J.: Fault Tree Handbook with Aerospace Applications. NASA (2002)
4. DoD: Military Standard, Procedures for Performing a Failure Mode, Effects, and Critical Analysis (MIL-STD-1692A). U.S. Department of Defense (1980)
5. Yu, E.: Modelling Strategic Relationships for Process Engineering. PhD thesis, University of Toronto, Department of Computer Science (1995)
6. Dardenne, A., van Lamsweerde, A., Fickas, S.: Goal-Directed Requirements Ac-quisition. Science of Computer Programming 20 (1993) 3–50
7. Anton, A.I.: Goal-Based Requirements Analysis. In: ICRE ’96: Proceedings of the 2nd International Conference on Requirements Engineering, Washington, DC, USA, IEEE Computer Society (1996) 136
8. COSO: Enterprise Risk Management - Integrated Framework. Committee of Sponsoring Organizations of the Treadway Commission. (2004)
9. Giorgini, P., Mylopoulos, J., Nicchiarelli, E., Sebastiani, R.: Formal Reasoning Techniques for Goal Models. Journal of Data Semantics (2003)
10. Giorgini, P., Mylopoulos, J., Sebastiani, R.: Simple and Minimum-Cost Satisfia-bility for Goal Models. In: CAISE ’04: In Proceedings International Conference on Advanced Information Systems Engineering. Volume 3084., Springer (2004) 20–33 11. LAS: London ambulance service - official website.
http://www.londonambulance.nhs.uk/ (2006)
12. Finkelstein, A.: Report of the inquiry into the london ambulance service. In: International Workshop on Software Specification and Design Case Study. (1995) 13. van Lamsweerde, A., Letier, E., Darimont, R.: Managing Conflicts in Goal-Driven
Requirements Engineering. IEEE Transaction Software Engineering 24(11) (1998) 908–926
14. Carr, M.J., Konda, S.L., Monarch, I., UlrichCarr1993, F.C.: Taxonomy-Based Risk Identification. Technical Report CMU/SEI-93-TR-6, ESC-TR-93-183, Software Engineering Institute, Carnegie Mellon University (1993)
15. Holton, G.A.: Defining Risk. Financial Analyst Journal 60(6) (2004) 1925 16. Feather, M.S., Cornford, S.L., Dunphy, J., Hicks, K.: A quantitative risk model for
early lifecycle decision making. In: Proceedings of the Conference on Integrated Design and Process Technology. (2002)
17. Asnar, Y., Giorgini, P., Mylopoulos, J.: Risk Modelling and Reasoning in Goal Models. Technical Report DIT-06-008, DIT - University of Trento (2006)
18. Fuxman, A., Kazhamiakin, R., Pistore, M., Roveri., M.: Formal Tropos: language and semantics. http://trinity.dit.unitn.it/∼tropos/papers files/ftsem03.pdf (2003)