Università di Pisa
Facoltà di Medicina e Chirurgia
Scuola di Specializzazione in Radiodiagnostica
Direttore Prof. Carlo Bartolozzi
Tesi di Specializzazione
Idiopathic pulmonary fibrosis, evaluation of progression and
prognosis after the ATS/ERS/JRS/ALAT statement 2011
Relatore:
Chiar.mo Prof. Carlo Bartolozzi
Candidata:
Dott.ssa Chiara Romei
Index
Abstract 3
Introduction 4
Objective 9
Patients and Methods 10
Results 12
Discussion
22
Conclusion 25
Abstract
Objectives
The prediction of usual interstitial pneumonia (UIP) progression and prognosis by the a application of HRCT criteria pattern recommended by ATS/ERS/JALAT guidelines 2011
Materials and methods
Two radiologists after assessing the baseline HRCT have distributed 70 patients affected by fibrotic idiopathic interstitial pneumonia (IIP) in three groups (UIP type= group 1, possible-UIP=group 2, inconsistence UIP=group 3) on the basis of 2011 guidelines. The different abnormalities (honeycombing, reticulation, ground-glass, bronchiectasis) were visually scored at baseline and during the follow-up (total HRCT 179). Overall CT score and fibrotic score (honeycombing plus reticulation) were calculated. The progression of the abnormalities and the correlation with mortality rate were assessed (Kaplan-Mayer survival estimates).
Results
The inter-observed agreement was substantial or almost perfect (k=0.73-0.85). Forty-four patients were classified into group 1, 13 into group 2 and 13 into group 3.
After a mean follow-up of 1386 days (DS 915), the mortality rate was significantly greater in the group 1 (18 died) versus group 2 and 3 (1 died each). In the group 1 patients whom showed at baseline a honeycombing rate greater than 25%, fibrotic score greater than 30, overall CT score greater than 45 and bronchiectasis in more than 4 lobes obtained the better prognostic value and significantly predicted mortality risk.
A significant increment of fibrotic score and honeycombing rate was demonstrated in the group 1 and 3 but not in the group 2. Honeycombing progression was quantified in 3 points/year for UIP type.
Conclusion
In our study HRCT criteria for UIP pattern on the basis of 2011 guidelines showed high accuracy in the risk stratification of patients with idiopathic pulmonary fibrosis (IPF).
Introduction
Idiopathic pulmonary fibrosis (IPF) is a chronic, progressive fibrosing interstitial pneumonia of unknown cause limited to the lungs. It belongs to a heterogeneous group of idiopathic interstitial pneumonias (IIP) (1).
The American Thoracic Society and European Respiratory Society (ATS/ERS) published an international consensus statement on the diagnosis and treatment of this disease in 2000 (2).
The statement recognized IPF as a clinical entity associated with the histopathologic and/or radiologic pattern of usual interstitial pneumonia (UIP). The definition of IPF required the exclusion of other form of interstitial pneumonia and known etiology such as environmental exposure, medication or systemic disease.
The incidence of IPF has been reported as 4.6 per 100,000 persons-years from a United Kingdom study (3)and between 6.8 and 16.3 per 100,000 persons using a large database of healthcare claims in United States (4).
The disease is characterized by unexplained chronic dyspnea, commonly presents with cough, bibasilar inspiratory crackles and finger clubbing. It is associated with progressive worsening of dyspnea and lung function and the median survival is poor. The incidence of the disease increases with older age, in particular in the sixth and seventh decades. These patients are more frequently men and smokers or ex-smokers (5).
Surgical lung biopsy and pathologic pattern of UIP is able to predict the mortality rate and the long-term outcome (6,7). Nevertheless, surgical lung biopsy is not frequently performed for the possible complications in patients with more advanced disease (8-11). For this reason, non-invasive evaluations have been suggested as alternative methods for diagnosis and prognosis in patients with typical HRCT pattern of UIP (12-14).
In 2011 American Thoracic Society published a new evidence-based guideline (15)on the diagnosis and management of idiopathic pulmonary fibrosis.
In this document the authors concluded that the diagnosis of IPF required: 1. The exclusion of other cause of interstitial lung disease,
2. The presence of UIP pattern on High-Resolution Computed Tomography (HRCT) in patients who ad not been subjected to surgical lung biopsy.
3. Specific combination of HRCT and surgical lung biopsy pattern in patients subjected to surgical lung biopsy.
The major and minor criteria for the clinical diagnosis of IPF have been eliminated.
These new guidelines have evidenced HRCT such as an essential component of the diagnostic pathway in IPF and have defined the criteria for UIP pattern, possible UIP pattern and inconsistent with UIP pattern as it shown in table 1.
Table 1. The HRCT criteria for UIP pattern on the basis of the ATS/ERS/JRS/ALAT 2011 guidelines.
American Thoracic Society Documents An Official ATS/ERS/JRS/ALAT Statement: Idiopathic Pulmonary Fibrosis: Evidence-Based Guidelines for diagnosis and management Am J Respir Crit Care Med, 2011; 183: 788-824
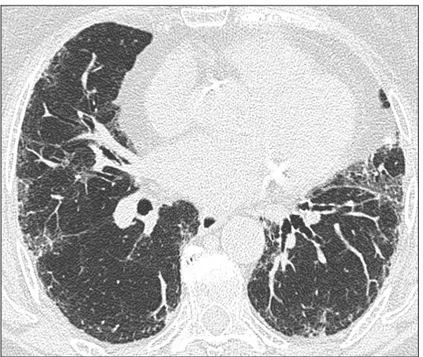
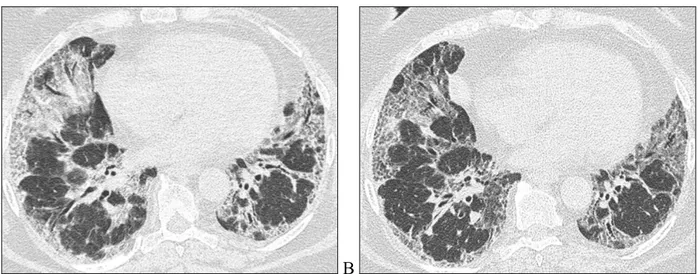
In according to table 1, UIP pattern is characterized by the presence of reticular opacities, traction bronchiectasis and honeycombing. As shown in figure 1, ground glass opacities are common, but less extensive than the reticulation, the distributions of these anomalies are basal, peripheral and often patchy. Honeycombing is critical for making a definitive diagnosis. If is absent, but the other criteria are present the imaging features are regarded as representing possible-UIP (figure 2) and surgical lung biopsy is necessary to make a definitive diagnosis.
Figure 1. HRCT images demonstrating UIP pattern in a patient classified into group 1 with extensive honeycombing.
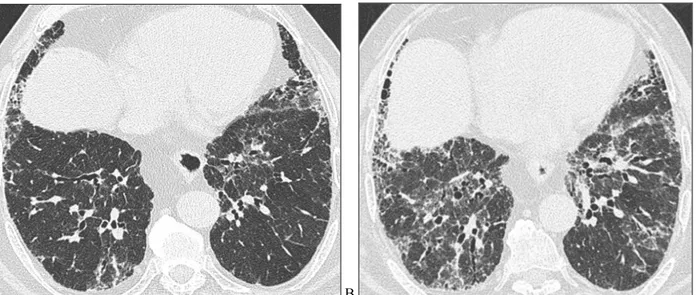
Figure 2. HRCT images demonstrating possible-UIP pattern in a patient classified into group 2 with a moderate amount
of ground-glass plus reticulation without honeycombing.
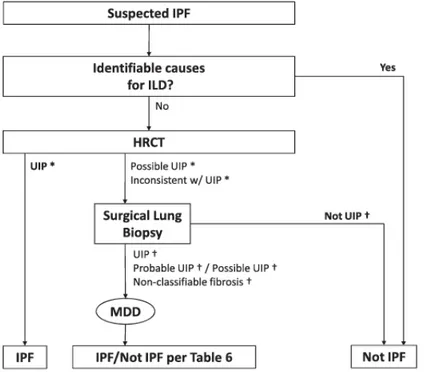
The positive predictive value of a HRCT diagnosis of UIP is high, but in patients whose HRTC does not demonstrate a UIP pattern, the surgical lung biopsy may still demonstrate UIP pattern on histopathology (Table 2 and Figure 3).
Table 2. Combination of HRCT and surgical lung biopsy for the diagnosis of IPF (requires multidisciplinary
discussion) on the basis of ATS/ERS/JRS/ALAT 2011 guidelines.
American Thoracic Society Documents An Official ATS/ERS/JRS/ALAT Statement: Idiopathic Pulmonary Fibrosis: Evidence-Based Guidelines for diagnosis and management Am J Respir Crit Care Med, 2011; 183: 788-824
Figure 3. Diagnostic algorithm for idiopathic pulmonary fibrosis (IPF) on the basis of ATS/ERS/JRS/ALAT 2011
guidelines. MDD = multidisciplinary discussion
American Thoracic Society Documents An Official ATS/ERS/JRS/ALAT Statement: Idiopathic Pulmonary Fibrosis: Evidence-Based Guidelines for diagnosis and management Am J Respir Crit Care Med, 2011; 183: 788-824
In the appropriate clinical setting, after a pulmonologist evaluation, the presence of a UIP pattern on HRCT is sufficient for the diagnosis of IPF, so the diagnostic algorithm no longer considers surgical lung biopsy essential for the diagnosis of IPF in those cases. In any other cases is useful refers to a multidisciplinary discussion involving pulmonologist, pathologist and radiologist to reach an accurate diagnosis of IPF.
Objective
The new guidelines emphasized the role of HRCT to correctly diagnose the UIP pattern, but the impact of this statement in the prognosis and life expectancy of patients has not been evaluated yet. The objective of this study is to determine if HRCT criteria for UIP pattern recommended by ATS/ERS/JRS/ALAT guidelines 2011 were accurate to predict disease progression and prognosis.
Patients and Methods
Patients
We conducted a retrospective study of 144 outpatients with diagnosis of interstitial lung disease who were admitted to Pisa University Hospital from January 1996 to February 2012. We excluded 8 patients with chemotherapy related interstitial pneumonia, 4 patients with post radiation therapy pneumonia, 17 patients with pneumoconiosis, 9 patients with clinical and serologic evidence of collagen vascular disease, 2 patients with a history of ARDS, 8 patients with sarcoidosis. We excluded 12 patients who did not complete clinical and radiological follow up. We eliminated also 14 patients; 12 without CT, 1 with lung cancer and 1 without certain diagnosis of interstitial lung disease.
All the 70 patients included in the study had received a diagnosis of fibrotic idiopathic interstitial pneumonia (IIP) according to the clinical manifestation and presence of a HRCT pattern showing reticular opacities and/or traction bronchiectasis in association with honeycombing or ground glass opacities on the basis of American Thoracic Society and European Respiratory Society International consensus statement 2002 (1).
The mean age at the time of the first visit was 69 years (range 51-88).
34 patients were non-smokers, 5 were smokers and 31 ex-smokers; 36 were males and 34 females. All the patients were treated with corticosteroid and acetylcysteine therapy, someone also with immunosuppressant.
Methods
Pulmonary function test (percentage of predicted FVC and carbon monoxide diffusing capacity), blood gas analysis, six minutes walking test, bronchoscopy, bronchoalveolar lavage, differential cell count, chest x ray and HRCT were performed at the first visit.
HRCT was performed with 1,0 mm thick sections taken at 1 cm intervals throughout the entire lung during inspiration in the supine position. Two radiologists after having assessed baseline HRCT
distributed 70 patients in three groups (UIP type= group 1, possible-UIP=group 2, inconsistence UIP=group 3) on the basis of ATS/ERS/JRS/ALAT 2011 guidelines. Discordant cases were discussed and a final decision was taken.
The radiologists made a subjective visually assessment, in % of the total lung section, of the overall extent of the pulmonary parenchymal abnormalities (overall CT score): the extent of ground glass opacity away from reticulation, the extent of ground glass opacity + reticulation, the extent of honeycombing and the number of lobes with traction bronchiectasis. The extent of the parenchymal abnormality was scored to the nearest 5% (16,17). A total fibrotic score was computed, as the sum of the honeycombing score and reticulation (with or without association of ground glass).
The different abnormalities were visually scored at baseline and during the follow-up (total HRCT 179).
The progression of the abnormalities and the correlation with mortality rate were assessed.
Pulmonary function test, blood gas analysis, six minutes walking test were performed every six months.
Statistical analysis
Data were expressed as mean. Continuous data were compared using ANOVA and multiple comparisons (Bonferroni test) and Mann-Whitney test. Survivals were compared using the log rank test and displayed using Kaplan-Meier curves. Cox regression analysis was used to identify significant variables predicting survival status. P<0,05 was considered statistically significant.
Results
The interobserved agreement between the two radiologists was substantial or almost perfect (k=0.72-0.85). In particular, the agreement was substantial for the fibrotic score (k=0.73), overall CT score (k=0.72), reticulation (k=0.79), bronchiectasis (k=0.80) and was almost perfect for honeycombing (k=0.84) and ground-glass (k=0.81).
Because the correlation between the 2 readers was high, following table shows the results only for the first reader.
At baseline forty-four patients were classified into group 1, 13 into group 2 and 13 into group 3. The baseline distribution of various abnormalities in the three groups and their statistical relevance was showed in table 3.
CT abnormalities and functional parameters -
mean (sd) UIP Possible UIP No UIP ALL Prob >F
n 44 13 13 70 Overall CT score 46.8 (15.3) 37.7 (16.8) 49.2 (21.8) 45.6 (17.1) 0,168 Fibrotic score 42.1 (14.4) 35 (15.4) 29.2 (19.0) 38.4 (16.1) 0,025 Honeycombing 24.1 (12.7) 5.0 (3.5) 10.4 (17.0) 18 (14.8) <0.001 Reticulation 18.1 (13.9) 30 (15.8) 18.8 (15.1) 20.4 (15.0) 0,04 Ground-glass 2.4 (6.8) 0.8 (1.9) 18.5 (16.7) 5.1 (10.9) <0.001 Bronchiectasis 4.5 (1.7) 3.4 (1.8) 3.7 (1.8) 4.1 (1.8) 0,09 SVC 78 (19.5) 72.3 (20.0) 75.2 (21.5) 76.4 (19.8) 0,575 FVC 74 (12.3) 70.2 (20.3) 69.5 (15.8) 72.4 (14.7) 0,709 DLCO 49.0 (15.8) 54.9 (19.1) 19.9 (24.1) 50.2 (17.9) 0,725 Fibrosis
Table 3. Distribution of HRCT abnormalities and functional parameters in the three groups and their statistical
relevance.
The difference of distribution of honeycombing score was significant (Bonferroni test) between group 1 and group 2 (p<0.001) and between group 1 and group 3 (p=0.003). The difference of distribution of reticulation was significant only between group 1 and group 2 (p=0.03); also the distribution of ground glass was significant only between group 1 and group 3 (p<0.001). The difference of distribution of fibrotic score was significant between group 1 and group 3 (p=0.03). Instead the distribution of overall CT score and bronchiectasis was not significant.
Also the distribution of functional parameters like FVC, SVC and DLCO was not significant. The evolution of HRCT abnormalities in each group was than assessed in the follow-up.
The number of total HRCT observed was 179, 103 belongs to the group 1, 37 to the group 2 and 38 to the group 3.
We demonstrated that honeycombing had a significant progression in the group 1 (p<0.01) (Figure 4) and in the group 3 (p<0,01) but not in the group 2 (figure 5). In the group 1 (UIP type) the honeycombing baseline percent score was 25% and the progression was quantified in 3 points/years (Table 4).
A B
Figure 4. HRCT images of a patient belonging to UIP group at the baseline (A) and after 1 year of follow-up (B). Axial
0 20 40 60 0 20 40 60 0 1 2 3 4 5 6 7 8 9 0 1 2 3 4 5 6 7 8 9
UIP Possible UIP
No UIP
Honeycombing Fitted values
years
Graphs by Fibrosis_type
Figure 5. Honeycombing score time relation evaluation plots.
honeycombing (UIP) coeff. p-value [95% Conf. Interval] years 3,01 <0.001 2.30 ─ 3.90
constant 25,1 <0.001 21.43 ─ 28.73
Table 4. Honeycombing regression model for panel data in UIP group.
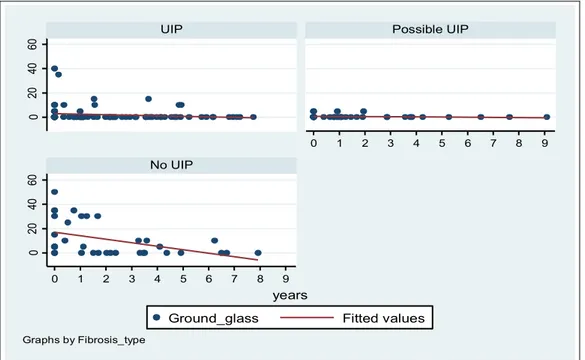
The time variation of ground glass was showed in figure 6 and was significant only in the group 3 (p=0.04) (Table 5). 0 20 40 60 0 20 40 60 0 1 2 3 4 5 6 7 8 9 0 1 2 3 4 5 6 7 8 9
UIP Possible UIP
No UIP
Ground_glass Fitted values
years
Graphs by Fibrosis_type
ground-glass (No UIP) coeff. p-value [95% Conf. Interval] years -1,39 0,036 - 2.69 ─ - 3.90 constant 16,3 <0.001 21.43 ─ 28.73
Table 5. Ground glass regression model for panel data in inconsistence-UIP group.
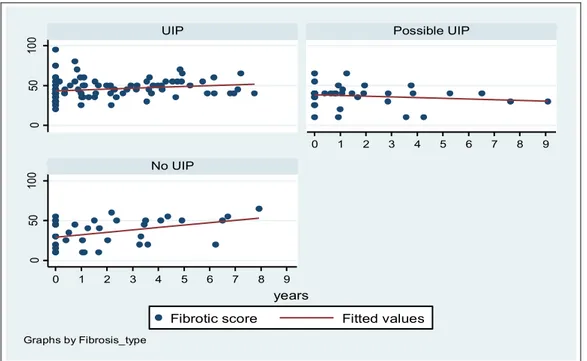
We found a significant increase for fibrotic score in the group 1 (p<0.01) and in the group 3 (p<0,01) but not in the group 2 (Figure 7), the fibrotic score baseline percent score was 43% and the progression was quantified in 2 points/years for UIP type (Table 6).
0 50 10 0 0 50 10 0 0 1 2 3 4 5 6 7 8 9 0 1 2 3 4 5 6 7 8 9
UIP Possible UIP
No UIP
Fibrotic score Fitted values
years
Graphs by Fibrosis_type
Figure 7. Fibrotic score time relation evaluation plots.
Fibrotic score (UIP) coeff. p-value [95% Conf. Interval] years 2,28 <0.001 1.50 ─ 3.07
constant 42,6 <0.001 38.87 ─ 46.33
Table 6. Fibrotic score regression model for panel data in UIP group.
The time distribution of overall CT score was showed in figure 8 and the increase was significant only in the group 1 (p>0.01) where the baseline overall CT score was 50% and the progression was quantified in 1.9 points/years. (Table 7)
0 50 10 0 0 50 10 0 0 1 2 3 4 5 6 7 8 9 0 1 2 3 4 5 6 7 8 9
UIP Possible UIP
No UIP
Overall CT score Fitted values
years
Graphs by Fibrosis_type
Figure 8. Overall CT score time relation evaluation plots.
Overall CT score (UIP) coeff. p-value [95% Conf. Interval] years 1,87 <0.001 0.95 ─ 2.80
constant 47,96 <0.001 43.73 ─ 52.21
Table 7. Overall CT score regression model for panel data in UIP group.
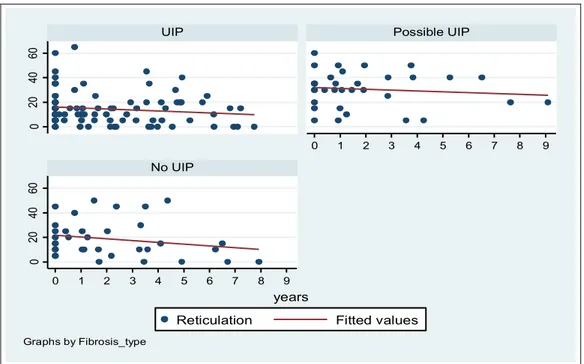
Reticulation score showed a significant regression only in the group 1 (p=0.007) (figure 9) and the bronchiectasis showed a significant increase in the group 1 (p<0.01) and 2 (p<0.01) (Figure 10).
0 20 40 60 0 20 40 60 0 1 2 3 4 5 6 7 8 9 0 1 2 3 4 5 6 7 8 9
UIP Possible UIP
No UIP
Reticulation Fitted values
years
Graphs by Fibrosis_type
0 2 4 6 0 2 4 6 0 1 2 3 4 5 6 7 8 9 0 1 2 3 4 5 6 7 8 9
UIP Possible UIP
No UIP
Bronchiectasis Fitted values
years
Graphs by Fibrosis_type
Figure 10. Bronchiectasis time relation evaluation plots.
In the patients belonging to possible-UIP group the abnormalities have not shown a significant progression during the follow-up (Figure 11)
A B
Figure 11. HRCT images of a patient belonging to possible-UIP group at the baseline (A) and after 3 years of follow-up
(B). Axial HRCT images show the stability of the reticulation plus ground glass.
A subgroup of patients who have baseline HRCT and a follow-up after 1 year were selected and the result was 26 patients divided into group 1 (n=16), group 2 (n=7) and group 3 (n=3).
Than the variation of each abnormality during the follow-up (1 year) were assessed for all the patients and for group 1 patients.
The results of all patients showed no statistical relevance in the time distribution; instead in UIP type group was found a significant increase in honeycombing (p=0.05), overall CT score (p=0.05)
and bronchiectasis (p=0.01). The other abnormalities such as reticulation, fibrotic score and ground glass showed no significant time variation.
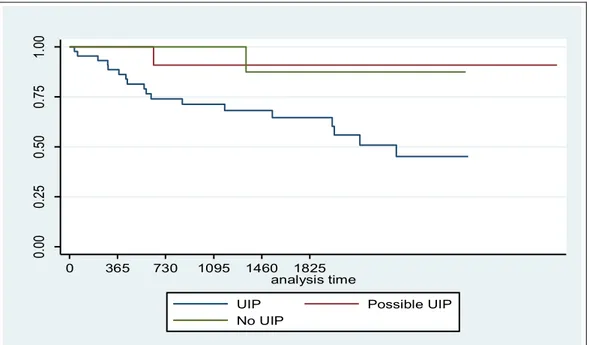
We evaluated the mortality rate during the follow-up of 3029 days, (mean follow-up 1386 days and DS 915), which was significantly greater (p=0.04) in the group 1 (18 died) versus group 2 and 3 (1 died each). (Table 8 and Figure 12)
fibrosis type Events observed Events expected
UIP 18 12,48
Possible UIP 1 3,32
No UIP 1 4,21
Total 20 20
Log-rank test for equality of survivor functions
chi2= 6,56
Pr>chi2= 0,0377
Table 8. Events observed and expected in the three groups.
0. 00 0. 25 0. 50 0. 75 1. 00 cu mu la tive su rvi va l 0 365 730 1095 1460 1825 analysis time
UIP Possible UIP No UIP
Figure 12. Kaplan-Meier survival curves for the three groups.
In the patients belonging to UIP group we evaluated, for each abnormality, different thresholds to differentiate patients with different time of life expectancy.
The Kaplan-Meyer survival curves for the best thresholds founded are reported in figure 13 (honeycombing), 14 (fibrotic score), 15 (overall CT score) and 16 (bronchiectasis).
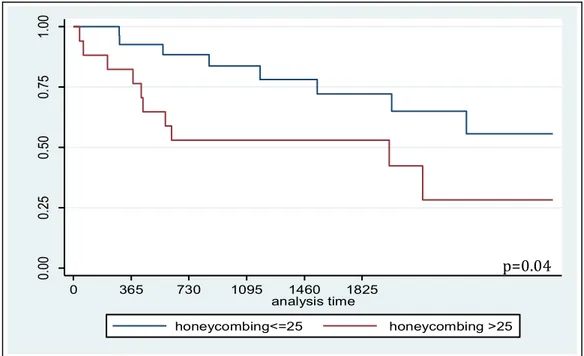
Patients with baseline honeycombing score > 25% had worse survival than patient with honeycombing score <25 (Figure 13), p=0.04.
Figure 13. Kaplan-Meier survival curves for patients with honeycombing score above and
below 25 (p=0.04).
The 5-year survival rate was 72% in patients with honeycombing rates lower than 25%, and 53% in patients with honeycombing rates greater than 25%.
Patients with baseline fibrotic score > 30 had worse survival than patient with fibrotic score <30 (Figure 14), p=0.03. 0. 00 0. 25 0. 50 0. 75 1. 00 cu mu la tive su rvi va l 0 365 730 1095 1460 1825 analysis time honeycombing<=25 honeycombing >25 p=0.04
Figure 14. Kaplan-Meier survival curves for patients with fibrotic score above and below 30
(p=0.03).
The 5-year survival rate was 88% in patients with fibrotic score lower than 30, and 58% in patients with fibrotic score greater than 30.
Patients with baseline overall CT score > 45 had worse survival than patient with overall CT score <45 (Figure 15), p=0.0003.
Figure 15. Kaplan-Meier survival curves for patients with overall CT score above and below 45
(p=0.0003). 0. 00 0. 25 0. 50 0. 75 1. 00 cu mu la tive su rvi va l 0 365 730 1095 1460 1825 analysis time
Overall CT score <=45 Overall CT score >45
p=0.0003 0. 00 0. 25 0. 50 0. 75 1. 00 cu mu la tive su rvi va l 0 365 730 1095 1460 1825 analysis time
Fibrotic score <=30 Fibrotic score >30
The 5-year survival rate was 80% in patients with overall CT score lower than 45, and 41% in patients with overall CT score greater than 45.
Patients with bronchiectasis in more than 4 lobes had worse survival than patient with bronchiectasis in less than 4 lobes (Figure 16), p=0.002.
Figure 16. Kaplan-Meier survival curves for patients with bronchiectasis in more and less than
4 lobes (p=0.002).
The 5-year survival rate was 88% in patients with bronchiectasis in more than 4 lobes, and 51% in patients with bronchiectasis in less than 4 lobes.
0. 00 0. 25 0. 50 0. 75 1. 00 cu mu la tive su rvi va l 0 365 730 1095 1460 1825 analysis time Bronchiectasis <=4 Bronchiectasis >4 p=0.002
Discussion
In our study, HRCT has been used in order to classify the fibrotic IIP according the new ATS/ERS/JRS/ALAT statement. The role of HRCT has been evaluated to identify the UIP type, the progression of different abnormalities and to predict the mortality in patients with UIP. Moreover the progression of some functional parameter (SVC, FVC, DLCO) has been examined during the follow-up.
By the use of HRCT the fibrotic IIP diseases were classified into the three groups (UIP type, possible-UIP and no-UIP) according to the new ATS/ERS/JRS/ALAT guidelines. The HRCT classification was easy and reproducible. It was obtained by the only HRCT evaluation (20-30 images) and the results were determined in order of minutes. In the meantime the reader can quantify each abnormality by an easy method that uses the definition of a score. This score was estimated to the nearest 5% of parenchymal involvement and was based on the percentage of lung parenchyma that showed evidence of an abnormality.
The interobserved agreement between the two radiologists in evaluating the lung parenchyma abnormalities score resulted high in any observation (k between substantial to almost perfect); the classification into the three groups was reached after data examination and discussion. On the basis of the old classification, as mentioned in the Thomeer study et al. (18), the level of agreement between the HRCT readers has been fair to moderate related to the definition of UIP and NSIP pattern. In our study we did not evaluate the interobserved agreement to classify the IIP into the three groups but to identify and to score each abnormality. This difference explains the high agreement that we found in our study according to Sverzellati study, in which the interobserved agreement in assessing the presence and extension of ground glass attenuation, reticulation, honeycombing and consolidation has resulted very good. (20).
In our study we used a visually score to quantify the abnormalities, according to Shin et al. (16)or Schmidt at al. (19) studies. We had also considered to use the quantitative CT indices, but many other studied such as those of Sverzellati et al. (20) have demonstrated that the visual score is still
the main radiological method of quantifying the extent of abnormalities in patients with UIP. Furthermore Best et al. (21) have demonstrated that the visually determined disease extension on CT images is a strong independent predictor of mortality in IPF.
The difference of abnormalities between the three groups was significant: the group 1 presented the highest honeycombing score, the group 2 presented a lower than 5% honeycombing score according to ATS/ERS/JRS/ALAT statement. The baseline abnormalities as honeycombing, reticulation, fibrotic score were significant higher in the group 1 respect to the group 2, as obvious consequence of the inclusion criteria to classify the fibrotic IIP into the two groups: UIP type or possible-UIP. Moreover the patients belonging to UIP group, classified on the basis of HRCT UIP pattern, had a poor survival compared with patients belonging to the other two groups, as showed in figure 12, demonstrating the high prognostic value of our classification. The subgroups of patients with different prognosis were differentiated on the basis of HRCT abnormalities (honeycombing and bronchiectasis), overall CT score and fibrotic score to determinate a major or minor estimated time of life. As a consequence, a threshold honeycombing score of 25%, a threshold fibrotic score of 30%, a threshold overall CT score of 45% and bronchiectasis in more than 4 lobes were able to predict mortality. We did not find any difference in survival considering the other HRCT pattern. Our data are in agreement with the ATS/ERS/JRS/ALAT guidelines 2011 (15) that has demonstrated how the extent of fibrosis and honeycombing on HRCT were predictive of survival in IPF.
In other studies the role of HRCT pattern to predict mortality is controversial and refers to the old classification of UIP. Sumikawa at al. (22) have demonstrated in 98 patients with histological diagnosis of UIP that traction bronchiectasis and fibrotic score influenced the prognosis. Lynch at al. have reported that a higher extent of fibrotic score increased the risk of death in 315 patients with IPF (23).
Finally, the HRCT analysis allowed demonstrating the time progression of overall CT score, fibrotic score and individual abnormalities. The time progression was demonstrated to be different
in the three groups. In the UIP group respect to the possible-UIP group, the time progression of honeycombing, fibrotic score and overall CT score was significant differentiated and increased in a statistically predictable manner. On the contrary, the reticulation score decreased significantly. This time progression was in agreement with the temporal course of IPF on CT, as showed in the Misumi et al. study (24). In that study, in treated pharmacologically patients the reticular abnormalities usually progress to honeycombing and the areas of honeycombing increase inexorably in extent.
Our study opens the way to a new method of classification of the fibrotic IIP based on the recent ATS/ERS/JRS/ALAT guidelines and gives the opportunity to verify the progression and the mortality rate considering the distribution of patients into three groups.
Our study has some limitations. First, the study is retrospective and the HRCT examinations were not homogeneous for CT scanner and technical parameters.
The second limitation is that the surgical lung biopsies were available only for 9 patients, due to the evaluation of the potential risks associated with this procedure.
The third limitation is that during the follow-up the CT scans were not performed at regular time intervals and that PFR and DLCO were not available in the same time.
Despite of these limitations, our results are new and consistent with ATS/ERS/JRS/ALAT statement 2011, confirming the prognostic importance of the HRCT evaluation of IPF.
Conclusion
In patients affected by fibrotic IIP, the application of the ATS/ERS/JRS/ALAT guidelines 2011 in evaluating HRCT images allows to accurately classify the pattern into three types (UIP type, possible UIP type and UIP type), to score in a reproducible manner the individual abnormalities and to observe the evolution over time.
As a consequence, it is possible to stratify the risk of individual patients on the basis of belonging to one of the three groups and on the basis of the extent of the abnormalities presented.
In our study, HRCT criteria for UIP pattern on the basis of 2011 guidelines showed high accuracy in the risk stratification of patients with IPF and confirms the usefulness of the new guidelines to predict disease progression and patients prognosis.
References
1. American Thoracic Society; European Respiratory Society. American Thoracic Society/European Respiratory Society international multidisciplinary consensus classification of idiopathic interstitial pneumonias. Am J Respir Crit Care Med 2002; 165:277-304
2. American Thoracic Society; European Respiratory Society. Idiopathic pulmonary fibrosis: diagnosis and treatment: international consensus statement. Am J Respir Crit Care Med 2000; 161:646-664.
3. Gribbin J, Hubbard RB, Le Jeune I, Smith CJ, West J, Tata LJ. Incidence and mortality of idiopathic pulmonary fibrosis and sarcoidosis in the UK. Thorax 2006;61:980-985
4. Raghu G, Weycker D, Edelsberg J, Bradford WZ, Oster G. Incidence and prevalence of idiopathic pulmonary fibrosis. Am J Respir Crit Care med 2006;174:810-816
5. Gay SE, Kazerooni EA, Toews GB, Lynch III JP, Gross BH, Cascade PN, Spizarny DL, Flint A, Schork MA, Whyte RI, Popovich J, Hyzy R, Martinez FJ. Idiopathic pulmonary fibrosis: predicting response to therapy and survival. Am J Respir Crit Care Med 1998; 157:1063–72
6. Flaherty KR, Toews GB, Travis WD, Colby TV, Kazerooni EA, Gross BH, Jain A, Strawderman RL, Paine R, Flint A, Lynch III JP, Martinez FJ. Clinical significance of histological classification of idiopathic interstitial pneumonia. Eur Respir J 2002; 19:275-83
7. Bjoraker JA, Ryu JH, Edwin MK, Myers JL, Tazelaar HD, Schroeder DR, Offord KP. Prognostic significance of histophatologic subsets in idiopathic pulmonary fibrosis. Am J Respir Crit Care Med 1998; 157:199-203
8. Peikert T, Daniels CE, Beebe TJ, Meyer KC, Ryu JH. Interstitial Lung Diseases Network of the American College of Chest Physicians. Assessment of current practice in the diagnosis and therapy of idiopathic pulmonary fibrosis. Respir Med 2008; 102(9):1342-8
9. Diette GB, Scatarige JC, Haponik EF, Merriman B, Fisherman EK: Do high-resolution CT findings of usual interstitial pneumonitis obviate lung biopsy? Views of pulmonologists. Respiration 2005, 72:134-41
10. Utz JP, Ryu JH, Douglas WW, Tazelaar HD, Myers JL, Allen MS, Schroeder DR. High short-term mortality following lung biopsy for usual interstitial pneumonia. Eur Respir J 2001; 17:175–9. 11. Yuksel M, Ozyurtkan MO, Bostanci K, Ahiskali R, Kodalli N. Acute exacerbation of interstitial fibrosis after pulmonary resection. Ann Thorac Surg 2006; 82:336–8.
12. Collard HR, King TE Jr, Bartelson BB, Vourlekis JS, Schwarz MI, Brown KK. Changes in clinical and physiologic variables predict survival in idiopathic pulmonary fibrosis. Am J Respir Crit Care Med 2003; 168:538-42
13. Flaerthy KR, Mumford JA, Murray S, Kazerooni EA, Gross BH, Colby TV, Travis WD, Flint A, Toews GB, Lynch III JP, Martinez FJ. Prognostic implication of physiologic and radiographic changes in idiopathic interstitial pneumonia. Am J Respir crit Care Med 2003; 168:543-8
14. Flaherty KR, Thwaite EL, Kazerooni EA, Gross BH, Toews GB, Colby TV, Travis WD, Mumford JA, Murray S, Flint A, Lynch III JP, Martinez FJ. Radiological versus histological diagnosis in UIP and NSIP: survival implications. Thorax 2003; 53:143-8
15. Raghu G, Collard HR, Egan JJ, Martinez FJ, Behr J, Brown KK, Colby TV, Cordier JF, Flaherty KR, Lasky JA, Lynch DA, Ryu JH, Swigris JJ, Wells AU, Ancochea J, Bouros D, Carvalho C, Costabel U, Ebina M, Hansell DM, Johkoh T, Kim DS, King TE Jr, Kondoh Y, Myers J, Müller NL, Nicholson AG, Richeldi L, Selman M, Dudden RF, Griss BS, Protzko SL, Schünemann HJ; ATS/ERS/JRS/ALAT Committee on Idiopathic Pulmonary Fibrosis. An official ATS/ERS/JRS/ALAT statement: idiopathic pulmonary fibrosis: evidence-based guidelines for diagnosis and management. Am J Respir Crit Care Med. 2011; 183:788-824
16. Shin KM, Lee KS, Chung MP, Bae YA, Kim TS, Chung MJ. Prognostic determinants among clinical, thin-section CT, and histopathologic findings for fibrotic idiopathic interstitial pneumonias: tertiary hospital study. Radiology 2008; 249(1):328-37
17. Lynch DA, Travis WD, Muller NL, Galvin JR, Hansell DM, Grenier PA, King TE Jr. Idiopathic interstitial pneumonias: CT features. Radiology 2005; 236:10–21
18. Thomeer M, Demedts M, Behr J, Buhl R, Constabel U et all. Multidisciplinary interobserved agreement in the diagnosis of idiopathic pulmonary fibrosis. Eur Respir. J. 2008; 31: 585-91
19. Schmidt SL, Sundaram B, Flaherty KR. Diagnosing fibrotic lung disease: when is high-resolution computed tomography sufficient to make a diagnosis of idiopathic pulmonary fibrosis? Respirology. 2009 Sep;14(7):934-9.
20. Sverzellati N, Calabrò E, Chetta A, Concari G, Larici AR, Mereu M, Cobelli R, De Filippo M, Zompatori M. Visual score and quantitative CT indices in pulmonary fibrosis: Relationship with physiologic impairment. Radiol Med. 2007 Dec;112(8):1160-72. Epub 2007 Dec 13
21. Best AC, Meng J, Lynch AM, Bozic CM, Miller D, Grunwald GK, Lynch DA. Idiopathic pulmonary fibrosis: physiologic tests, quantitative CT indexes, and CT visual scores as predictors of mortality. Radiology. 2008 Mar;246(3):935-40. Epub 2008 Jan 30.
22. Sumikawa H, Johkoh T, Colby TV, Ichikado K, Suga M, Taniguchi H, Kondoh Y, Ogura T, Arakawa H, Fujimoto K, Inoue A, Mihara N, Honda O, Tomiyama N, Nakamura H, Muller NL. Computed tomography findings in pathological usual interstitial pneumonia. Relation to survival. Am J Respir Crit Care Med 2008; 177:433-9
23. Lynch DA, Godwin JD, Safrin S, Starko KM, Hormel P, Brown KK, Raghu G, King TE Jr, Bradford WZ, Schwartz DA, Webb WR. High-Resolution Computed Tomography in Idiopathic Pulmonary Fibrosis. Diagnosis and prognosis. Am J Respir Crit Care Med 2005; 172:488–93
24. Misumi S, Lynch DA. Idiopathic pulmonary fibrosis/usual interstitial pneumonia: imaging diagnosis, spectrum of abnormalities, and temporal progression. Proc Am Thorac Soc. 2006 Jun;3(4):307-14.