WOMEN’S PRESENCE ON EUROPEAN BOARDS
AND THE PERFORMANCE CYCLE OF VALUE
CREATION AS AN INSTRUMENT TO ACHIEVE
THE GENDER QUOTAS
Bettina C.K. Binder
Pforzheim University, GermanyReceived: August 12, 2020 Accepted: October 2, 2020 Online Published: November 30, 2020
Abstract
Value creation is a major claim of most companies. Mahajan (2017) argues that “value and value creation are natural to and basic in human behaviour and endeavour”, nevertheless women are often marginalized and impeded in their advancement towards leadership positions, where they could shape and influence the process of value creation. Many large companies in Europe include mainly men in supervisory boards and the women quota is often lower than 20 %. We offer an overview of the women’s presence on the boards of the EURO STOXX 50 companies and we develop a model, which presents eight steps in a strategic performance cycle showing how more women can be integrated in supervisory and management boards so that they can contribute to a better company value in general. The main contribution consists in offering companies a strategic instrument and concrete advices on how the women presence can be increased company-wide and the gender quota on boards can be achieved.
Keywords: Strategic performance cycle; Value creation; Women on supervisory boards; Key performance indicators; Gender quota; EURO STOXX 50.
1. Introduction
Value creation is a major claim of most companies and when leafing through the annual reports of companies one encounters expressions such as “value to our shareholders”, “we provide value for our customers”, “we create value for our employees, shareholders, business partners, neighbors and the public”, etc. While it seems to be clear for whom value is created, the concept of “value” itself is subjected to various interpretations and is regarded in the literature as ambiguous (Lepak, Smith, & Taylor, 2007; Marinova, Larimo, & Nummela, 2017). Mahajan (2017) argues that “value and value creation are natural to and basic in human behavior and endeavor”, nevertheless women are often marginalized and impeded in their advancement towards leadership positions, where they could shape and influence the process of value creation. The urge to better use the talent pool represented by women was voiced by many
actors: the Organization for Economic Co-operation and Development ([OECD], 2016) for example emphasized that women “can provide society with different perspectives and approaches to management, organization and business issues”. In order to change the organizational culture of all-male boards, positive actions such as gender quotas were introduced in many European countries.
The present paper looks at the companies of EURO STOXX 50 index in the year 2015 and offers an overview of women representation on the boards of these 50 companies, the index being described as a “Blue-chip representation of supersector leaders in the Eurozone” (stoxx.com).
The author of this paper deems the presence of women on corporate boards as valuable in itself and argues that images such as the “white, heterosexual, western, middle/upper class, able man” (Zanoni, Janssens, Benschop, & Nkomo, 2010 p. 13) ought to be challenged in international business.
The paper draws on existing literature in the field of key performance indicators (KPIs), diversity management, women quota and supervisory boards and it is structured as follows: in a first step, value and value creation is described on the basis of the annual reports of the 50 EURO STOXX companies. By reading the annual reports, it also became evident, that some of the companies employ the value-based management approach, and therefore, one section is dedicated to this aspect. In a second step, a short literature review about the presence of women on boards and its relevance will be presented. Based on a strategic performance cycle with eight steps, this paper envisages measures and solutions for companies aiming to achieve a high women quota and to increase at the same time the companies’ value.
Finally, a correlation analysis is conducted in order to see, whether there is a relationship between the number of women on supervisory boards and financial performance of the companies under scrutiny. The last sections is dedicated to the findings and it also shows the limitations of this study and offers suggestions for future research.
2. Value, Value Creation and Value Understanding
2.1. The Concept of “Value” and Its Use by Companies
The centrality of value creation is incontestable for companies and management and organizational scholars alike. Generating value is seen to positively impact the stakeholders, employees, customers, partners and CEOs, society, companies and shareholders (Mahajan, 2016). The author of this article acknowledges the significance of the monetary component of value creation, in line with the definition offered by Lepak, Smith and Taylor: “value creation depends on the relative amount of value that is subjectively realized by a target user (or buyer) who is the focus of value creation – whether individual, organization, or society – and that this subjective value realization must at least translate into the user’s willingness to exchange a monetary amount for the value received” (2007, p. 182). The CEO should avoid value destruction by focusing on the customer and using financial and non-financial assets and measures (Mahajan 2016, p. 69).
Most of the companies of the EURO STOXX 50 index1 use in their annual reports the word “value”, be it in the sense of monetary worth, importance in the eyes of someone, or principle or belief. Airbus for instance focuses on delivering value for shareholders as in “value to our shareholders through our share buybacks, with an additional €1 billion launched in October 2015” (Airbus Group, 2015, p. 19). Airbus also claims to “recognize the value that diversity
brings” and therefore “is committed to advancing women in the workplace and developing female talent” (Airbus Group, 2015, p. 26). Other companies of the EURO STOXX 50 index claim in their annual reports to being committed to value creation. Nokia states for example the following: “We aim for all our business groups to be innovation leaders, drawing on our frontline R&D capabilities to deliver leading products and services for our customers, and ultimately ensure the company’s long-term value creation” (Nokia, 2015, p. 40).
What should be pointed out is the tendency of using words in a loose or even misleading manner in some of the annual reports. Fresenius for example had at the end of 2015 an all-male supervisory board, being actually the only company of the EURO STOXX 50 index in this situation. Yet, in its annual report, it is emphasized that “Fresenius values a culture of diversity2. The interplay of a wide range of views, opinions, cultural backgrounds, experiences, and values help us to achieve our full potential and contributes to our success” (Fresenius, 2015, p. 27).
While the words “value” and “value creation” appear in most annual reports of the companies of EURO STOXX 50 index, some companies even employ a value-based management (VBM) metric. The next section of this paper gives a short overview on VBM and the EURO STOXX 50 companies using this approach.
2.2. VBM, Its KPIs and the EURO STOXX 50 Companies
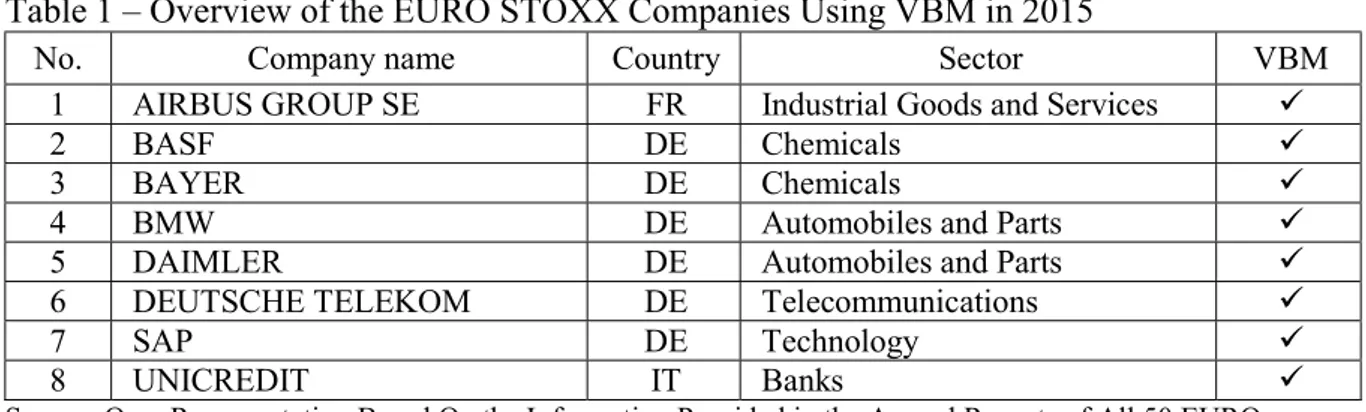
The following table shows the eight companies of the EURO STOXX 50 index, which according to their annual reports were using VBM in 2015.
Table 1 – Overview of the EURO STOXX Companies Using VBM in 2015
No. Company name Country Sector VBM
1 AIRBUS GROUP SE FR Industrial Goods and Services
2 BASF DE Chemicals
3 BAYER DE Chemicals
4 BMW DE Automobiles and Parts
5 DAIMLER DE Automobiles and Parts
6 DEUTSCHE TELEKOM DE Telecommunications
7 SAP DE Technology
8 UNICREDIT IT Banks
Source: Own Representation Based On the Information Provided in the Annual Reports of All 50 EURO STOXX Companies
One can find many definitions of VBM in the literature. According to Firk, Schrapp and Wolff “VBM is a holistic managerial approach that aims to align corporate action with value creation” (2016, p. 42). The driving philosophy of companies using VBM is to “maximize shareholder value by producing returns in excess of the cost of capital” (Simms, 2001). In order to maximize shareholder value “VBM links the company’s strategic objectives to a coherent set of performance measures through cause-and-effect chains (‘value drivers’) that include all relevant processes and all pertinent information systems across a company” (Burkert & Lueg, 2013, p. 5). Among the most known KPIs associated with VBM are economic value added (EVA), discounted cash flow (DCF) and cash flow return on investment (CFROI).
EVA is the most common method, and a registered trademark of Stern Stewart & Company. To calculate the EVA, capital losses are deducted from capital profit. It is considered a simple
method, which can be advantageous. However, the existence of a market and book value in the calculation of the EVA can lead to a lack of transparency. Capital profit in opposition to the profit from a balance sheet, is a KPI that describes the profit with interest rates. Capital losses are calculated from the capital multiplied with the capital margin. Yet, only figures taken out from the profit and loss statement or the balance sheet are not sufficient for doing VBM, and calculating the EVA.
When using the DCF method cash flow becomes the central KPI and an equity or an entity approach can be here employed. Discounted rates and the net present value are for the calculation essential. The advantage of the DCF is its acceptance internationally; it is often employed e.g. in mergers and acquisitions valuations. Disadvantages of the DCF-method are that the expected cash flows are uncertain and can change yearly or even during the year.
Companies sometimes use the CFROI method for VBM as well. Developed by the Boston Consulting Group, KPIs like the cash value added (CVA), free cash flow, weighted average costs of capital (WACC) and the gross investments are used for calculating the CFROI. Advantages are that cash flow values can be internally or externally calculated and used by managers and investors to indicate liquidity and solvency. The disadvantages of the CFROI-method are the slightly more complex formulas for calculation.
VBM is, however, ‘not just about the numbers’ as Haspeslagh, Noda and Boulos (2001) noted: “A successful VBM program is really about introducing fundamental changes to a big company’s culture. And therein lies the reason for most of the failures: Transforming beliefs in a large organization is arguably the most difficult of all managerial challenges”. In the following paragraphs the understanding of VBM as described in the annual reports of the EURO STOXX companies using this approach is presented.
Airbus states that “among other indicators, the Group uses a Value Based Management approach in order to guide the Company towards sustainable value creation by generating financial returns above the cost of capital” (Airbus, 2015, p. 61). The KPIs employed by Airbus are Return on Capital Employed (RoCE), EBIT pre-goodwill impairment and exceptionals and free cash flow. The German company BASF considers VBM an essential part of its strategy: the company’s slogan “We add value as one company” is regarded as one of the four principles, which contribute to the company’s “We create chemistry” strategy (BASF, 2015, p. 30). The annual report describes VBM as a holistic approach, implemented at all levels of the company: “According to our value-based management concept, all employees can make a contribution in their business area to help ensure that we earn the targeted premium on our cost of capital. We pass this value-based management concept on to our team around the world through seminars and training events, thereby promoting entrepreneurial thinking at all levels within BASF” (BASF, 2015, p. 30). As a steering parameter, BASF uses EBIT after cost of capital (BASF, 2015, p. 30).
Bayer is another German company of EURO STOXX index, which uses VBM (six out of the eight companies employing VBM are German). According to the annual report, “one of the prime objectives of the Bayer Group is to steadily increase enterprise value” (Bayer, 2015, p. 55). The steering parameters involved in reaching this objective are CVA and CFROI: “These indicators support management in its decision-making, especially in the areas of strategic portfolio optimization and the allocation of resources for acquisition and capital expenditures” (Bayer, 2015, p. 55).
BMW writes that “the business management system applied by the BMW Group follows a value-based approach, with a clear focus on achieving profitable growth, increasing the value of the business for the capital providers and safeguarding jobs” (BMW, 2015, p. 20). While declaring that the KPIs engaged in measuring value creation are defined for each controlling level, BMW employs not only financial indicators, such as RoCE, and return on equity (RoE), but also non-financial indicators, such as the size of the Group’s workforce (BMW, 2015, pp. 20-21).
Daimler too uses KPIs which are oriented “toward our investors’ interests and expectations and provide the foundation of our value-based management” (Daimler, 2015, p. 77). At the core of Daimler’s performance measurement system is value added which is “calculated as the difference between operating profit and the cost of capital of average net assets” (Daimler, 2015, p. 77).
Deutsche Telekom states that in order to “set and achieve [its] strategic goals more effectively” (Deutsche Telekom, 2015, p. 64) a value management approach is pursued. According to the information from the annual report, the Group has a code of conduct which “defines how employees and management should practice value-based and legally compliant conduct in their daily business activities” (Deutsche Telekom, 2015, p. 46), and the Group’s corporate governance is value-oriented (Deutsche Telekom, 2015, p. 63). Among the KPIs employed by Deutsche Telekom are RoCE, EBIT, and free cash flow.
Dedicated to “creat[ing] long-term value by addressing future needs” SAP uses VBM and it concentrates on two different goals: “We use various performance measures to help manage our performance with regard to our primary financial goals, which are growth and profitability, and our primary non-financial goals, which are customer loyalty and employee engagement” (SAP, 2015, p. 59).
The Italian company Unicredit describes in its annual report its “principles of value creation and capital allocation” (Unicredit, 2015, p. 36). The main performance indicator used by Unicredit is the EVA.
From the excerpts of the annual reports, it becomes apparent that the companies implementing VBM systems do have slightly different understandings, approaches, and KPIs in use. However, as all companies of EURO STOXX 50 index do claim to create value, in the next step of the paper the author analyses the degree to which these companies concentrate not only on organizational growth, but also on organizational sustainability. Sustainability could be achieved if women too were given the chance to be in top positions. The next section contains a literature review with regard to the presence of women on boards and women quota.
3. Women on Boards and How Their Number Can Be Increased
3.1. The glass ceiling
A controversial issue during the past decades was women’s presence in supervisory boards. Yet, gender equality is one of the founding values of the European Union (EU) with the principle of equal pay being included in the Treaty establishing the European Economic Community already in 1957 (Jacquot, 2017). When looking at the corporate world, one can say that the glass ceiling is still in place, as many large companies in Europe include mostly men on supervisory boards and the number of women on these boards is often low. What needs to be acknowledged is the fact that gender balance became a priority and diversifying corporate supervisory boards often represent a target to be achieved. In Norway, Italy, France, Spain and starting with 2016 also in Germany binding gender quota exist (Sullivan, 2015). Small improvements can be seen with a law instituted quota for women in supervisory boards (Corkery & Taylor, 2012). Norway was the first country to legislate board quotas in 2004 (Dizik, 2015) and many countries followed with law determined or optional women quotas in supervisory boards. Yet, according to the “2019 Report on equality between women and men in the EU” of the European Commission “critical positions within boards are still rarely filled by women” (European Commission, 2019, p. 30).
There are studies on women in European listed companies suggesting that there are positive effects of diverse boards on corporate governance and even on firm performance (Buchwald & Hottenrott, 2015). The study “Women matter. Gender diversity, a corporate performance driver” showed that companies with a higher proportion of women in top management perform better
(McKinsey, 2007). However, there are also authors signaling rather the lack of evidence that female representation in supervisory boards improves profitability (Ferreira, 2014). For instance, in a study with 108 German large corporations, which took place between 2009 and 2013, there was not enough evidence to indicate a significant relationship between gender diversity and firms’ financial performance (Dick, 2015). Moreover, it seems that men in supervisory boards have often better networks and for this reason, the male supervisory board managers often recruit male followers, which minimizes the women quota in supervisory boards on the long run (Terjesen, Aguilera, & Lorenz, 2015).
Considering the urge voiced by many actors (EU, OECD, the International Labour Organisation [ILO]) to better use the talent pool represented by women as well as the long-term policies of the EU, which aim at advancing gender balance in decision-making, we developed a strategic performance cycle for value creation, which encourage companies to engage women sustainably in top positions.
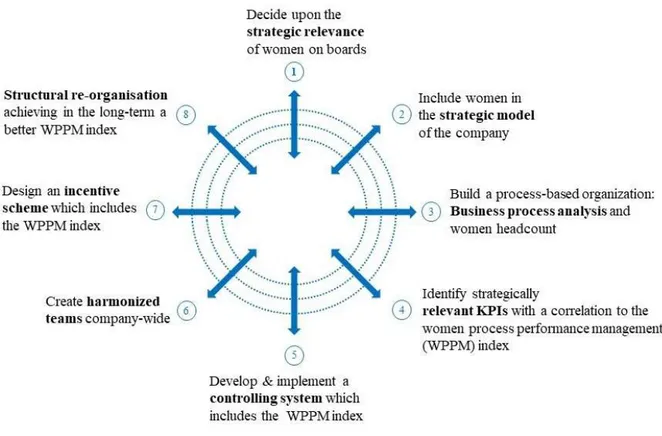
3.2. The strategic performance cycle for value creation The following figure presents the strategic performance cycle. Figure 1 – The Strategic Performance Cycle in Eight Steps
Source: Author’s creation
The strategic performance cycle is an instrument, which can help companies boost the presence of women on boards by following eight steps. In the next paragraphs, each step and its implications are shortly presented:
1. Strategic relevance
Many companies nowadays are interested in integrating more women in management or supervisory boards not just in countries where legislation imposes a women quota but also in countries where it is optionally expected. Therefore, achieving a women quota is strategically relevant for most companies. Consequently, companies search for an approach and a course of action to pursue a better integration of women into their boards and their business in general, but sometimes it is not clear which path would be the most appropriate. For instance in Germany, listed companies must achieve a gender quota of 30% on their supervisory boards. For managers this means that they need to search for a solution or an implementation concept. The KPI “women quota” must therefore be integrated not just in the vision and mission statements of the companies, but also at an early stage in the strategic planning process. In the tactical planning phase, women should appear in the organization charts by name, to show that the realization of a women quota of 30 % is not just a faraway dream, but the company is actually promoting women and is envisioning a pool of women talents. In the operating planning and budgeting process more women should be hired as responsible line managers who report planning figures for their departments.
Moreover, the KPI women quota should be included into strategic performance management tools such as the Balanced Scorecard (BSC). Women quota could be for instance included in the internal perspective of the BSC and increase in this way the focus on this critical area.
2. Strategic model
A strategic model for a period of five to ten years should be developed and evaluated. Such a model could contain several strategic KPIs such as the EBT, the women quota, early warning indicators, scenario targets including worst case, best case and trend scenarios. Using the scenario technique or other strategic instruments, the KPI women quota can be emphasized. The slogan “What gets measured gets done” shows how relevant it is to integrate the women quota in scenarios e.g. as prognosis for the next ten years. The KPI women quota could be split into ‘smaller’ indicators such as the target for female recruitments in the overall workforce, the number of women in middle management, the number of women in the management board, the number of women in the supervisory boards, etc. The business model, together with the vision and the mission of a company should offer a comprehensive and unified image in terms of goals and messages. If the company addresses mainly female customers, the company would surely benefit from emphasizing the importance played by women leadership and the commitment towards achieving a high women quota. Woman quota can be related also to other sustainability goals of the company. Whether it is self-commitment or law compliance, increasing the number of women at the top of companies should be clearly communicated and lived throughout the company.
Moreover, a women quota can be a goal also at departmental level. The business model can stipulate that only those managers are eligible for a performance bonus (e.g. 20%) if their department or team have a women quota higher than 30%. This could be a consistent business model to increase the women quota in the long term also at management level.
3. Business process analysis
In the third step of the strategic performance value creation cycle a business process analysis has to be conducted. First, activities, sub-processes and main processes of different departments or of the company as a whole should be identified. This business process analysis can be done using anonymous interviews about the total headcounts in the cost centers. To know how many women headcounts work in these processes, the interviewers should keep a separate recording of male and female headcounts. The headcount data remains anonymous, but male and female capacities are distinguished for calculating the women quota for each individual activity, sub-process and main process. Second, cost drivers of the processes such as number of orders, number of male or female recruitments, number of women in management positions, etc. are identified. Third, the total
process costs should be calculated for the main processes, for the sub-processes and finally for the activities. If one considers some twenty main processes in a company, it seems easy to calculate the process costs that should be finally divided into male and female capacities. For the hundreds of sub-processes the process calculation of the total process costs split into female and male costs could be more time consuming. The total process costs calculation for the final thousands of activities is still necessary because the activities are allocated at the end to sub processes and main processes differentiated in male and female process costs. Fourth, the process cost rate must be calculated so that finally it can be said what are the process costs for one order execution, etc. The process cost rate divided into male and female costs can identify processes e.g. with a high performance and show if these processes have a high women quota too. Fifth, the allocation of activities to sub-processes and finally to main processes can show the male process costs and the female process costs e.g. for one order. In companies with a low women quota, the female process costs over all activities seem low compared to the male process costs. At the latest at this point it should be clear that the women quota must be increased by starting to recruit more women into management and supervisory boards and to the departments and teams too.
The process cost rates can be implemented into a product calculation instead of the burden rates used for the indirect areas. Process cost rates e.g. for the sales process costs, the maintenance process costs or the security process costs are always interesting when they are integrated in a product calculation. Divided into male and female process costs additional information can be made available.
4. Relevant KPIs
For increasing the women quota, it is necessary to measure a special KPI, which we call “women process performance management (WPPM) index”. This KPI should increase over a long strategic planning period and has the following formula:
𝑊𝑃𝑃𝑀 = 𝐶𝑢𝑠𝑡𝑜𝑚𝑒𝑟 𝐼𝑚𝑝𝑜𝑟𝑡𝑎𝑛𝑐𝑒 × 𝐶𝑢𝑠𝑡𝑜𝑚𝑒𝑟 𝑆𝑎𝑡𝑖𝑠𝑓𝑎𝑐𝑡𝑖𝑜𝑛
𝑃𝑟𝑜𝑐𝑒𝑠𝑠 𝐶𝑜𝑠𝑡 𝑅𝑎𝑡𝑒 (𝑊𝑜𝑚𝑒𝑛 𝐶𝑎𝑝𝑎𝑐𝑖𝑡𝑖𝑒𝑠) ÷ 𝐵𝑒𝑛𝑐ℎ𝑚𝑎𝑟𝑘 𝐶𝑜𝑠𝑡 𝑅𝑎𝑡𝑒 (𝑊𝑜𝑚𝑒𝑛 𝐶𝑎𝑝𝑎𝑐𝑖𝑡𝑖𝑒𝑠)
With the help of a customer survey, two KPIs are to be measured: the customer importance related to one process and the customer satisfaction attributed to it. It is important to measure both these KPIs because the customer should be able to evaluate whether e.g. an order process is important for him and whether he is satisfied with the order fulfillment in time. The customer survey should be accompanied by a business process analysis as described above. The result of this business process analysis should be the process cost rate, this time calculated considering the women capacities. By comparing this process cost rate based on women capacities with a benchmark process cost rate of women capacities of another company, a quotient can be built and a final equivalence number can be calculated.
If the women WPPM index is higher than 1, the strategic performance and value creation is good. If the index is lower than 1, then the qualitative and quantitative premises should be optimized. A better position in comparison with the main benchmark competitor should be achieved for instance by improving the process cost rate via better recruitment of qualified women or improving customer experience.
5. Controlling system
The controlling system consists of the planning process, the cost accounting process and the reporting process. The WPPM index can be integrated into a planning system. This means that the yearly budgeting process includes the women quota and the WPPM index and incorporates these two KPIs for the next fiscal year for each department of an enterprise.
In the cost and managerial accounting process cost types, cost centers and cost objects are identified. These cost elements are planned including additional KPIs like the women quota and the WPPM index for each cost center. For example, the cost center, order management must plan the costs, the relevant budget with the number of orders, the women quota as target for this cost center and the WPPM index. To calculate the WPPM index it must be ensured that the cost center is big enough and that customer contact (of internal or external customers) is fostered. Additionally when a process cost rate and a benchmark cost were identified, the WPPM index can be calculated and planned.
The relevant KPIs should be integrated in the monthly reporting process. A special chapter for important qualitative KPIs in each month end report ensures that the women quota and the women PPM index are continuously measured and a development trend can be registered. This is important when these two figures are also considered in determining the management variable remuneration.
6. Harmonized teams
Once processes are identified and KPIs are defined in a controlling system, the employees should be aware of them and consider them in their daily work. Harmonized teams where women and men work together often achieve better results and the defined KPIs like EBT, cost target and women quota are achieved easier. When women work together with several male team members, extraordinary ideas, remarkable product and process innovations take place and the team comes to unique results. In most cases, critical questions outside specifications are raised by women, and discussed together in the mixed teams.
To design a harmonized team it must be clear that the management supports harmonized teams formed by both men and women. Starting from the top management level, women should work together with men in management boards and supervisory boards but also at lower management level and throughout the entire company. Moreover, it is recommendable to integrate women into the structural organization and to show women and men by name in the company organigram. In process-oriented organizations, a harmonized team can be linked to a project or a process and should be led by a process responsible. The more process responsible are female, the better the KPI women quota becomes. Furthermore, the number of women in harmonized teams can be measured project based (short term) or process bases (in the long run).
7. Incentive scheme
External factors can influence the number of women in companies. For example, more lectures can be held at universities to attract more academic women, there should be more job ads looking for the best women in the media or more transparent information in the year-end reports about the number of women or the women quota in management or supervisory boards.
Internally there should be a consistent target setting process supported for instance by Management by Objectives (MBO) meetings. Managers and employees should meet at least twice a year to discuss about the already achieved personal targets and about the future expectations until end of the year. It is not enough to discuss only KPIs like the achieved profit, contribution margin or the sales figures. Additionally, the women quota, the WPPM index should be measured and based on target achievement, the variable part of the annual remuneration should be granted or not.
8. Structural re-organization
The result of a process-based analysis should be to obtain a better effectivity and a higher efficiency company-wide. The KPIs women quota and WPPM index can be measured based on processes, at team level, at departmental level and for the entire enterprise. Process optimization teams (POTs) can be created to design the actual order process, the ideal process flow and the optimized standard process cycle. It should be ensured that an optimized standard process cycle includes the KPIs women quota and the WPPM index.
4. The EURO STOXX Companies and Women Presence on Their Boards
In the following section of the article we will shortly present the EURO STOXX 50 index and its companies and the women quota on their boards.
The EURO STOXX 50 Index was selected to represent the performance of the 50 largest companies among 19 supersectors in the year 2015. There are enterprises of seven Eurozone countries which are integrated in this index. This index has a fixed number of components and is part of the STOXX blue-chip index family. Moreover, EURO STOXX 50 index is one of the most liquid indices for the Eurozone and serves for benchmarking purposes. The index is a financial control index, which ensures stable and up-to-date figures. It represents the performance of only the largest and most liquid companies in a sector (stoxx.com).
The following table gives an overview of the 50 companies, which are part of the EURO STOXX index, their sector of activity, country of origin, the percentage of women on their supervisory boards and the names of these women.
Table 2 – Overview of the EURO STOXX Companies in 2015 and Their Women on Board
No. Company name Sector Country Represent. of women on board
Names of women on board 1 AIR LIQUIDE Chemicals FR 41.7% Geneviève Berger, Sin-Leng Low, Siân
Herbert-Jones, Annette Winkler, Karen Katen
2 AIRBUS GROUP SE
Industrial Goods & Services
FR 16.7% Anne Lauvergeon, María Amparo Moraleda Martinez
3 ALLIANZ Insurance DE 30.8% Christine Bosse, Gabriele Burkhardt-Berg, Ira Gloe-Semler, Renate Köcher 4
ANHEUSER-BUSCH INBEV Food & Beverage BE 14.3% Maria Asuncion Aramburuzabala, Michele Burns 5 ASML HLDG Technology NL 33.3% Pauline F.M. van der Meer Mohr, Clara (Carla) M.S. Smits-Nusteling 6 ASSICURAZION
I GENERALI
Insurance IT 40.0% Alberta Figari, Ornella Barra, Sabrina Pucci, Paola Sapienza
7 AXA Insurance FR 35.7% Isabelle Kocher, Suet Fern Lee,
Deanna Oppenheimer, Doina Palici-Chehab, Dominique Reiniche
8 BASF Chemicals DE 25.0% Dame Alison Carnwath, Anke
Schäferkordt, Denise Schellemans
9 BAYER Chemicals DE 20.0% Simone Bagel-Trah, Petra Kronen,
Sue H. Rataj, Petra Reinbold-Knape 10 BCO BILBAO
VIZCAYA ARGENTARIA
Banks ES 25.0% Belén Garijo López, Lourdes Máiz
Carro, Susana Rodríguez Vidarte 11 BCO
SANTANDER Banks ES 36.4% Sol Daurella Comadrán, Esther Giménez-Salinas i Colomer, Belén Romana García, Isabel Tocino Biscarolasaga
12 BMW Automobiles &
Parts DE 30.0% Christiane Benner, Susanne Klatten, Renate Köcher, Simone Menne, Dominique Mohabeer, Brigitte Rödig
13 BNP PARIBAS Banks FR 50.0% Monique Cohen, Marion Guillou,
Nicole Misson, Laurence Parisot, Daniela Schwarzer, Sandrine Verrier, Fields Wicker-Miurin
14 CARREFOUR Retail FR 25.0% Diane Labruyère-Cuilleret, Mathilde
Lemoine, Patricia Lemoine, Anne-Claire Taittinger
15 DAIMLER Automobiles & Parts
DE 25.0% Sari Baldauf, Petraea Heynike, Andrea Jung, Elke Tönjes-Werner, Sabine Maaßen
16 DANONE Food &
Beverage FR 38.5% Marie-Anne Jourdain, Gaëlle Olivier, Isabelle Seillier, Mouna Sepehri, Bettina Theissig
17 DEUTSCHE
BANK Banks DE 31.8% Dina Dublon, Katherine Garrett-Cox, Sabine Irrgang, Martina Klee, Henriette Mark, Louise M. Parent, Gabriele Platscher
18 DEUTSCHE POST
Industrial Goods & Services
DE 35.0% Simone Menne, Katja Windt, Andrea Kocsis, Anke Kufalt, Sabine
Schielmann, Helga Thiel, Stefanie Weckesser
19 DEUTSCHE
TELEKOM Telecommunications DE 40.0% Sari Baldauf, Monika Brandl, Nicole Koch, Petra Steffi Kreusel, Sylvia Hauke, Sibylle Spoo, Ines Kolmsee, Waltraud Litzenberger
20 E.ON Utilities DE 16.7% Denise Kingsmill, Karen de Segundo
21 ENEL Utilities IT 33.3% Giulia De Martino, Lidia D'Alessio
22 ENGIE Utilities FR 57.9% Isabelle Kocher, Ann-Kristin
Achleitner, Françoise Malrieu, Marie-José Nadeau, Barbara Kux, Stéphane Pallez, Mari-Noëlle Jégo-Laveissière, Caroline Simon, Lucie Muniesa, Catherine Gouillouard, Anne-Marie Mourer
23 ENI Oil & Gas IT 20.0% Karina A. Litvack
24 ESSILOR INTERNATION AL
Health Care FR 18.8% Maureen Cavanagh, Juliette Favre, Louise Fréchette
25 FRESENIUS Health Care DE 0.0%
26 GRP SOCIETE
GENERALE Banks FR 50.0% Barbara Dalibard, Kyra Hazou, Ana Maria Llopis Rivas, Nathalie Rachou, Alexandra Schaapveld, France Houssaye, Béatrice Lepagnol
27 IBERDROLA Utilities ES 38.5% Inés Macho Stadler, Samantha Barber, María Helena Antolín Raybaud, Georgina Kessel Martínez, Denise Mary Holt
28 Industria de Diseno Textil SA
Retail ES 25.0% Flora Pérez Marcote, Irene R. Miller
29 ING GRP Banks NL 25.0% Isabel Martín Castellá, Mariana
Gheorghe 30 INTESA
SANPAOLO Banks IT 26.3% Rosalba Casiraghi, Rossella Locatelli, Beatrice Ramasco, Marcella Sarale, Monica Schiraldi,
31 L'OREAL Personal & Household Goods
FR 40.0% Ana Sofia Amaral, Belén Garijo, Françoise Bettencourt Meyers, Sophie Bellon, Virginie Morgon, Christiane Kuehne
32 LVMH MOET
HENNESSY Personal & Household Goods
FR 23.5% Delphine Arnault, Bernadette Chirac, Laure Sauty de Chalon, Marie-Josée Kravis
33 MUENCHENER
RUECK Insurance DE 40.0% Ann-Kristin Achleitner, Benita Ferrero-Waldner, Ursula Gather, Anne Horstmann, Ina Hosenfelder, Beate
Mensch, Gabriele Sinz-Toporzysek, Angelika Wirtz
34 NOKIA Technology FI 25.0% Elizabeth Nelson, Elizabeth Doherty
35 ORANGE Telecommunica
tions FR 40.0% Helle Kristoffersen, Mouna Sepehri, Anne Lange, Ghislaine Coinaud, Lucie Muniesa, Claudie Haigneré
36 PHILIPS Industrial Goods & Services
NL 33.3% Neelam Dhawan, Orit Gadiesh, Christine Poon
37 SAFRAN Industrial Goods
& Services FR 23.5% Monique Cohen, Odile Desforges, Élisabeth Lulin, Astrid Milsan 38 SAINT GOBAIN Construction &
Materials FR 40.0% Isabelle Bouillot, Anne-Marie Idrac, Sylvia Jay, Pamela Knapp, Agnès Lemarchand, Olivia Qiu
39 SANOFI Health Care FR 35.7% Bonnie Bassler, Claudie Haigneré, Fabienne Lecorvaisier Suet-Fern Lee, Carole Piwnica
40 SAP Technology DE 22.0% Margret Klein-Magar, Anja Feldmann,
Gesche Joost, Christine Regitz 41 SCHNEIDER
ELECTRIC Industrial Goods & Services FR 38.5% Betsy Atkins, Magali Herbaut, Linda Knoll, Cathy Kopp, Lone Fønss Schrøder,
42 SIEMENS Industrial Goods & Services
DE 30.0% Birgit Steinborn, Bettina Haller, Nicola Leibinger-Kammüller, Güler Sabancı, Nathalie von Siemens, Sibylle Wankel 43 TELEFONICA Telecommunica
tions ES 11.0% Eva Castillo Sanz, Sabina Fluxà Thienemann 44 TOTAL Oil & Gas FR 33.3% Patricia Barbizet, Marie-Christine
Coisne-Roquette, Anne-Marie Idrac, Barbara Kux
45
UNIBAIL-RODAMCO Real Estate FR 36.4% Mary Harris, Jacqueline Tammenoms Bakker, Dagmar Kollmann, Sophie Stabile
46 UNICREDIT Banks IT 20.0% Maria Enrica Spinardi
47 UNILEVER NV Personal & Household Goods
NL 54.6% Laura Cha, Ann Fudge, Louise Fresco, Judith Hartmann, Mary Ma, Hixonia Nyasulu
48 VINCI Construction &
Materials FR 40.0% Graziella Gavezotti, Marie-Christine Lombard, Josiane Marquez, Ana Paula Pessoa, Pascale Sourisse, Yannick Assouad
49 VIVENDI Media FR 42.9% Nathalie Bricault, Yseulys Costes,
Aliza Jabès, Cathia Lawson-Hall, Virginie Morgon, Katie Stanton 50 VOLKSWAGEN
PREF Automobiles & Parts DE 15.0% Annika Falkengren, Babette Fröhlich, Louise Kiesling Source: Own representation based on the information from: https://www.stoxx.com/index-details?symbol=SX5E and the annual reports of the respective companies; retrieval date: 03/03/2017
As it can be seen, though some companies have a high percentage of women on their supervisory boards (for instance, the French companies Engie and BNP Parisbas), there is still much work to do, especially in companies such as Fresenius. Only claiming that diversity is important, is not enough. Companies need to rethink their visions and women need to be considered equal creators of the future.
5. Discussion and Conclusion
The present article explored meanings of value creation as understood by the companies of EURO STOXX 50 index. It tried to relate the concept of value creation with the presence of women on the boards of companies, it developed a model, which can help companies increase women presence at top level, and it presented the gender quota of EURO STOXX 50 companies.
One of the contributions of this article is rising awareness on how companies choose to report on their activity in the annual reports. What value means can differ from company to company, while stating that diversity and gender are important for a company still can be meaningless if it is not backed up by concrete actions. The presence of women on boards can be manifested not only by positively influencing a financial KPY, but also by bringing a change in the leadership style or in the strategic orientation of a company. The strategic performance cycle is in this sense a main contribution of the article, as it aims at helping companies to increase the number of women on boards, but this only if there is a real commitment of the company on this issue.
Moreover, the legal environment should be also considered. For instance, during 2015 there were many discussions in Germany about introducing a binding women quota for the supervisory boards of big listed companies, but the quota became obligatory only starting with 2016.
Furthermore, some changes should take place also at societal level. According to the “Special Eurobarometer 465 Gender Equality 2017”, 44 percent of respondents believe the most important role of a woman is to take care of her home and family and 43 percent think the most important role of a man is to earn money (European Commission, 2017). In this context, it might be difficult to implement change at higher levels, such as management or supervisory board of companies. Yet, gender legislation could be a first step in designing sustainable strategies.
We conclude by reiterating the call of the ILO: “more concerted efforts and advocacy are needed to share information on the benefits of utilizing women’s talent and skills at all levels, including in the boardroom” (ILO, 2015, p. 4).
References
1. Airbus Group (2015). Flying Ahead. Annual report 2015. Retrieved from https://www.airbus.com/content/dam/corporate-topics/financial-and-company-informat-ion/airbus-ra-2015-en-03.pdf
2. BASF (2015). BASF Report 2015. Economic, Environmental, and Social Performance. Retrieved from https://report.basf.com/2015/en/servicepages/downloads/files/BASF_Re-port_2015.pdf
3. Bayer (2015). Annual Report 2015. Augmented Version. Retrieved from: https://www.investor.bayer.de/en/reports/annual-reports/overview/
4. BMW (2015). Annual Report. Retrieved from https://www.bmwgroup.com/content/da- m/grpw/websites/bmwgroup_com/ir/downloads/en/2016/hv/2015-BMW-Group-Annual-Report.pdf
5. Buchwald, A., & Hottenrott, H. (2015). Women on the Board and Executive Duration – Evidence for European Listed Firms, Düsseldorf Institute for Competition Economics, Discussion Paper 178, 1-40.
6. Burkert, M., & Lueg, R. (2013). Differences in the Sophistication of Value-Based Management. The Role of Top Executives. Management Accounting Research, 24(1), 3-22.
7. Corkery, J.F., & Taylor, M. (2012). The gender gap: A quota for women on the board Retrieved from https://pdfs.semanticscholar.org/fe63/02c542c140d97a08677d420.pdf
8. Daimler (2015). Annual Report. Retrieved from https://www.daimler.com/docu-ments/investors/berichte/geschaeftsberichte/daimler/daimler-ir-annual-report-2015.pdf 9. Deutsche Telekom (2015). Annual Report. Retrieved from
https://www.telekom.com/-en/investor-relations/service/financial-calendar/details/annual-report-2015-420018
10. Dick, A. (2015). Female directors on German supervisory boards and firms’ financial performance. Retrieved from http://essay.utwente.nl/67308/1/DICK_BA_IBA.pdf
11. Dizik, A. (2015). Do quotas for corporate boards help women advance: Retrieved from http://review.chicagobooth.edu/magazine/spring-2015/do-quotas-for-corporate-boards-help-women-advance
12. European Commission (2017). Special Eurobarometer 465 Gender Equality 2017. Luxembourg: Publication office of the European Union. Retrieved from http://ibdigital.uib.es/greenstone/collect/portal_social/index/assoc/coeuro01/47.dir/coeuro 0147.pdf
13. European Commission (2019). 2019 Report on equality between women and men in the EU. Luxembourg: Publication office of the European Union. Retrieved from https://ec.europa.eu/info/sites/info/files/aid_development_cooperation_fundamental_right s/annual_report_ge_2019_en.pdf
14. Firk, S., Schrapp, S., & Wolff, K. (2016). Drivers of Value Creation – The Role of Value-Based Management and Underlying Institutions. Management Accounting Research, 33, 42-60.
15. Ferreira, D. (2014). Board Diversity: Should We Trust Research to Inform Policy? Corporate Governance: An International Review, 23(2), 108-111.
16. Fresenius (2015). Annual Report. Retrieved from https://www.fresenius.com/finan-cial_reporting/Fresenius_GB_US_GAAP_2015_englisch.pdf
17. Haspeslagh, P., Noda, T., & Boulos, F. (2001). It’s Not Just About the Numbers. [Online] Harvard Business Review. Retrieved from https://hbr.org/2001/07/its-not-just-about-the-numbers
18. International Labour Organisation (2015). Women in Business and Management. Gaining Momentum. Geneva: International Labour Office. Retrieved from http://www.ilo.org/wc-msp5/groups/public/dgreports/dcomm/publ/documents/publication/wcms_334882.pdf 19. Jacquot, S. (2017). European Union Gender Equality Policies since 1957. Retrieved from
http://ehne.fr/en/node/1125
20. Lepak, D. P., Smith, K. G., & Taylor, S. M. (2007). Value Creation and Value Capture: A Multilevel Perspective. Academy of Management Review, 32(1), 180-194.
21. Mahajan, G. (2016). Value Creation: The definitive Guide for business leaders. New Delhi: SAGE.
22. Mahajan, G. (2017). Value dominant Logic. Journal of Creating Value, 3(2), 217-235. 23. Marinova, S., Larimo, J., & Nummela, N. (Eds.) (2017). Value Creation in International
Business. Volume 1: An MNC Perspective. Cham: Palgrave Macmillan.
24. McKinsey (2007). Women Matter: Gender Diversity, a Corporate Performance Driver. Retrieved from https://www.raeng.org.uk/publications/other/women-matter-oct-2007 25. Nokia (2015). Innovation and Possibilities. Annual Report. Retrieved from
https://www.annualreportowl.com/Nokia/2015/Annual%20Report
26. OECD (2016). OECD Report to G7 Leaders on Women and Entrepreneurship. A summary of recent data and policy developments in G7 countries. [online] Retrieved from
https://www.oecd.org/gender/OECD-Report%20-to-G7-Leaders-on-Women-and-Entrepreneurship.pdf
27. SAP (2015). Annual Report. Reimagine your Business. Retrieved from https://www.sap.com/docs/download/investors/2015/sap-2015-annual-report.pdf
28. Simms, J. (2001). Marketing for value. Marketing. Retrieved from https://www.questia.com/magazine/1G1-76914287/marketing-for-value
29. STOXX, (2017). EURO STOXX 50. Retrieved from https://www.stoxx.com/index-details?symbol=SX5E.
30. Sullivan, R. (2015). Can Gender Quotas get more Women into Boardrooms? Bloomberg, Retrieved from https://www.bloomberg.com/news/articles/2015-07-01/can-gender-quotas-get-more-women-into-boardrooms.
31. Terjesen, S., Aguilera, R. V., & Lorenz, R. (2015). Legislating a Woman’s Seat on the Board: Institutional Factors Driving Gender Quotas for Boards of Directors. Journal of Business Ethics, 128(2), 233-251.
32. Unicredit (2015). Inside Real Life. A 3600 View. UniCredit S.p.A. 2015 Reports and Accounts. Retrieved from https://www.unicreditgroup.eu/content/dam/unicreditgroup- eu/documents/en/investors/financial-reports/2015/4Q15/UniCredit-SpA-2015-Reports-and-Accounts.pdf
33. Zanoni, P., Janssens, M., Benschop, Y., & Nkomo, S. (2010). Guest Editorial: Unpacking Diversity, Grasping Inequality: Rethinking Difference Through Critical Perspectives. Organization, 17(1), 9-29.
34. Musso F. (2011), "Small Retailing, Town Centres and Inland Territories. An “Extended Town Centre Management” Perspective", Public Administration & Regional Studies, 3rd Year, n. 2 (6), Galati University Press, pp. 37-58.
35. Musso F. (1999), Relazioni di canale e strategie di acquisto delle imprese commerciali. Potere e stabilità nella grande distribuzione britannica, Lint, Trieste, ISBN: 88-8190-071-8.
36. Musso F. (2013). Strategie e competitività internazionale delle piccole e medie imprese. Un'analisi sul settore della meccanica. Cedam, Padova.
37. Brondoni S., Musso F. (2010), “Ouverture de ‘Canali di Marketing e mercati globali’”, Symphonya: Emerging Issues in Management, n. 1, pp 1-6. ISSN: 1593-0300, EISSN: 1593-0319, doi:
10.4468/2010.1.01ouverture.
38. Musso F. (1996), "Potere e stabilità nei rapporti di fornitura della grande distribuzione britannica", Economia e Diritto del Terziario, n. 3, ISSN: 1593-9464, pp. 971-1011.
39. Musso F. (2000), Economie distrettuali e canali di distribuzione all’estero. Varietà di percorsi delle imprese pesaresi del mobile, INS-EDIT, Genova.
40. Musso F. (1997), “The Changing Role of Trade Co-operation in Regional Economies: A Case Study”, 37th European Regional Science Association Congress, Roma, Università degli Studi di Roma "Tor Vergata", Facoltà di Economia, August 26-29.
41. Musso F., Risso M. (2007). Sistemi di supporto alle decisioni di internazionalizzazione commerciale: un modello applicativo per le piccole e medie imprese, in Ferrero G. (ed.), Le ICT per la qualificazione delle Piccole Imprese Marchigiane, Carocci, Roma, 205-255. 42. Musso F. (2013), "Is Industrial Districts Logistics suitable for Industrial Parks?", Acta
Universitatis Danubius. Œconomica, Vol 9, No 4, pp. 221-233.
43. Musso F. (2004), Le relazioni con i mercati esteri delle imprese produttrici di mobili. Sistemi distrettuali e canali distributivi, Edizioni Goliardiche, Trieste.