NEW FINANCIAL DEVELOPMENT
INDICATORS: WITH A CRITICAL
CONTRIBUTION TO INEQUALITY EMPIRICS
Received: September 7, 2013
The employment of financial development indicators without due consideration to country/regional specific financial development realities remains an issue of substantial policy relevance. Financial depth in the perspective of money supply is not equal to l liabilities in every development context. This paper introduces complementary indicators to the existing Financial Development and Structure Database (FDSD). Dynamic panel system GMM estimations are applied. Different specifications, non
variables are used to check the consistency of estimated coefficients. Our results suggest that from an absolute standpoint (GDP base measures), all financial sectors are pro However, three interesting findings are drawn from m
expansion of the formal financial sector to the detriment of other financial sectors has a disequalizing income effect. (2) Growth of informal and semi
expense of the formal financial se income redistributive effect of semi
than the corresponding impact of informal finance. It unites two streams of research by contributing at the same time to the macroeconomic literature on measuring financial development and responding to the growing field of economic development by means of informal financial sector promotion and microfinance. The paper suggests a practicable way to disentangle the effects of the various financial sectors on economic development. The equation of financial depth in the perspective of money supply to liquid liabilities has put on the margin the burgeoning informal financial sector in developing countries. The phenomenon of mobile banking is such an example.
JEL Classification: E00; G20; I30; O17; O55
Keywords: Financial Development; Shadow Economy; Poverty; Inequality; Africa.
1. Introduction
Poverty and inequality remain daunting challenges in developing countr
three decades of financial reforms. In spite of this substantial policy relevant concern, inequality related studies have not been critically engaged in these countries due to lack and/or scarcity of relevant data (Kai & Hamori, 2009).
countries embarked on a chain of structural adjustment policies in the financial sector as part
NEW FINANCIAL DEVELOPMENT
INDICATORS: WITH A CRITICAL
CONTRIBUTION TO INEQUALITY EMPIRICS
SIMPLICE A. ASONGU
African Governance and Development Institute Yaoundé, Cameroon
Accepted: May 22, 2014 Online Published:
Abstract
The employment of financial development indicators without due consideration to country/regional specific financial development realities remains an issue of substantial policy relevance. Financial depth in the perspective of money supply is not equal to l liabilities in every development context. This paper introduces complementary indicators to the existing Financial Development and Structure Database (FDSD). Dynamic panel system GMM estimations are applied. Different specifications, non-overlapping intervals and control variables are used to check the consistency of estimated coefficients. Our results suggest that from an absolute standpoint (GDP base measures), all financial sectors are pro However, three interesting findings are drawn from measures of sector importance. (1) The expansion of the formal financial sector to the detriment of other financial sectors has a disequalizing income effect. (2) Growth of informal and semi-formal financial sectors at the expense of the formal financial sector has an income equalizing effect. (3) The positive income redistributive effect of semi-formal finance in financial sector competition is higher than the corresponding impact of informal finance. It unites two streams of research by same time to the macroeconomic literature on measuring financial development and responding to the growing field of economic development by means of informal financial sector promotion and microfinance. The paper suggests a practicable way the effects of the various financial sectors on economic development. The equation of financial depth in the perspective of money supply to liquid liabilities has put on the margin the burgeoning informal financial sector in developing countries. The
menon of mobile banking is such an example.
G20; I30; O17; O55
: Financial Development; Shadow Economy; Poverty; Inequality; Africa.
Poverty and inequality remain daunting challenges in developing countries despite close to three decades of financial reforms. In spite of this substantial policy relevant concern, inequality related studies have not been critically engaged in these countries due to lack and/or scarcity of relevant data (Kai & Hamori, 2009). Accordingly, many developing countries embarked on a chain of structural adjustment policies in the financial sector as part
NEW FINANCIAL DEVELOPMENT
INDICATORS: WITH A CRITICAL
CONTRIBUTION TO INEQUALITY EMPIRICS
SIMPLICE A. ASONGU
African Governance and Development Institute Yaoundé, Cameroon
Online Published: June 5, 2014
The employment of financial development indicators without due consideration to country/regional specific financial development realities remains an issue of substantial policy relevance. Financial depth in the perspective of money supply is not equal to liquid liabilities in every development context. This paper introduces complementary indicators to the existing Financial Development and Structure Database (FDSD). Dynamic panel system intervals and control variables are used to check the consistency of estimated coefficients. Our results suggest that from an absolute standpoint (GDP base measures), all financial sectors are pro-poor. easures of sector importance. (1) The expansion of the formal financial sector to the detriment of other financial sectors has a formal financial sectors at the ctor has an income equalizing effect. (3) The positive formal finance in financial sector competition is higher than the corresponding impact of informal finance. It unites two streams of research by same time to the macroeconomic literature on measuring financial development and responding to the growing field of economic development by means of informal financial sector promotion and microfinance. The paper suggests a practicable way the effects of the various financial sectors on economic development. The equation of financial depth in the perspective of money supply to liquid liabilities has put on the margin the burgeoning informal financial sector in developing countries. The
: Financial Development; Shadow Economy; Poverty; Inequality; Africa.
ies despite close to three decades of financial reforms. In spite of this substantial policy relevant concern, inequality related studies have not been critically engaged in these countries due to lack Accordingly, many developing countries embarked on a chain of structural adjustment policies in the financial sector as part
of reforms in the economic sector with the ambitious goals of mitigating inequality, enhancing economic prosperity and improving financial efficiency (Janine & Elbadawi, 1991). These reforms led to the adoption of some financial indicators that do not exhaustively calibrate the policy needs of poverty and/or inequality mitigation (Asongu, 2013a).
The employment of financial development indicators without due consideration to country/regional specific financial development realities remains an issue of substantial policy relevance. Usage of some indicators for instance is based on the presumption that they are generally valid (Gries, Kraft & Meierrieks, 2009)1, notwithstanding recent empirical evidence that not all indicators may matter in financial development (Asongu, 2013b). Furthermore, the absence of a consensus on the superiority of financial development indicators, especially the widely used proxy for financial depth (Gries, Kraft & Meierrieks, 2009) is deserving of research attention. As far as we have reviewed related literature, we suppose the absence of studies that focus on the quality of financial development indicators (with respect to contextual development concerns) is enough inspiration to search for the missing link. It is the objective of this paper to verify the validity of the financial depth indicator as applied to developing countries and hence, decompose it into new measures that substantially tackle financial development challenges in developing countries. The underlying impetus of the study is the misleading assumption that, money supply (financial depth) is a proxy for liquid liabilities in developing countries. This paper will therefore suggest a practicable way to disentangle the effects of the various financial sectors on economic development. We shall develop testable hypotheses and propositions for more refined financial development indicators and empirically verify their validity in the finance-inequality nexus. GDP and Money-supply oriented ratios are developed for each sector of the financial system. Our conception of the financial system goes beyond the realm of that expressed in the International Financial Statistics’ definition: it integrates the informal sector, hitherto a missing component in the existing measurement of monetary supply (M2).
The contribution of this paper to the finance-inequality literature is threefold. (1) It provides a macroeconomic assessment of the income-redistributive incidence of the informal financial sector. (2) The existing measurement of financial depth is disentangled to include a previously missing component and, the income-equalizing effect of each component is examined independently. (3) Financial sector importance measures are introduced to complement GDP-based indicators in order to investigate the dynamics of financial sector competition in the finance-inequality nexus.
The outcome of this study could be interesting to policy makers and researchers because, it unites two streams of research. It contributes at the same time to the macroeconomic literature on measuring financial development and, responds to the growing field of economic development by means of informal financial sector promotion and microfinance (Asongu, 2013cd, 2014a). The absence of sound fundamentals in a financial indicator might lead to inappropriate inferences and unhealthy policy recommendations. The rest of the paper is structured in the following manner. Section 2 examines the problem statement and the proposed solutions from the literature. Data and methodology are presented and outlined respectively in Section 3. Presentation of results, discussion and policy recommendations are covered in Section 4. We conclude with Section 5.
1
Gries, Kraft & Meierrieks (2009) state: “In the related literature, several proxies for financial deepening have been suggested, for example, monetary aggregates such as M2 on GDP. To date there is no consensus on the superiority of any indicator” (p. 1851).
2. Problem statement and solutions
A shortcoming in the definition of the financial system by the International Monetary Fund (IMF) is core to this problem statement because it is more adapted to developed countries. According to the International Financial Statistics (IFS), the financial s
formal and semi-formal sectors; that is, deposit money banks and other financial institutions (see lines 24, 25 and 45 of the IFS, 2008). While this definition could be quasi
developed countries, it fails to take account of t
countries. This begs the concern of knowing the role of the informal sector (in economic development).
2.1 The International Financial Statistics’ (2008) conception of the financial system
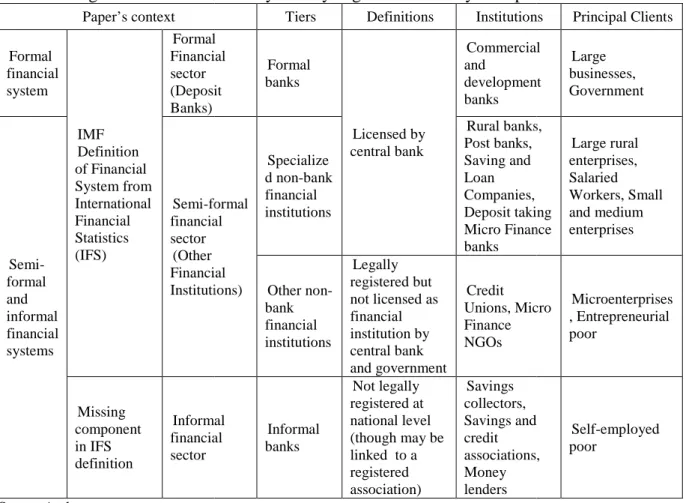
As detailed in Table 1 below inspired by Steel (2006), formal finance refers to services that are regulated by the central bank and other supervisory authorities. Semi
enables a distinction between formal and informal finance. This is the segment of finance tha is in a formal financial environment but not formally recognized. A good example is microfinance. Informal finance is one that is not arranged via formal agreements and not enforced through the legal system. From the fourth column, the last two types of
lending’ are very common in developing countries, particularly among the financially excluded or those on low incomes. Unfortunately, the IFS definition completely marginalizes the last types. We postulate that, based on the weight of availabl
should no longer be undermined in the definition of the financial system.
Table 1 – Segments of the financial system by degree of formality in Paper’s context Paper’s context Formal financial system IMF Definition of Financial System from International Financial Statistics (IFS) Formal Financial sector (Deposit Banks) Semi-formal and informal financial systems Semi-formal financial sector (Other Financial Institutions) Missing component in IFS definition Informal financial sector Source Author
2. Problem statement and solutions
A shortcoming in the definition of the financial system by the International Monetary Fund (IMF) is core to this problem statement because it is more adapted to developed countries. According to the International Financial Statistics (IFS), the financial system consists of the formal sectors; that is, deposit money banks and other financial institutions (see lines 24, 25 and 45 of the IFS, 2008). While this definition could be quasi
developed countries, it fails to take account of the informal financial sector in undeveloped countries. This begs the concern of knowing the role of the informal sector (in economic
2.1 The International Financial Statistics’ (2008) conception of the financial system
1 below inspired by Steel (2006), formal finance refers to services that are regulated by the central bank and other supervisory authorities. Semi
enables a distinction between formal and informal finance. This is the segment of finance tha is in a formal financial environment but not formally recognized. A good example is microfinance. Informal finance is one that is not arranged via formal agreements and not enforced through the legal system. From the fourth column, the last two types of
lending’ are very common in developing countries, particularly among the financially excluded or those on low incomes. Unfortunately, the IFS definition completely marginalizes the last types. We postulate that, based on the weight of available evidence, informal finance should no longer be undermined in the definition of the financial system.
Segments of the financial system by degree of formality in Paper’s context Tiers Definitions Institutions
Formal Financial (Deposit Formal banks Licensed by central bank Commercial and development banks formal financial (Other Financial Institutions) Specialize d non-bank financial institutions Rural banks, Post banks, Saving and Loan Companies, Deposit taking Micro Finance banks Other non-bank financial institutions Legally registered but not licensed as financial institution by central bank and government Credit Unions, Micro Finance NGOs Informal financial Informal banks Not legally registered at national level (though may be linked to a registered association) Savings collectors, Savings and credit associations, Money lenders
A shortcoming in the definition of the financial system by the International Monetary Fund (IMF) is core to this problem statement because it is more adapted to developed countries. ystem consists of the formal sectors; that is, deposit money banks and other financial institutions (see lines 24, 25 and 45 of the IFS, 2008). While this definition could be quasi-true for he informal financial sector in undeveloped countries. This begs the concern of knowing the role of the informal sector (in economic
2.1 The International Financial Statistics’ (2008) conception of the financial system
1 below inspired by Steel (2006), formal finance refers to services that are regulated by the central bank and other supervisory authorities. Semi-formal finance enables a distinction between formal and informal finance. This is the segment of finance that is in a formal financial environment but not formally recognized. A good example is microfinance. Informal finance is one that is not arranged via formal agreements and not enforced through the legal system. From the fourth column, the last two types of ‘saving and lending’ are very common in developing countries, particularly among the financially excluded or those on low incomes. Unfortunately, the IFS definition completely marginalizes e evidence, informal finance
Segments of the financial system by degree of formality in Paper’s context
Institutions Principal Clients Commercial development Large businesses, Government Rural banks, Companies, Deposit taking Micro Finance Large rural enterprises, Salaried Workers, Small and medium enterprises
Unions, Micro Microenterprises , Entrepreneurial poor Savings and associations, Self-employed poor
2.2 Rethinking financial development indicators
As far as we have reviewed, but for Beck, Demirgüç-Kunt & Levine (1999), the absence of studies that underline the quality of financial development indicators with regard to contextual development is a significant missing component in the financial development literature. Some studies have identified the issue, but fallen short of addressing it. Hence, it has been well documented that the financial depth indicator as applied to developing countries is very misleading as it does not integrate the realities and challenges of financial intermediary development (Demetriades & Hussein, 1996; Khumbhakar & Mavrotas, 2005; Ang & McKibbin, 2007; Abu-Bader & Abu-Qarn, 2008). Therefore, a motivation of this work hinges on an existing debate over the contextual quality of financial development indicators. Accordingly, as we shall cover the first generation solutions before proposing second generation solutions.
2.2.1 First generation solutions
As far as we have reviewed, first generation solutions consist of a class of studies that has identified the issue with the IFS definition of the financial system and tried to address it superficially without given due consideration to the informal financial sector. The kernel of this categorization is that, while trying to address the issue, informal finance is still marginalized. Money supply (M2) which represents the money stock has been widely employed as a standard measurement of liquid liabilities in many studies for decades (World Bank, 1989; King & Levine, 1993). While, this indicator is quasi-true in the developed world, its application to developing countries has faced substantial criticisms. Critics have stressed that in developing countries; an improvement in M2 may reflect an extensive use of currency rather than an increase in bank deposits (liquid liabilities). In attempts to address this problem in empirical literature, a number of solutions have been suggested.
Firstly, in a bid to curtail this shortcoming, Demetriades & Hussein (1996) have proposed the subtraction of currency outside banks from M2 when measuring liquid liabilities in developing countries. Abu-Bader & Abu-Qarn (2008) amongst others have recently followed suit in adjusting M2. However, these adjustments have not emphasized financial sector importance, because the informal financial sector has still been ruled-out as marginal in the adjustment.
Secondly, some authors have sought to address the concern by determining a variable that broadly takes account of financial depth. They have used the first principal component of money supply and a combination of other financial measures (Khumbhakar & Mavrotas, 2005; Ang & McKibbin, 2007; Gries, Kraft & Meierrieks, 2009). In so doing, they have decreased the dimensionality of the set of variables without losing much information from the initial dataset on the one hand; and on the other hand, decreased problems related to the quality of M2 as a proxy for liquid liabilities. However, the main drawback of this approach is that for the most part, M2 is mixed with concepts of financial activity (private domestic credit), financial size (deposit bank assets/central bank assets plus deposit bank assets), financial allocation efficiency (bank credit/bank deposits)…etc.
2.2.2. Second generation solutions
We propose second generation solutions in Table 2 below which is a practical way of disentangling the effects of formal, semi-formal and informal financial development sectors contained in M2. Propositions in Table 2 are based on a rethinking of the IFS definition of the financial system. Hence, the new definition integrates a previously missing informal financial sector component into the definition of the financial system. It disentangles the existing measurement into formal and semiformal financial sectors. Moreover, it proposes measures of
financial sector importance that appreciate evidence of financial sector competition. These second generation solutions are cons
sector competition (Asongu, 2014bcd). Table 2 – Summary of propositions
Panel A: GDP Propositions Name(s)
Proposition 1 Formal financial
development
Proposition 2 Semi-formal
financial development
Proposition 3 Informal financial
development Proposition 4
Informal and semi-formal financial development
Panel B: Measures of financial sector importance
Proposition 5 Financial intermediary formalization Proposition 6 Financial intermediary ‘semi-formalization’ Proposition 7 Financial intermediary ‘informalization’ Proposition 8 Financial intermediary ‘semi-formalization and informalization’
N.B: Propositions 5, 6, 7 add up to unity (one); arithmetically spelling
Hence, when their time series properties are considered in empirical analysis, the evolution of one sector is to the detriment of other sectors and vice-versa.
2.3 Scope and positioning of the paper
Poverty and inequality undoubtedly remain serious challenges to economic and human developments. Financial repression and its pervasiveness of mitigating economic growth has been elaborately covered by a substantial bulk of the literature (McKinnon, 1973;
1973). In the 1980s and 1990s, most African countries engaged in a series of structural and policy adjustments in the financial sector as part of economic reforms with the goal of given
2 Lines 24 and 25 of the IFS (October 3
Lines 24, 25 and 45 of the IFS (2008
4 In undeveloped countries M2 is not equal t
Whereas, in undeveloped countries bd/M2<1, in developed countri
measures the rate at which money in circulation is absorbed by the banking is defined as the propensity of the formal banking
5 This indicator measures the level at
and informal sectors.
6 This proposition shows the rate at which the informal financial sector is developing at the cost of formal and
semi-formal sectors.
7 The proposition appreciates the deterioration of the formal banking sector to the benefit of other sectors
(informal and semi-formal). From common sense, proposition meaning the former (formal financial development at the expense of ot deterioration) should display a perfectly negative coefficient of correlation
a high positive correlation with Proposition 8 and therefore, only the former will be used in the e
financial sector importance that appreciate evidence of financial sector competition. These second generation solutions are consistent with a growing stream of literature on financial sector competition (Asongu, 2014bcd).
Summary of propositions
Panel A: GDP-based financial development indicators
Formula Elucidation
Bank deposits/GDP Bank deposits2 here refer to demand, time and
saving deposits in deposit money banks. financial development
(Financial deposits – Bank deposits)/ GDP
Financial deposits3 are demand, time and saving
deposits in deposit money banks and other financial institutions.
(Money Supply – Financial deposits)/GDP
(Money Supply – Bank deposits)/GDP
Panel B: Measures of financial sector importance
Bank deposits/ Money Supply (M2)
From ‘informal and semi
financial development (formalization) (Financial deposits - Bank
deposits)/ Money Supply
From ‘informal and formal’ to financial development (Semi (Money Supply – Financial
deposits)/ Money Supply
From ‘formal and
semi-financial development (Informalisation) (Money Supply – Bank
Deposits)/Money Supply
Formal to ‘informal and semi
development: (Semi-formalization and informalization) 7
N.B: Propositions 5, 6, 7 add up to unity (one); arithmetically spelling-out the underlying assumption of sector importance. eries properties are considered in empirical analysis, the evolution of one sector is to the detriment
2.3 Scope and positioning of the paper
Poverty and inequality undoubtedly remain serious challenges to economic and human developments. Financial repression and its pervasiveness of mitigating economic growth has been elaborately covered by a substantial bulk of the literature (McKinnon, 1973;
1973). In the 1980s and 1990s, most African countries engaged in a series of structural and policy adjustments in the financial sector as part of economic reforms with the goal of given
October 2008).
2008).
In undeveloped countries M2 is not equal to liquid liabilities (liquid liabilities equal bank deposits: bd). in undeveloped countries bd/M2<1, in developed countries bd/M2 is almost equal to 1.
measures the rate at which money in circulation is absorbed by the banking system. Financial formalization here formal banking system to absorb money in circulation.
This indicator measures the level at which the semi-formal financial sector evolves to the detriment of formal This proposition shows the rate at which the informal financial sector is developing at the cost of formal and iates the deterioration of the formal banking sector to the benefit of other sectors From common sense, propositions 5 and 8 should be perfectly antagonistic, meaning the former (formal financial development at the expense of other sectors) and the later (formal sector deterioration) should display a perfectly negative coefficient of correlation (See Appendix 2). Proposition 7 has a high positive correlation with Proposition 8 and therefore, only the former will be used in the e
financial sector importance that appreciate evidence of financial sector competition. These istent with a growing stream of literature on financial
Elucidation
here refer to demand, time and saving deposits in deposit money banks.
are demand, time and saving deposits in deposit money banks and other
From ‘informal and semi-formal’ to formal
financial development (formalization)4 .
From ‘informal and formal’ to semi-formal
financial development (Semi-formalization)5.
-formal’ to informal
financial development (Informalisation)6.
informal and semi-formal’ financial
formalization and
out the underlying assumption of sector importance. eries properties are considered in empirical analysis, the evolution of one sector is to the detriment
Poverty and inequality undoubtedly remain serious challenges to economic and human developments. Financial repression and its pervasiveness of mitigating economic growth has been elaborately covered by a substantial bulk of the literature (McKinnon, 1973; Shaw, 1973). In the 1980s and 1990s, most African countries engaged in a series of structural and policy adjustments in the financial sector as part of economic reforms with the goal of given
o liquid liabilities (liquid liabilities equal bank deposits: bd). es bd/M2 is almost equal to 1. This indicator Financial formalization here financial sector evolves to the detriment of formal This proposition shows the rate at which the informal financial sector is developing at the cost of formal and iates the deterioration of the formal banking sector to the benefit of other sectors 5 and 8 should be perfectly antagonistic, her sectors) and the later (formal sector (See Appendix 2). Proposition 7 has a high positive correlation with Proposition 8 and therefore, only the former will be used in the empirical section.
impetus to economic growth, as well as improving overall economic and financial efficiency (Janine & Elbadawi, 1992). Hitherto, owing to data issues on income-inequality for Africa, only two studies to the best of our knowledge have addressed the finance-inequality nexus in the continent (Kai & Hamori, 2009; Batuo, Guidi & Mlambo, 2010).
A common drawback of these two works is the very limited application of the concept of financial development, which we have broadened with the propositions in the previous section. Restricting the concept of finance to only its dynamics of depth (Kai & Hamori, 2009; Batuo, Guidi & Mlambo, 2010) and activity (Batuo, Guidi & Mlambo, 2010) does not paint a full picture of the African inequality-finance nexus for the following reasons.
Firstly, as we have earlier discussed, a distinction between money supply and liquid liabilities in the conception of financial depth is very important in separating the income redistributive-effect of ‘bank mobilized funds’ from that of overall money supply8.
Secondly, it is our conviction that the African finance-inequality nexus cannot be effectively assessed without taking into consideration the semi-formal and informal sectors which are more close to the poor segments of the population than the formal financial sector.
Thirdly, contrary to the motivation of Batuo, Guidi & Mlambo, (2010), the effect on inequality of first and second generation financial reforms in Africa cannot be limited to formal finance.
In light of the above points, drawing from the experience of a continent that has been implementing development financial reforms, motivated by the propositions highlighted above and shortcomings of existing empirical literature on the African inequality nexus, the empirical section of this paper will provide additional dimensions to the debate. Hence, the following hypotheses will be tested in the empirical section.
Hypothesis 1: The informal financial sector (a previously missing component in the definition
of money supply) is good for the poor.
Hypothesis 2: Disentangling different components of the existing measurement (financial
system) into formal (banking sector) and semi-formal (other financial institutions) financial sector indicators contribute significantly to the finance-inequality nexus debate.
Hypothesis 3: Introducing measures of sector importance provides interesting dynamics of
financial sector competition in the finance-inequality nexus.
3. Data and Methodology
3.1 Data
We assess a sample of 28 African countries with annual data from African Development Indicators (ADI) of the World Bank (WB) for the period 1996 to 2010. The limitation to a 15 year span is based on constraints in data availability. Summary statistics (and presentation of countries), correlation analysis and variable definitions are presented in Appendix 1, Appendix 2 and Appendix 3 respectively. The summary statistics of the variables used in the panel regressions show that, there is quite a degree of variation in the data utilized so that one should be confident that reasonable estimated relationships should emerge. Both the standard deviations and minimum/maximum values validate this assertion and further lend credit to the
8 This is because, a great chunk of the monetary base in the African continent circulates outside the banking
sector, therefore an increase in money supply may reflect the increase in the use of currency rather than a strengthening of financial system deposits.
inappropriateness of a parametric model that assumes a particular functional distribution. The purpose of the correlation matrix is to mitigate
multicollinearity. Based on the correlation coefficients, there do not appear to be any serious problems with respect of the relationships to be estimated.
The indicator for inequality is the GINI coefficient values of the frequency income
a coefficient of one expresses maximal inequality. The GINI coefficient which is commonly used as a measure of inequality in inco
disciplines studying inequality: sociology, economics, health science, agriculture…etc Guidi & Mlambo, 2010).
Control variables include: inflation, government expenditure, economic prosperity (GDP growth), population growth, foreign
foreign direct investment: FDI). We expect: high inflation to fuel inequality (Albanesi, 2007) while, low inflation should reduce it (Bulir, 1998; Lopez, 2004); government
tainted by corrupt malpractices) to mitigate inequality and; GDP growth to reduce inequality conditional on even-distribution of the fruits of economic prosperity. The impact of foreign aid on inequality is contingent on the quality of ins
growth on inequality should to be positive (AfDB, 2012, p.3). We expect globalization both from trade and capital openness perspectives to have a negative income
consistent with recent African
from intuition, trade can either increase or decrease inequality depending on the proportion of the poor relying on agricultural exports. On the other hand, cheap imports could increase savings and hence, indirectly improve the income
too much imports of ‘substitution goods’ produced by domestic industries could fuel income inequality if majority of the population in the lower
the affected industries for subsistence income. The impact of human development on inequality depends on the proportion of the poor in the following three dimensions (with respect to national average): GDP per capita, life expectancy and, literac
3.2 Methodology
Estimation with dynamic panel data has some important advantages and one disadvantage relative to cross-country analysis (Demirgüç
first positive note: (1) it makes use both of time
data; (2) in cross-country regressions, the unobserved country error term, so that correlation between the er
biased estimated coefficients. More so, in cross
variable is included among the explanatory variables, the country
correlated with the regressors. A means of controlling for the presence of unobserved country specific effects is to first-difference the regression equation to eliminate the country
effect, and then employ instrumental variables to take account of endogeneity.
The endogeneity issue is the second edge of the dynamic panel estimation technique. Uncontrolled endogeneity can significantly bias estimates and lead to misleading inferences. Dynamic panel data analysis accounts for this endogeneity issue by using lagged
exogenous variables as instruments
9 On a more general note, an indicator is endogenous when it is correlated with the error term. Endogeneity can
result from simultaneity or omitted variables, autoregression with autocorrelated errors and measurement error. In addition, a loop of causality between the independent variable and the dependent parameter results in endogeneity.
inappropriateness of a parametric model that assumes a particular functional distribution. The purpose of the correlation matrix is to mitigate issues resulting from overparametization and multicollinearity. Based on the correlation coefficients, there do not appear to be any serious problems with respect of the relationships to be estimated.
The indicator for inequality is the GINI coefficient which measures disparity among values of the frequency income-distribution. A value of zero represents perfect equality while a coefficient of one expresses maximal inequality. The GINI coefficient which is commonly used as a measure of inequality in income or wealth has found application in diverse disciplines studying inequality: sociology, economics, health science, agriculture…etc
Control variables include: inflation, government expenditure, economic prosperity (GDP th), population growth, foreign-aid, human development and globalization (trade and foreign direct investment: FDI). We expect: high inflation to fuel inequality (Albanesi, 2007) while, low inflation should reduce it (Bulir, 1998; Lopez, 2004); government
tainted by corrupt malpractices) to mitigate inequality and; GDP growth to reduce inequality distribution of the fruits of economic prosperity. The impact of foreign aid on inequality is contingent on the quality of institutions. The incidence of population growth on inequality should to be positive (AfDB, 2012, p.3). We expect globalization both from trade and capital openness perspectives to have a negative income- redistributive effect: consistent with recent African inequality literature (Kai & Hamori, 2009, p.15). However from intuition, trade can either increase or decrease inequality depending on the proportion of the poor relying on agricultural exports. On the other hand, cheap imports could increase hence, indirectly improve the income-distribution of the poor. In the same vein, too much imports of ‘substitution goods’ produced by domestic industries could fuel income inequality if majority of the population in the lower-income brackets depend substan
the affected industries for subsistence income. The impact of human development on inequality depends on the proportion of the poor in the following three dimensions (with respect to national average): GDP per capita, life expectancy and, literacy rate.
Estimation with dynamic panel data has some important advantages and one disadvantage country analysis (Demirgüç-Kunt & Levine, 2008; Asongu
first positive note: (1) it makes use both of time-series and the cross sectional variation in the country regressions, the unobserved country-specific effect is part of the error term, so that correlation between the error term and the independent variables results in biased estimated coefficients. More so, in cross-country regressions, if the lagged endogenous variable is included among the explanatory variables, the country-specific effect is certainly the regressors. A means of controlling for the presence of unobserved country
difference the regression equation to eliminate the country effect, and then employ instrumental variables to take account of endogeneity.
The endogeneity issue is the second edge of the dynamic panel estimation technique. Uncontrolled endogeneity can significantly bias estimates and lead to misleading inferences. Dynamic panel data analysis accounts for this endogeneity issue by using lagged
exogenous variables as instruments9.
On a more general note, an indicator is endogenous when it is correlated with the error term. Endogeneity can result from simultaneity or omitted variables, autoregression with autocorrelated errors and measurement error. ition, a loop of causality between the independent variable and the dependent parameter results in inappropriateness of a parametric model that assumes a particular functional distribution. The issues resulting from overparametization and multicollinearity. Based on the correlation coefficients, there do not appear to be any serious which measures disparity among distribution. A value of zero represents perfect equality while a coefficient of one expresses maximal inequality. The GINI coefficient which is commonly me or wealth has found application in diverse disciplines studying inequality: sociology, economics, health science, agriculture…etc (Batuo, Control variables include: inflation, government expenditure, economic prosperity (GDP aid, human development and globalization (trade and foreign direct investment: FDI). We expect: high inflation to fuel inequality (Albanesi, 2007) while, low inflation should reduce it (Bulir, 1998; Lopez, 2004); government expenditure (not tainted by corrupt malpractices) to mitigate inequality and; GDP growth to reduce inequality distribution of the fruits of economic prosperity. The impact of
foreign-titutions. The incidence of population growth on inequality should to be positive (AfDB, 2012, p.3). We expect globalization both redistributive effect: inequality literature (Kai & Hamori, 2009, p.15). However from intuition, trade can either increase or decrease inequality depending on the proportion of the poor relying on agricultural exports. On the other hand, cheap imports could increase distribution of the poor. In the same vein, too much imports of ‘substitution goods’ produced by domestic industries could fuel
income-income brackets depend substantially on the affected industries for subsistence income. The impact of human development on inequality depends on the proportion of the poor in the following three dimensions (with
y rate.
Estimation with dynamic panel data has some important advantages and one disadvantage Kunt & Levine, 2008; Asongu, 2013e). On the series and the cross sectional variation in the specific effect is part of the ror term and the independent variables results in country regressions, if the lagged endogenous specific effect is certainly the regressors. A means of controlling for the presence of unobserved
country-difference the regression equation to eliminate the country-specific effect, and then employ instrumental variables to take account of endogeneity.
The endogeneity issue is the second edge of the dynamic panel estimation technique. Uncontrolled endogeneity can significantly bias estimates and lead to misleading inferences. Dynamic panel data analysis accounts for this endogeneity issue by using lagged values of
On a more general note, an indicator is endogenous when it is correlated with the error term. Endogeneity can result from simultaneity or omitted variables, autoregression with autocorrelated errors and measurement error. ition, a loop of causality between the independent variable and the dependent parameter results in
The principal concern associated with dynamic panel data analysis is the usage of data-average over shorter time spans. By implication, the estimated results reveal short-run impacts and not long-term effects, which should be kept in mind when interpreting and discussing results. In the context our paper, we shall overcome this issue by using both ‘full data’ and ‘data averages’ in terms of non-overlapping intervals. For robustness purposes, we shall use two-year10, three-year11 and five-year12 non-overlapping intervals.
The dynamic panel regression model is expressed as follows:
t i t i t i y t i x t i t i Iq P W Iq, =
σ
0+σ
1 ,−1+σ
, +σ
, +η
+ξ
+ε
, (1) where ‘t’ stands for the period and ‘i’ represents a country. Iq is the inequality rate; P , the vector of propositions with 1<x<9. Wi,t is a vector of control variables with 9< y<17 ,η
i is a country-specific effect,ξ
t is a time-specific constant and εi,t an error term. Estimates will be unbiased if and only if, the independent variables above demonstrate strict exogeneity. Unfortunately, this is not the case in the real world because: (1) while thepropositions could have substantial incidences on inequality, the reverse effect cannot be
ruled-out because, the redistributive quality of income in an economy also has some bearing on financial sector development13; (2) the propositions could be correlated with the error term (εi,t); (3) country- and time-specific effects could also be correlated with other variables in the model, which is often the case with lagged dependent variables included in the equations. Hence, arises an issue of endogeneity owing to endogenous propositions. A way of dealing with the problem of the correlation between the individual specific-effect and the lagged inequality variables involves eliminating the individual effects by first differencing. Therefore, Eq. (1) becomes:
) ( ) ( , 1 , 2 , , 1 1 1 , ,t − it− = it− − it− + x it− it− i Iq Iq Iq P P Iq
σ
σ
+σy(Wi,t −Wi,t−1)+(ξt −ξt−1)+(εi,t−εi,t−1) (2)However Eq. (2) presents another issue; estimation by Ordinary Least Square (OLS) is still biased because there remains a correlation between the lagged inequality independent variable and the disturbance term. To tackle this issue, we estimate the regression in differences jointly with the regression in levels using the Generalized Method of Moments (GMM) estimation. The procedure uses lagged levels of the regressors as instruments in the difference equation, and lagged differences of the regressors as instruments in the levels equation, thus exploiting all the orthogonality conditions between the lagged inequality variables and the error term. Between the difference GMM estimator (Arellano & Bond, 1991) and system GMM estimator (Arellano & Bover, 1995; Blundell & Bond, 1998), we choose the latter in accordance with Bond, Hoeffler & Tample (2001, 3-4). The system GMM has been confirmed to be better in recent poverty (Arestis & Caner, 2010) and African finance (Batuo & Kupulike, 2010) literature.
10 We have eight two-year non-overlapping intervals: 1996; 1997-1998; 1999-2000; 2001-2002; 2003-2004;
2005-2006; 2007-2008; 2009-2010.
11 There are five three-year non-overlapping intervals: 1996-1998; 1999-2001; 2002-2004; 2005-2007;
2008-2010.
12 The corresponding five-year non-overlapping intervals are three: 1996-2000; 2001-2005; 2006-2010. 13
From intuition and common sense, increasing inequality is likely to have a more favorable impact on formal financial development; since bank accounts are mostly held by the rich.
In specifying the dynamic panel system estimation, because it corrects the residuals for heteroscedasticity. In the assumed to be homoscedastic. The assumption of no auto crucial as past lagged propositions
Also, the estimation depends on the assumption that the lagged values of the inequality variable and other propositions
of the level equation are not auto
residuals should be significant whereas their second
be. The validity of the instruments is examined with the Sargan over test (OIR). In summary, the main arguments for using the
does not eliminate cross-country variation, it mitigates potential biases of the difference estimator in small samples, and it can control for the potential endogeneity of all
Beside the control for endogeneity and unobserved heterogeneity, further robustness of our models is ensured by the following. (1) Usage of both ‘full data’ and ‘average data’ with non-overlapping intervals to capture the long
coefficients respectively. Hence, in addition to the full dataset, we have three categories of non-overlapping intervals sub
of two system GMM specifications with differ
4. Empirical Analysis
4.1 Presentation of results
From the estimates presented in Table 3, with respect to Panel A based’ and
financial-sector-common.
(1) We notice that initial values of inequality have positive significant signs. Coefficients corresponding to these initial values of inequality are less than one, suggesting that inequality in converging in Africa; an indication of potential broa
policy measures. Discussing the speed of convergence and time required to achieve full conditional convergence will be out of scope. However, it is worthwhile highlighting that, conditional convergence is contingent on th
based on the propositions, it could be inferred that countries with low inequality rates are catching-up their counterparts with higher rates (conditional on the
(2) But for the two-year and fi
examine the null hypothesis of no serial correlation of residual in first
the estimations do not suffer from serial correlation issues. While evidence for serial correlation is thin for the two
feasible for the five-year NOI owing to constraints in degrees of freedom. Hence, results of the five-year NOI will be purely informative and not object of any inferences f
of doubt.
(3) The Sargan OIR test for the validity of the instruments compares the sample moment conditions with their population analog. The null hypothesis of this test is the position that, the lagged differences of the
errors in the level equations. In other words, the instruments explain inequality through no other mechanisms beside the proposed channels, conditional on other covariates (control
14
We had wished to use a poverty headcount indicator as the alternative measure of inequality but the available data from World Development Indicators is so scanty and/or substantially short of degrees of freedom.
In specifying the dynamic panel system estimation, we choose the
because it corrects the residuals for heteroscedasticity. In the first-step, the residuals are assumed to be homoscedastic. The assumption of no auto-correlation in the residuals is
propositions are to be used as instruments for the dependent variables.
Also, the estimation depends on the assumption that the lagged values of the inequality
propositions are valid instruments in the regression. When the error terms
of the level equation are not auto-correlated, the first-order auto-correlation of the differenced residuals should be significant whereas their second-order auto-correlation:
be. The validity of the instruments is examined with the Sargan over-identifying restrictions ummary, the main arguments for using the system GMM estimation are that it country variation, it mitigates potential biases of the difference estimator in small samples, and it can control for the potential endogeneity of all
Beside the control for endogeneity and unobserved heterogeneity, further robustness of our models is ensured by the following. (1) Usage of both ‘full data’ and ‘average data’ with overlapping intervals to capture the long-term and short-run tendencies of estimated coefficients respectively. Hence, in addition to the full dataset, we have three categories of overlapping intervals sub-datasets already discussed in the data section. (2) Employment of two system GMM specifications with different control variables14.
From the estimates presented in Table 3, with respect to Panel A and Panel B for ‘GDP -importance measures respectively, four interpretations are (1) We notice that initial values of inequality have positive significant signs. Coefficients corresponding to these initial values of inequality are less than one, suggesting that inequality in converging in Africa; an indication of potential broad and blanket inequality reduction policy measures. Discussing the speed of convergence and time required to achieve full conditional convergence will be out of scope. However, it is worthwhile highlighting that, conditional convergence is contingent on the variables we model or empirical test. Hence, , it could be inferred that countries with low inequality rates are up their counterparts with higher rates (conditional on the propositions
year and five-year NOI, the report of the serial correlation test used to examine the null hypothesis of no serial correlation of residual in first-difference, confirms the estimations do not suffer from serial correlation issues. While evidence for serial n is thin for the two-year NOI (at a 10% significance level), the AR(2) test is not year NOI owing to constraints in degrees of freedom. Hence, results of year NOI will be purely informative and not object of any inferences f
(3) The Sargan OIR test for the validity of the instruments compares the sample moment conditions with their population analog. The null hypothesis of this test is the position that, the lagged differences of the propositions and control variables are uncorrelated with the errors in the level equations. In other words, the instruments explain inequality through no other mechanisms beside the proposed channels, conditional on other covariates (control
We had wished to use a poverty headcount indicator as the alternative measure of inequality but the available ld Development Indicators is so scanty and/or substantially short of degrees of freedom.
we choose the second-step GMM , the residuals are correlation in the residuals is r the dependent variables. Also, the estimation depends on the assumption that the lagged values of the inequality are valid instruments in the regression. When the error terms correlation of the differenced correlation: AR(2) should not identifying restrictions GMM estimation are that it country variation, it mitigates potential biases of the difference estimator in small samples, and it can control for the potential endogeneity of all propositions.
Beside the control for endogeneity and unobserved heterogeneity, further robustness of our models is ensured by the following. (1) Usage of both ‘full data’ and ‘average data’ with tendencies of estimated coefficients respectively. Hence, in addition to the full dataset, we have three categories of datasets already discussed in the data section. (2) Employment
and Panel B for ‘GDP-importance measures respectively, four interpretations are (1) We notice that initial values of inequality have positive significant signs. Coefficients corresponding to these initial values of inequality are less than one, suggesting that inequality d and blanket inequality reduction policy measures. Discussing the speed of convergence and time required to achieve full conditional convergence will be out of scope. However, it is worthwhile highlighting that, e variables we model or empirical test. Hence, , it could be inferred that countries with low inequality rates are
propositions).
year NOI, the report of the serial correlation test used to difference, confirms the estimations do not suffer from serial correlation issues. While evidence for serial year NOI (at a 10% significance level), the AR(2) test is not year NOI owing to constraints in degrees of freedom. Hence, results of year NOI will be purely informative and not object of any inferences for the benefit (3) The Sargan OIR test for the validity of the instruments compares the sample moment conditions with their population analog. The null hypothesis of this test is the position that, control variables are uncorrelated with the errors in the level equations. In other words, the instruments explain inequality through no other mechanisms beside the proposed channels, conditional on other covariates (control
We had wished to use a poverty headcount indicator as the alternative measure of inequality but the available ld Development Indicators is so scanty and/or substantially short of degrees of freedom.
variables). The overwhelming rejection of the null hypothesis of the OIR test (across specifications and panels) points to the validity of the instruments.
(4) The Wald test for the joint significance of estimated coefficients also provides appealing results at the 1% significance level.
4.2 Discussion of results
Based on Panel A of Table 3, the following conclusions could be drawn.
(1) The formal, semi-formal, and informal financial sectors all have negative incidences on inequality. This implies, all financial sectors have a positive income redistributive effect. Ultimately, improvement in financial sector shares relative to economic prosperity (GDP growth) is good for the poor. The intuition behind this interpretation is twofold. On the one hand, holding GDP growth and other things constant, financial development which is a constituent of GDP growth will mitigate poverty by its equalizing effect on income-distribution. On the other hand, if the share of financial sector development in GDP growth is greater in comparison to other macroeconomic components of GDP growth, the direct effect on income distribution will be an equalizing one. Ultimately, the equalizing income-effect of financial sector measures (that are relative to GDP) is consistent with recent African finance-inequality literature (Batuo, Guidi & Mlambo, 2010). From a broad perspective, the findings are also in line with empirical (Beck, Demirgüç-Kunt & Levine, 2004; Beck, Demirgüç-Kunt & Levine, 2007; Kai & Hamori, 2009) and theoretical (Galor & Zeira, 1993; Banerjee & Newman, 1993) literature which postulate a negative and linear relationship between financial development and income-inequality.
(2) As for the control variables, human development increases inequality while population growth mitigates it. The negative impact of human development on inequality implies a diminishing proportion of the following three dimensions (with respect to national average) to the poor: GDP per capita, life expectancy and literacy rate. The finding on population growth diminishing inequality which is not in line with AfDB (2012) confirms the expected relationship from the correlation matrix.
From Panel B of Table 3, the following could be established.
(1) Growth of formal finance at the expense of informal and semi-formal finance has an income-disequalizing effect. This is logical from common sense because, the increase in bank deposits (liquid liabilities) in the formal banking sector can only result from the fruits of the population faction in possession of bank accounts. In developing countries, this segment of the population with bank accounts constitute the upper-income and middle-income brackets. By implication, when growth in money supply (M2) or an extensive use of currency in an economy transits through the banking sector to the detriment of the informal and semi-formal financial sectors, the natural consequence is rising inequality. This conclusion could be substantiated with present-day statistics of most formal institutions concentrated in the urban areas of less developed countries. With a great proportion of the poor domiciled in rural areas without access to bank accounts, the competitive advantage of formal banking in shares of M2 is not good for the poor.
(2) When the share of the semi-formal financial sector in money supply improves to the detriment of the formal and informal sectors, the effect on the poor is positive.
(3) Growth of the informal financial sector to the detriment of the formal and semi-formal sectors is also good for the poor.
4. 3 Robustness checks
Findings of Table 3 have one particular short-coming. Discussions relevant to Propositions 3, 4 (Panel A), 5 and 7 (Panel B) are purely of informative character because they are based on
findings from the five-year NOI dataset. We earlier stated that, because the five specification was short of a second
the findings for the benefit of doubt and justice to the system GMM approach. Consequently, we use different control variables and replicate the regressions in Table 3. The findings in Table 4 show Propositions 3 and 4 of Panel A and, Propositions 5 and 7 of Panel B a significant outside the five
Propositions 5, 6 and 7 in the same equation because Propositions 5 and 7 have a correlation of -0.974 (see Appendix 2). Overwhelming failure to reject the null hypotheses
Sargan OIR tests points to the absence of autocorrelation and validity of the instruments respectively. Beside these positive specification points, overwhelming rejection of the null hypotheses of the Wald tests for joint significance of esti
quality of overall model specification and hence, the substance of inferences based on estimated propositions. The discussion of results in Table 3 is relevant for Table 4. However, one additional point is worth mentioning f
semi-formal financial sector is higher in comparison to the informal sector. The explanation to this is a simple one: the semi-formal sector engages in more poverty reduction initiatives than the informal sector (see Table 1).
4.4 Policy recommendations
The following policy recommendations derived from the findings are relevant to governments of sampled countries in particular and developing countries in general. (1) Encourage the establishment of formal institutions in rural communities. Why? We have found that formal banking development mitigates inequality (Proposition 1). However, formal banking development at the expense of other financial sectors increases inequality (Proposition 5). It follows that the establishment of formal institutions in rural areas dominated by the ‘low income brackets’ population could have an equalizing income redistributive effect. (2) Favor the establishment of (specialized) non
especially in rural and
poor-Proposition 3, 4, 6 and 7 have income equalizing effects. (3) Semi
poor friendly than informal finance, implying specialized bank and non institutions are more pro-poor than informal banks (made
and credit associations and, money lenders).
As an overall policy recommendation, the poor should be encouraged to open up bank accounts. The significance of the results demonstrates that financial development is essential in reducing income inequality in African countries. Widening access to non
intermediary markets, especially by targeting those at the lower income strata and the rural population would help reduce the persistent income gap between the rural and urban population. One possible way of improving financial access to the poor is to oriented policy towards the reduction of information asymmetries that increase the operating cost
institutions. Access to finance by the poor will enable productive investments (e.g in education and small manufacturing) which in time could improve equality. Particularly micro finance (part of the semi-formal sector) should be encouraged b
stage, can thrive without relying heavily on government regulation or strong legal institutions that require the poor to borrow contingent on their assets.
15
Specialized non-bank financial institutions include: Rural banks, Post banks, Saving and Loan Companies and, Deposit-taking Micro Finance banks. Non
NGOs. Informal banks (Savings collectors, Savings and credit associations, Money lenders). year NOI dataset. We earlier stated that, because the five
specification was short of a second-order autocorrelation test, inference could not be based on for the benefit of doubt and justice to the system GMM approach. Consequently, we use different control variables and replicate the regressions in Table 3. The findings in Table 4 show Propositions 3 and 4 of Panel A and, Propositions 5 and 7 of Panel B a significant outside the five-year NOI specification columns. We are unable to use Propositions 5, 6 and 7 in the same equation because Propositions 5 and 7 have a correlation
0.974 (see Appendix 2). Overwhelming failure to reject the null hypotheses
Sargan OIR tests points to the absence of autocorrelation and validity of the instruments respectively. Beside these positive specification points, overwhelming rejection of the null hypotheses of the Wald tests for joint significance of estimated coefficients confirms the quality of overall model specification and hence, the substance of inferences based on estimated propositions. The discussion of results in Table 3 is relevant for Table 4. However, one additional point is worth mentioning from Panel B: the inequality mitigation effect of the formal financial sector is higher in comparison to the informal sector. The explanation to formal sector engages in more poverty reduction initiatives than l sector (see Table 1).
The following policy recommendations derived from the findings are relevant to governments of sampled countries in particular and developing countries in general. (1) Encourage the l institutions in rural communities. Why? We have found that formal banking development mitigates inequality (Proposition 1). However, formal banking development at the expense of other financial sectors increases inequality (Proposition 5). It t the establishment of formal institutions in rural areas dominated by the ‘low income brackets’ population could have an equalizing income redistributive effect. (2) Favor the establishment of (specialized) non-bank financial institutions and informal ban
-dominated urban areas15. Why? Our results have shown that Proposition 3, 4, 6 and 7 have income equalizing effects. (3) Semi-formal finance is more poor friendly than informal finance, implying specialized bank and non
poor than informal banks (made-up of: savings collectors, savings and credit associations and, money lenders).
As an overall policy recommendation, the poor should be encouraged to open up bank e of the results demonstrates that financial development is essential in reducing income inequality in African countries. Widening access to non
intermediary markets, especially by targeting those at the lower income strata and the rural opulation would help reduce the persistent income gap between the rural and urban population. One possible way of improving financial access to the poor is to oriented policy towards the reduction of information asymmetries that increase the operating cost
institutions. Access to finance by the poor will enable productive investments (e.g in education and small manufacturing) which in time could improve equality. Particularly micro
formal sector) should be encouraged because, at least in its initial stage, can thrive without relying heavily on government regulation or strong legal institutions that require the poor to borrow contingent on their assets.
bank financial institutions include: Rural banks, Post banks, Saving and Loan Companies and, taking Micro Finance banks. Non-bank financial institutions are: Credit Unions and Micro Finance NGOs. Informal banks (Savings collectors, Savings and credit associations, Money lenders).
year NOI dataset. We earlier stated that, because the five-year NOI order autocorrelation test, inference could not be based on for the benefit of doubt and justice to the system GMM approach. Consequently, we use different control variables and replicate the regressions in Table 3. The findings in Table 4 show Propositions 3 and 4 of Panel A and, Propositions 5 and 7 of Panel B are year NOI specification columns. We are unable to use Propositions 5, 6 and 7 in the same equation because Propositions 5 and 7 have a correlation 0.974 (see Appendix 2). Overwhelming failure to reject the null hypotheses of AR(2) and Sargan OIR tests points to the absence of autocorrelation and validity of the instruments respectively. Beside these positive specification points, overwhelming rejection of the null mated coefficients confirms the quality of overall model specification and hence, the substance of inferences based on estimated propositions. The discussion of results in Table 3 is relevant for Table 4. However, rom Panel B: the inequality mitigation effect of the formal financial sector is higher in comparison to the informal sector. The explanation to formal sector engages in more poverty reduction initiatives than
The following policy recommendations derived from the findings are relevant to governments of sampled countries in particular and developing countries in general. (1) Encourage the l institutions in rural communities. Why? We have found that formal banking development mitigates inequality (Proposition 1). However, formal banking development at the expense of other financial sectors increases inequality (Proposition 5). It t the establishment of formal institutions in rural areas dominated by the ‘low-income brackets’ population could have an equalizing ‘low-income redistributive effect. (2) Favor
bank financial institutions and informal banks, . Why? Our results have shown that formal finance is more poor friendly than informal finance, implying specialized bank and non-bank financial up of: savings collectors, savings As an overall policy recommendation, the poor should be encouraged to open up bank e of the results demonstrates that financial development is essential in reducing income inequality in African countries. Widening access to non-formal financial intermediary markets, especially by targeting those at the lower income strata and the rural opulation would help reduce the persistent income gap between the rural and urban population. One possible way of improving financial access to the poor is to oriented policy towards the reduction of information asymmetries that increase the operating cost of financial institutions. Access to finance by the poor will enable productive investments (e.g in education and small manufacturing) which in time could improve equality. Particularly
micro-ecause, at least in its initial stage, can thrive without relying heavily on government regulation or strong legal institutions
bank financial institutions include: Rural banks, Post banks, Saving and Loan Companies and, nstitutions are: Credit Unions and Micro Finance NGOs. Informal banks (Savings collectors, Savings and credit associations, Money lenders).