Stakeholder Engagement: Some Empirical Evidence
from a Sample of European Banks
Giuliana Birindelli
Full Professor in Financial Markets and Institutions Dept. of Management and Business Administration
University “G. d’Annunzio” of Chieti-Pescara Viale Pindaro 42, Pescara 65127, Italy
E-mail: [email protected] Mariantonietta Intonti (Corresponding author) Associate Professor in Financial Markets and Institutions Dept. of Business and Private Law, University “Aldo Moro” of Bari
Piazza Umberto I, 70121 Bari, Italy E-mail: [email protected]
Massimo Bilancia Associate Professor in Statistics
Dept. of Informatics, University “Aldo Moro” of Bari Piazza Umberto I, 70121 Bari, Italy
E-mail: [email protected] Maura La Torre
Phd, University Lum Jean Monnet
S.S. 100 Km 18, 70010 Casamassima, Bari, Italy E-mail: [email protected]
Martina Malorni
Phd in Management and Business Administration Dept. of Management and Business Administration
University “G. d’Annunzio” of Chieti-Pescara Viale Pindaro 42, Pescara 65127, Italy
E-mail: [email protected]
Received: May 14, 2015 Accepted: June 21, 2015 Published: July 23, 2015 doi:10.5296/rbm.v2i2.8047 URL: http://dx.doi.org/10.5296/rbm.v2i2.8047 Contribution of the Authors
Even if the paper reflects a common view, Giuliana Birindelli mainly contributed to Sections 1, 4 and 6.2, Mariantonietta Intonti to Sections 2.1, 5, 6.3 and 8, Massimo Bilancia to Sections 7.1, 7.2 and 7.3, Maura La Torre to Sections 3 and 6.4, Martina Malorni to Sections 2 and 6.1.
Abstract
Our paper aims to analyse the practice of Stakeholder Engagement (SE) in the banking sector and to investigate if SE affects European bank profitability. To identify how banks engage stakeholders we developed a model for calculating an original "SE rating", that comes from four research areas: "Disclosure", "Stakeholders engaged", "Instruments of engagement", and "Management of the SE process". We then provided empirical evidence about the relationship between bank performance and SE rating through a panel analysis. Our evidence shows that commitment to SE should be increased significantly by focusing on organisation and management issues, and - to a lesser extent - on disclosure towards the market. Finally, our econometric study shows that relationship between SE rating and bank performance is not statistically significant, most likely due to the recent approach of banks to SE practice.
Keywords: Corporate Social Responsibility, Ethical rating, European banks, Stakeholder Engagement, Stakeholders.
1. Introduction
The activity of systematic involvement by a company of its stakeholders on issues that have the requirement of materiality or relevance is known as Stakeholder Engagement (henceforth SE) (Greenwood, 2007; Thomsen, 2013). It is a strategic element in business management as it aims to improve the quality of relationships with stakeholders and to achieve the greatest alignment of the products/services offered with the real needs of customers (Ingley et al., 2011). Listening to stakeholders, speaking with them, and paying attention to their perceptions and expectations in the management of enterprises are, in fact, essential tools to better define the operations of the business, to align them with the demands of stakeholders, to improve the quality of the products and services provided also for internal stakeholders (direct effect), and to build and maintain a solid reputation in the market (indirect effect). SE is also a strategic element for the management of banks. Firstly, it allows the creation of value for customers thanks to the attention paid to the quality of customer relationships, to the knowledge of different customers’ needs, and to the supply of products and patterns of relationships appropriate to each customer segment and each market served. Secondly, SE is useful to achieve employee satisfaction, which may have a positive impact on productivity and thus on the economic performance of banks. However, the SE process should not be limited to a few categories of stakeholders: it is based on the concept of “inclusiveness”, therefore the company must allow all stakeholders to voice their views, perceptions and expectations, as well as consider all instances in the process of improving governance.
SE is a part of the instruments of Corporate Social Responsibility (henceforth CSR) and, in this context, is an instrument of good governance (Devinney et al., 2013; Fassin, & Van Rossem, 2009). While studies on CSR in banks are numerous, albeit with different purposes and methods of analysis, SE – to the best of our knowledge – is a rather unexplored field of research when applied to banks (see Section 2.1). Our research, therefore, lies within the wide sphere of literature on CSR, analysing the orientation of banks to SE by an original valuation model that takes into account the most important areas of examination of this activity. The application of the model to the banks of our sample (see Section 5) allows us to assign a SE rating that sums up the intensity of the SE approach. In this context, our research questions are the following:
1) What is the degree of dissemination of the SE process in a sample of European banks and what are its characteristics?
of SE activity?
3) Does the SE approach have an impact on the profitability of the banks? In this respect, we want to study, using an econometric model, whether banks that are more active in terms of SE show better economic performance, in order to verify if SE is also an important element for their growth and stability.
The practical meanings and the importance of our study are substantially the following: (1) we build a SE rating model that banks can use to test the strength and breadth of their
SE approach and as benchmark for the development and improvement of this activity; (2) in addition, banks can apply the model to calculate their own SE rating and check the
link with the economic performance. If there is a direct relationship, the increase of SE activity automatically leads to an increase of the performance.
The remainder of this paper is organised as follows. Section 2 goes into the literature on SE, also with reference to the banking industry, Section 3 illustrates guidelines and standards on SE, Section 4 explains the methodology used to assign the SE rating, Section 5 explains the sample used in our research and the main results on the SE rating, Section 6 shows the best practices of the banks on SE in terms of disclosure, stakeholders engaged, instruments of engagement, and the SE process, Section 7 studies the relationship between SE activity and bank performance, and Section 8 concludes and provides suggestions for further research. 2. Literature Review
The theoretical framework of the phenomenon of SE can be found in the literature on CSR and corporate governance, in particular in those studies concerning the form of dialogue and discussion among the main players in corporate life, the control bodies or other internal and external parties of the company (Ayuso et al., 2012; Greenwood, 2007; Phillips, 1997; Hu & Scholtens, 2012; Scholtens, 2009).
The stakeholders, being among the main protagonists of corporate life, feel the need to be integrated and contribute to improving the company in which they are involved (Bartolomeo & Pacchi, 2009). Therefore, SE becomes a composite process that includes more methods of interaction (consultation, communication, exchange and dialogue) between the company and its stakeholders. Greenwood (2007) identifies SE as the set of procedures that an organisation develops to involve stakeholders in organisational activity, in order to create a system of cooperation (Phillips, 1997).
Andriof and Waddock (2002) state that the activity of SE is based on three theoretical areas: the theory of “business in society”, the “stakeholder theory”, and that of “strategic relationship”. The first area refers to the field that describes, analyses and evaluates the complex societal and ecological links of firms. In this field, recent corporate governance codes emphasise stakeholder governance practices, often in connection with social and environmental responsibility (Wieland, 2005). Greenwood (2007) states that SE is not the exclusive domain of socially responsible firms, but it should be the prerogative of a growing number of companies with different typologies and goals.
In the second theoretical area (stakeholder theory), which has roots that date back to the pioneering work of Freeman (1984) and that is usually juxtaposed with the shareholders theory, it is argued that managers of firms have obligations to a broader group of stakeholders compared to holders of risk capital only (Harrison & Wicks, 2013; Reed, 1999; Smit, 2005). Noland and Phillips (2010) state that organisational managers should think of themselves as “Ethical Strategists” who must think of SE as integral to organisational strategy rather than as
an accessory activity.
The last area, the “strategic relationship”, highlights the importance of relations with stakeholders and their sound management for most business activities. Clarkson (1995), Donaldson and Preston (1995), and Jones (1995) argue that the satisfaction of stakeholders needs contributes to the creation of value for the enterprise. To this end, Andriof and Waddock (2002) state that the continuous emerging of new SE strategies constitute an important basis for the SE activities.
The problem of identifying relevant stakeholders is very important. For this reason, Mitchell et al. (1997) propose that classes of stakeholders can be identified by some attributes: the stakeholder's power, the legitimacy of the stakeholder’s relationship with the firm, and the urgency of the stakeholder's claim on the firm. They also develop the theory of stakeholder salience that identifies the degree to which managers give priority to competing stakeholders (Mitchell et al., 2011; Tashman & Raelin, 2013; Weber & Marley, 2010).
Ayuso et al. (2012) state that SE processes range from identification of key stakeholders to long-term project teams and partnerships. Since the goals, priorities and demands of various stakeholder groups are different and often contradictory, scholars usually classify stakeholders into primary and secondary types (Clarkson, 1995; Waddock et al., 2002). The primary, or core stakeholder group, refers to stakeholders that are essential for the business itself to exist and/or have some kind of formal contract with the business (owners/shareholders, employees, customers and suppliers). The secondary stakeholder group includes social and political stakeholders that play a fundamental role in obtaining business credibility and acceptance of its activities (NGOs/activists, communities, governments and competitors). Several studies investigated the positive effects of engaging accountants in CSR, particularly in terms of the environmental dimension (Albelda, 2011; Yang-Spencer et al., 2013). Finally, Hart and Sharma (2004) add the existence of peripheral stakeholders or “fringe” stakeholders as those parties not visible or readily identifiable with the firm.
2.1 Literature on SE in Banks
About the literature on SE activity in the banking sector, the work of Santorsola and Marinangeli (2010), through a multiple linear regression conducted on 361 Italian cooperative banks, shows that ethical values, such as transparency and participation, facilitate the SE in the banking system. Di Antonio (2012) states that the relationships between a financial enterprise and its stakeholders can create value for the company. The author emphasises the multiple roles played by primary and secondary stakeholders within a bank: the phenomenon is most obvious in the case of depositors who are both bank customers and creditors. This demonstrates the complexity of the needs that banking stakeholders may disclose and prompts a reflection in order to improve and increase SE practices in the financial sector. Moreover, Marinangeli (2012) analyses a sample of Italian banks and focuses on the impact of SE approach on bank performance, achieving evidence similar to ours (see Section 7.3). If the relationship between SE and performance in the bank is a relatively unexplored topic, a greater number of papers explore the links between CSR and performance (Varenova et al., 2013). CSR approach in banks can improve relations with stakeholders, with a positive impact in terms of consensus and therefore in terms of both performance and reputation (Birindelli et al., 2015). On this topic, Simpson and Kohers (2002) focus on a sample of U.S. banks using the “Community Reinvestment Act rating” as a measure of social performance of lender and ROA (Return on Assets) and the ratio “Losses on loans on total loans” as measures of financial performance. The results of their study show a positive relationship between social and financial performance. The study of
Callado-Muñoz and Utrero-Gonzales (2011) shows that the positive connection between CSR and financial performance is able to improve the competitiveness of the whole financial sector. The economic benefits arising from socially responsible behaviours tend to go beyond “tangible boundaries” to the promotion of important “intangible assets” such as image (Ogrizek 2002), the bank’s market reputation (Scholtens & Dam, 2007) and loyalty and customer satisfaction (Matute-Vallejo et al., 2011).
3. Standards, Principles, and Guide Lines on SE
The Institute of Social and Ethical AccountAbility supports organisations aspiring to the conscious involvement of stakeholders through a high-level performance in social accounting, auditing, and reporting, providing a framework – the AccountAbility 1000 (AA1000) Framework – which consists of a set of standards known as the AA1000 Series of Standards containing useful guidelines and operational indications to achieve sustainability and SE goals (Institute of Social and Ethical AccountAbility, 1999).
Three principles (Inclusivity, Materiality, and Responsiveness) are the basis of the AA1000 Series of Standards. The first relates to a process of active and bilateral participation between organisations and stakeholders with the aim to promote a multi-level collaboration. Principle of Materiality refers to relevance and significance that a topic has for the organisation and its stakeholders: materiality confers the power to influence decisions, actions and the resulting performance on a topic. Principle of Responsiveness concerns the way in which an organisation demonstrates a response to its stakeholders, involving them in a proactive relationship (Institute of Social and Ethical AccountAbility, 2006; Institute of Social and Ethical AccountAbility, 2008a; Institute of Social and Ethical AccountAbility, 2008b, Ch. 2). In the last edition of Stakeholder Engagement Standard (AA1000SES), published in 2011, provides a detailed explanation of the SE Process. This Final Draft has been revised in 2014/2015 and, in this last period, the Final Revision Working Group of the AA1000SES is engaged in examination of feedback coming from stakeholders in June 2015 (AA1000 Stakeholder Engagement Standard Revision for Public Comment - June 2015). SE Process is divided into four main phases: 1) planning and preparation, 2) implementation of the engagement plan, 3) activation of the engagement process with its achievement and 4) revision. The planning phase starts with the profiling and mapping of stakeholders and continues with the determination of the involvement level and related methods, the identification and subsequent communication to stakeholders about the level of engagement disclosure chosen, and the design of a plan for stakeholder involvement and identification of significant engagement indicators. The preparation of the SE process implies: mobilisation of financial, human and technological resources required by the Engagement Process; building capacity of involvement, based on the possibility to overcome the physiological differences between the various groups of stakeholders, which are often a cause of disengaging and engagement risks; identifying risks of engagement (conflicts between stakeholder groups, non-balance between strong and weak stakeholders, presence of destructive stakeholders, etc.), and corrective actions. The implementation phase of the engagement plan consists of: invitation of stakeholders to involvement through appropriate and timely communication; preparation and distribution of information materials useful for the success of the engagement; execution of SE action; documentation of the engagement activities and the related results; development of an action plan describing how the organisation intends to respond to the results of the engagement process; and appropriate communication of results to stakeholders involved through a written report or, possibly, by alternative methods (meetings, phone-briefings, etc.). The fourth and final phase of the engagement process relates to the evaluation and monitoring of the overall quality of SE; the lifelong learning and
implementation of the engagement; the verification and monitoring of the results associated to the engagement action plan, with related communication to stakeholders about the feedback of any eventual progress and the publication of engagement report (Institute of Social and Ethical AccountAbility, 2011, Ch. 4, Sections 4.1- 4.4).
For a further guide to SE activities and to support the related reporting quality, organisations can also refer to the Sustainability Reporting Framework, developed by the Global Reporting Initiative (GRI), inside which the current, fourth generation of Sustainability Reporting Guidelines (G4) are included. G4 Guidelines are presented in two different documents, the
Reporting Principles and Standard Disclosures and the Implementation Manual: the former
includes criteria that organisations should follow to produce effective reporting according to the GRI standards, whereas the latter supplies details and practical recommendations for structuring reports according to G4 Guidelines (Global Reporting Initiative, 2013a). Furthermore, Standards on Disclosures contained in G4 Guidelines are divided in General
Standard Disclosures and Specific Standard Disclosures. While General Disclosures qualify
organisation and its reporting process, Specific Disclosures comprise, on the one hand, The
Disclosures on Management Approach (DMA) – that allow us to understand how the
organisation addresses and manages various sustainability issues – and, on the other hand,
The Indicators, through which organisations can provide synthetic and comparable
information related to their performance and impacts in an economic, environmental and social perspective (Global Reporting Initiative, 2013a). Stakeholder Engagement is a part of General Standard Disclosures. G4 provides guidance on the composition of stakeholder groups, such as customers, employees, and local communities; about the process of selecting stakeholders; on SE approach used by organisations, considering factors such as frequency and type of activities for this purpose carried out; and also about the main SE topics and issues, specifying which types of stakeholders have raised these concerns and how organisations have responded (Global Reporting Initiative, 2013b; Global Reporting Initiative, 2013c).
Lastly, a particular set of ISO Standards, ISO 26000:2010 Social Responsibility, completes the outline of the main references about the reports on the SE activity. Standard ISO 26000:2010, complementary (and not exclusive) to the other instruments and initiatives, provides further guidance to achieve appreciable performance in the communication of the results arising from the correct relationship with different categories of stakeholders.
4. Methodology for the SE Rating
The SE process is complex and multidimensional. It can be analysed in different ways and evaluated at various stages. In our analysis we focused on the following stages of the SE process in banks: planning/preparation, methods of implementation, and their qualitative assessment. We added “disclosure” as a research area since providing information on SE activities to the public is an important opportunity, not only for firms to revise and improve the SE practices, but also for stakeholders to evaluate activities that are fundamental for the market reputation of firms and for the activation of virtuous mechanisms of market discipline (Rinaldi, 2013).
The behaviours that are feasible at the above-mentioned stages were divided into four research areas of our analysis model: “Disclosure”, “Stakeholders engaged”, “Instruments of engagement”, and “Management of the SE process”. “Disclosure” deals with the communication of SE activities to the public by the banks (see Table 2). “Stakeholders engaged” considers stakeholder mapping by the banks and then identifies different classes of internal and external stakeholders (Table 3). “Instruments of engagement” provides a wide
range of instruments with different levels of stakeholder involvement (Table 4). Finally, “Management of the SE process” focuses on basic organisation and management aspects relevant to all stages of the process (planning and preparation, implementation and action, review and improvement; see Table 5). Section 6 describes the behaviour of the banks in each of these areas.
Our model takes into account fifty items, related to all four areas, to assess the SE process. The items were mainly drawn from the previously mentioned AA1000SES standard, which is the most important standard for the implementation and reporting of SE activities. The model looks like a questionnaire (see the items of the model in Tables 2, 3, 4, 5) and the information related to the questions was obtained by analysing many documents of the banks for the year 2010: firstly, the SE report, if available, and the sustainability (or similar denomination) report were consulted. Documentary evidence was supplemented with information from web sites in order to carry out a more complete and accurate analysis.
We referred to Scholtens (2009, 2011) for our methodology. So we used a framework that focuses on the key elements of SE policies and detects the presence, graded by the level of completeness/detail/immediacy of the information sought, or the absence of each item in the evaluation model. Our framework is based on scores measured on a scale 1-3: the score (2 or 3) awarded for the presence increases if the item is complete and easily accessible, while the score is 1 in the case of absence. By using this process of analysis it is, therefore, possible to calculate a SE rating for each bank in the sample and to judge whether and how the banks carry out the SE process in all four observation profiles. Our SE rating is established by using the above-mentioned methodology (content analysis) and by applying a specific normalisation of the scores in order to consider the different number of items in each area. Besides the total SE rating, we calculated a partial rating for each area of the model to check where the banks in the sample are more active and performing. The descriptive statistics of the total and partial ratings are in Table 1.
Based on the scores, the internal consistency reliability of the items in each area was evaluated (Cronbach’s alpha). Cronbach’s alpha for “Stakeholders Engaged” Area is 0.83, well above the conventional level of 0.7 (Nunnally, 1978). While the scale reliability for “Instruments of engagement” Area and “Management of the SE process” Area is acceptable (0.71 and 0.72 respectively), the “Disclosure” Area scale achieves only marginal reliability (alpha = 0.64).
5. The Study Sample and the Main Results on SE Rating
The study sample consists of the first 30 European banks quoted on the stock market according to the classification of the European Banking Report (Association of Italian Banks, 2010), based on market capitalisation. The banks analysed are mainly British, Swedish and French.
The choice of this sample was based on the aim to verify whether banks that are highly subjected to evaluation by investors are also sensitive to stakeholder involvement and attempt to create and maintain their reputation by way of social responsibility. Moreover, we believe that most capitalised banks could provide useful information on best practices in SE.
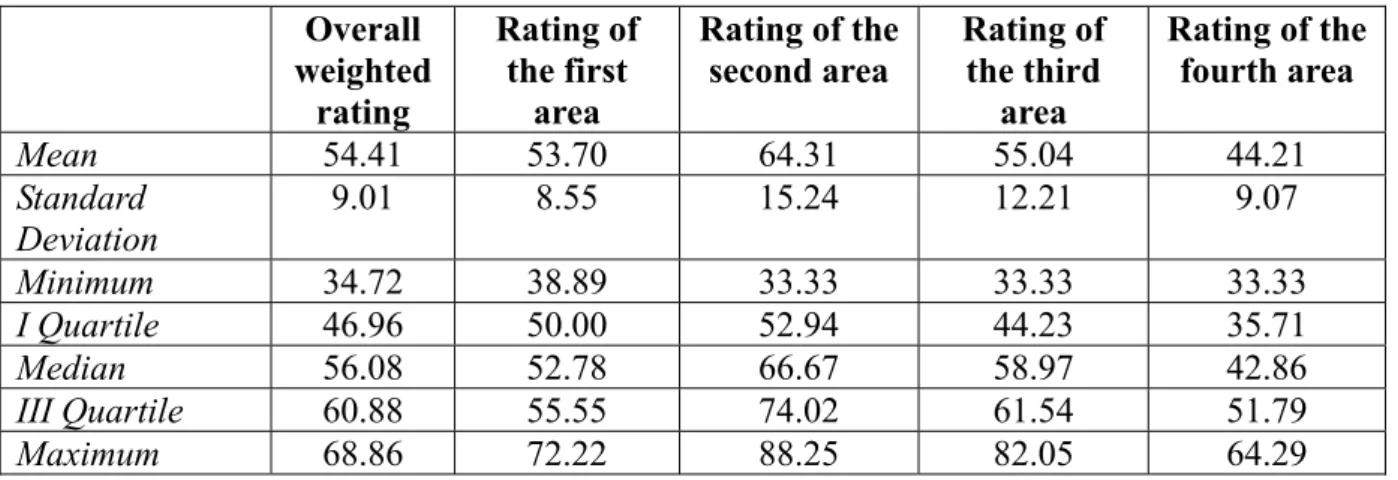
In reference to our analysis, Table 1 shows the total weighted SE rating for the year 2010. There is a high dispersion around the mean value (54.41%): the minimum is 34.72%, maximum 68.86%, standard deviation 9.01%. These values demonstrate considerable heterogeneity in the behaviour of the banks. The ratings for each area of the analysis model (partial ratings) are in the same table. These ratings also highlight very different behaviours
regarding SE: the widest minimum-maximum range is in the second area (54.92%, Stakeholders engaged), followed by the third area (Instruments of engagement) with a range of 48.72%, the first (Disclosure) with a range of 33.33%, and finally the lowest range in the fourth area (30.96%, Management of the SE process).
Table 1. SE rating: descriptive statistics Overall weighted rating Rating of the first area Rating of the second area Rating of the third area Rating of the fourth area Mean 54.41 53.70 64.31 55.04 44.21 Standard Deviation 9.01 8.55 15.24 12.21 9.07 Minimum 34.72 38.89 33.33 33.33 33.33 I Quartile 46.96 50.00 52.94 44.23 35.71 Median 56.08 52.78 66.67 58.97 42.86 III Quartile 60.88 55.55 74.02 61.54 51.79 Maximum 68.86 72.22 88.25 82.05 64.29
Source: our computation (Percentage values, year 2010).
The total mean value (54.41%) shows a poorly consolidated tendency of the banks to SE, which, it is hoped, will be strengthened and improved. Moreover, the mean for the four areas shows greater virtuosity in the Stakeholder engaged Area (second area), with the highest recorded mean of 64.31%. This is followed by the Instruments of engagement Area (third area), the Disclosure Area (first area), and the Management of SE process Area (fourth area), with a mean of 55.04%, 53.70%, and 44.21%, respectively.
6. The Empirical Qualitative Analysis
6.1 Evidence from “Disclosure” Area
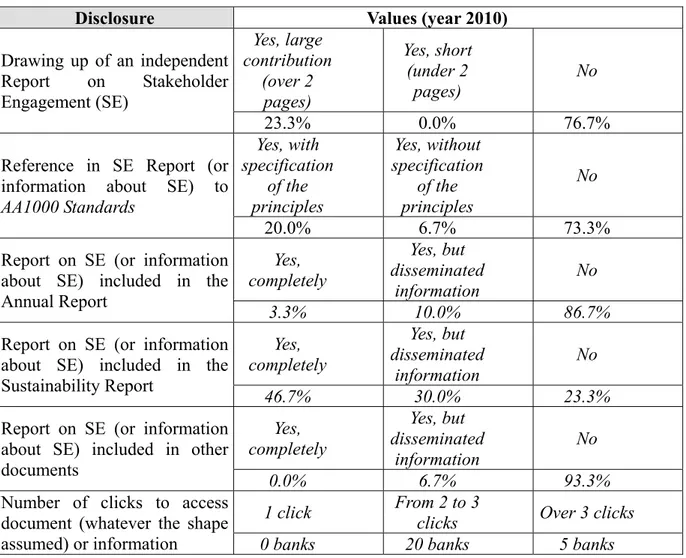
The first area of the model aims at measuring the level of disclosure about SE activity in order to verify whether banks are willing to adopt a policy of transparency towards the market and, therefore, to the stakeholders involved. Indeed, communicating such information is an important first step in the process of SE (International Finance Corporation, 2007). The first consideration emerging from Table 2 is the lack of interest of the sample in drawing up a stand alone report on SE: this practice is only adopted by 23.3% of the banks analysed, but the reports that we found are always wide and sufficiently rich in information. In addition to the drafting of a stand alone report, banks often choose other forms to disclose their activities relating to SE. Indeed, the most obvious element is that 76.7% of the banks choose to communicate their SE activities in the Sustainability Report and, in particular, 46.7% of the sample includes detailed information in this document. In particular, many of the banks following the GRI Guidelines show a level of inclusivity of stakeholders in line with the standards issued by this organisation. Further evidence emerging from the analysis is that 13.3% of the banks include information about the SE practices in the Annual Report, although the practices are clearly defined in only 3.3% of cases. Finally, 6.7% of the banks disclose summary information in other documents, which are available on the websites of the sample analysed. An important observation concerning the analysis of the area is that, in the organisations that publish information about the process, only 26.7% follow or quote the
AA1000 Series Standards, and, of these, 20% detail the principles. The last item included in “Disclosure Area” refers to the number of clicks required to access the report or information concerning the SE practices on a bank’s website. The length of the access path is indicative of the importance that the banks reserve to the dissemination of the SE: the lower the number of clicks to access the document, the greater the attention of the organisation in communicating its SE activities. The analysis shows that in the majority of cases 2 or 3 clicks are needed to reach the information on SE activities and the average number of clicks is 3.04.
Table 2. The behaviour of banks towards disclosure
Disclosure Values (year 2010)
Drawing up of an independent Report on Stakeholder Engagement (SE) Yes, large contribution (over 2 pages) Yes, short (under 2 pages) No 23.3% 0.0% 76.7% Reference in SE Report (or
information about SE) to
AA1000 Standards Yes, with specification of the principles Yes, without specification of the principles No 20.0% 6.7% 73.3% Report on SE (or information
about SE) included in the Annual Report Yes, completely Yes, but disseminated information No 3.3% 10.0% 86.7%
Report on SE (or information about SE) included in the Sustainability Report Yes, completely Yes, but disseminated information No 46.7% 30.0% 23.3%
Report on SE (or information about SE) included in other documents Yes, completely Yes, but disseminated information No 0.0% 6.7% 93.3%
Number of clicks to access document (whatever the shape assumed) or information
1 click From 2 to 3 clicks Over 3 clicks
0 banks 20 banks 5 banks
Source: our computation.
6.2 Evidence from “Stakeholders engaged” Area
This area takes into account the highest number of potential stakeholders of banks, according to the main models of multi-stakeholder voluntary reporting (GRI and social reporting guidelines).
This choice depends on the awareness that not all stakeholders are considered by managers as subjects to be involved and as recipients of voluntary forms of communication: in fact, they are beneficiaries of different levels of priority and importance, according to their associated power, urgency and legitimacy of their expectations (Agle et al., 1999; Boesso, 2011; Mitchel et al., 1997). This approach, as noted in Section 2, is consistent with the division between
primary and secondary stakeholders and the identification of so-called peripheral or marginal stakeholders (Clarkson, 1995; Hart & Sharma, 2004).
Table 3. The behaviour of banks towards stakeholders engaged
Stakeholders engaged Values (year 2010)
Stakeholder mapping Yes, information is clear Yes, but information is not clear Absence
70.0% 10.0% 20.0%
Customers
(families and enterprises)
Yes, information is clear Yes, but information is not clear Absence
73.3% 6.7% 20.0%
Suppliers Yes, information is clear Yes, but information is not clear Absence
40.0% 10.0% 50.0%
Employees Yes, information is clear Yes, but information is not clear Absence
76.7% 10.0% 13.3%
Of which: Female Employees Yes, information is clear Yes, but information is not clear Absence
23.3% 6.7% 70.0%
Other banks Yes, information is clear Yes, but information is not clear Absence
13.3% 20.0% 66.7%
Shareholders Yes, information is clear Yes, but information is not clear Absence
50.0% 23.3% 26.7%
Active Shareholders Yes, information is clear Yes, but information is not clear Absence
3.3% 16.7% 80.0%
Other investors Yes, information is clear Yes, but information is not clear Absence
30.0% 26.7% 43.3%
Trade Unions Yes, information is clear Yes, but information is not clear Absence
16.7% 6.7% 76.7%
Tertiary industry Yes, information is clear Yes, but information is not clear Absence10.0% 23.3% 66.7% Government and local authorities Yes, information is clear Yes, but information is not clear Absence
50.0% 20.0% 30.0%
Non-Governmental Organisations Yes, information is clear Yes, but information is not clear Absence
50.0% 13.3% 36.7%
Research institutes Yes, information is clear Yes, but information is not clear Absence
20.0% 6.7% 73.3%
Environment Yes, information is clear Yes, but information is not clear Absence
46.7% 3.3% 50.0%
Community Yes, information is clear Yes, but information is not clear Absence
43.3% 20.0% 36.7%
Other stakeholders Yes, information is clear Yes, but information is not clear Absence
60.0% 3.3% 36.7%
Source: our computation.
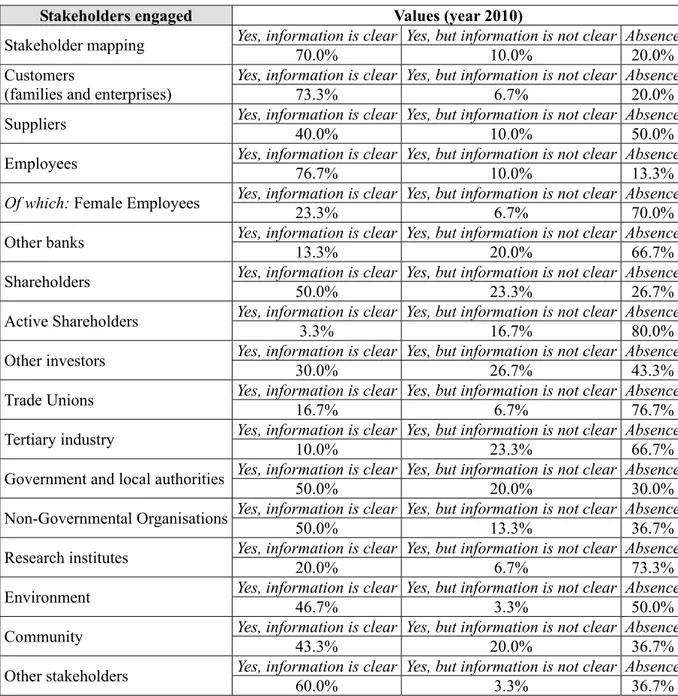
The first consideration that emerges from Table 3 regards the good spread of stakeholder mapping, which consists in the identification of key stakeholders and their clear highlighting in documents dedicated to CSR or on websites. The analysis shows that stakeholder mapping produces two types of outcome: 1) the publication of lists or tables related to stakeholders and, for each one, a description of the activities and objectives; 2) the implementation of relevant sections in the report or specific areas on the websites dedicated to a particular group of stakeholders.
Table 3 shows also a prevailing orientation towards employees (Guedri & Hollandts, 2008), who are subject to different practices of engagement in more than 85% of cases. However, the engagement of female employees has yet to be developed, despite the increasing emphasis on gender diversity in the literature and by regulators.
Among the stakeholders engaged, customers (families and enterprises) are engaged in 80% of cases. Besides, stakeholders such as shareholders (73.3%), Government and local authorities (70%), Non-Governmental Organisations (63.3%), the community in general (63.3%), environment (50%), and suppliers (50%) are all properly named and represented, while the engagement of other banks (33.3%), research institutes (26.7%), and trade unions (23.4%) is lower.
Active shareholders are not very involved, despite their increasing presence in shareholder meetings, in the role of “market discipline”. This situation is to be stigmatised, as it deprives the company and the active shareholders of a profitable relationship of “mutual engagement”, which is certainly useful to improve the social performance of the bank and to give voice to minority shareholders.
Finally, the category “other stakeholders” refers to parties which seem to be gaining increasing importance, such as media, rating agencies (even for sustainability), auditors and regulatory bodies, industry organisations and consumer advocacy groups.
6.3 Evidence from “Instruments of engagement” Area
The research approach of this Area was as wide as possible in an attempt to cover the greatest number of tools of communication, listening, dialogue and relationship with stakeholders (see Table 4).
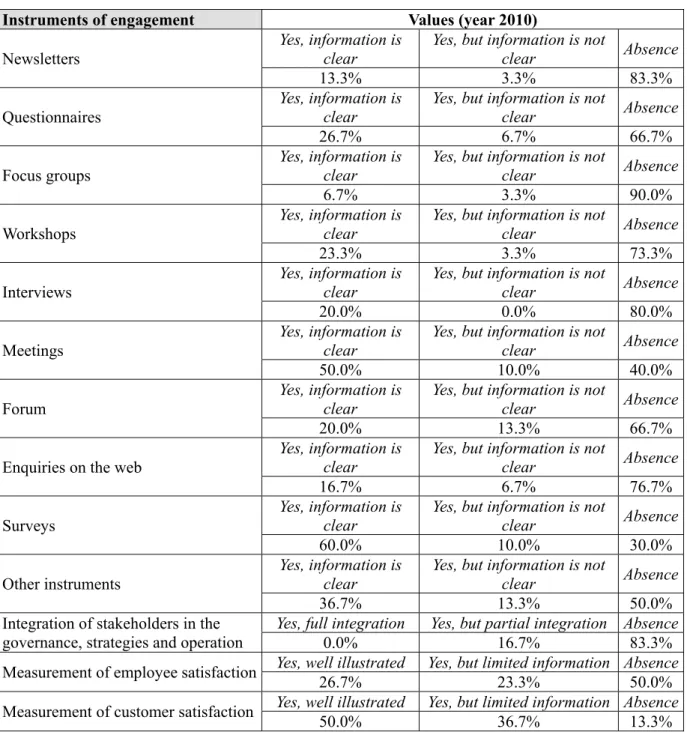
Among the analysed instruments, meetings and surveys appear to be more widespread than the other. The latter are often oriented towards employees in an attempt to analyse how employees view the bank’s business, its values, its environmental and social responsibility and its initiatives in various areas, such as the management of human resources, operational efficiency, customer focus and communication. Questionnaires are quite often used (33.4%) and stakeholders are often asked to indicate their perceived importance of the bank’s focus areas, identified in the materiality analysis, on a graded scale ranging, for example, from “Insignificant” to “Very important”. The identified focus areas can be: responsible lending, the social and environmental impact of significant projects in loan assessment, transparency and clear information on financial services and products offered to customers, offer of sustainable products (i.e. ethical funds), anti-money laundering practices, equal opportunities with regards to diversity (gender, ethnicities, disabilities, age, religion, sexuality), reduction of greenhouse gas emissions.
The most interesting information is deduced from the analysis of the instruments of measurement of customer and employee satisfaction. The measurement of customer satisfaction appears widespread: the level of detail is high enough in 50% of cases and there are frequent references to independent studies of customer satisfaction based on European or international standards (e.g. SKI-Swedish Quality Index or ACSI-American Customer Satisfaction Index). The use of customer satisfaction metric “based on usage” is interesting: a few months after a product is sold, a tool automatically checks whether the customer has used it, in order to provide the advisor with guidance on how to improve sales quality.
The activity of measuring employee satisfaction and a description of the ways in which it is implemented are less widespread than customer satisfaction. In some cases, this item refers to activities of Workplace assessment, that is a set of guidelines to measure employee
occupational health, based on the EU Directive on Safety and Health, and covers mental health, harassment, social tone and working environment issues such as noise and ergonomics.
Finally, particularly relevant, but in a negative way, is the level of stakeholder integration in the governance, strategies and operation, which is absent in 83.3% of cases, despite the principle of inclusiveness that should characterise the CSR-oriented banks.
Table 4. The behaviour of banks towards instruments of engagement
Instruments of engagement Values (year 2010)
Newsletters
Yes, information is clear
Yes, but information is not
clear Absence
13.3% 3.3% 83.3% Questionnaires
Yes, information is clear
Yes, but information is not
clear Absence
26.7% 6.7% 66.7% Focus groups
Yes, information is clear
Yes, but information is not
clear Absence
6.7% 3.3% 90.0%
Workshops
Yes, information is clear
Yes, but information is not
clear Absence
23.3% 3.3% 73.3% Interviews
Yes, information is clear
Yes, but information is not
clear Absence
20.0% 0.0% 80.0% Meetings
Yes, information is clear
Yes, but information is not
clear Absence
50.0% 10.0% 40.0% Forum
Yes, information is clear
Yes, but information is not
clear Absence
20.0% 13.3% 66.7% Enquiries on the web
Yes, information is clear
Yes, but information is not
clear Absence
16.7% 6.7% 76.7% Surveys
Yes, information is
clear Yes, but information is not clear Absence
60.0% 10.0% 30.0% Other instruments
Yes, information is clear
Yes, but information is not
clear Absence
36.7% 13.3% 50.0% Integration of stakeholders in the
governance, strategies and operation
Yes, full integration Yes, but partial integration Absence
0.0% 16.7% 83.3% Measurement of employee satisfaction Yes, well illustrated 26.7% 23.3% Yes, but limited information Absence50.0% Measurement of customer satisfaction Yes, well illustrated Yes, but limited information Absence 50.0% 36.7% 13.3%
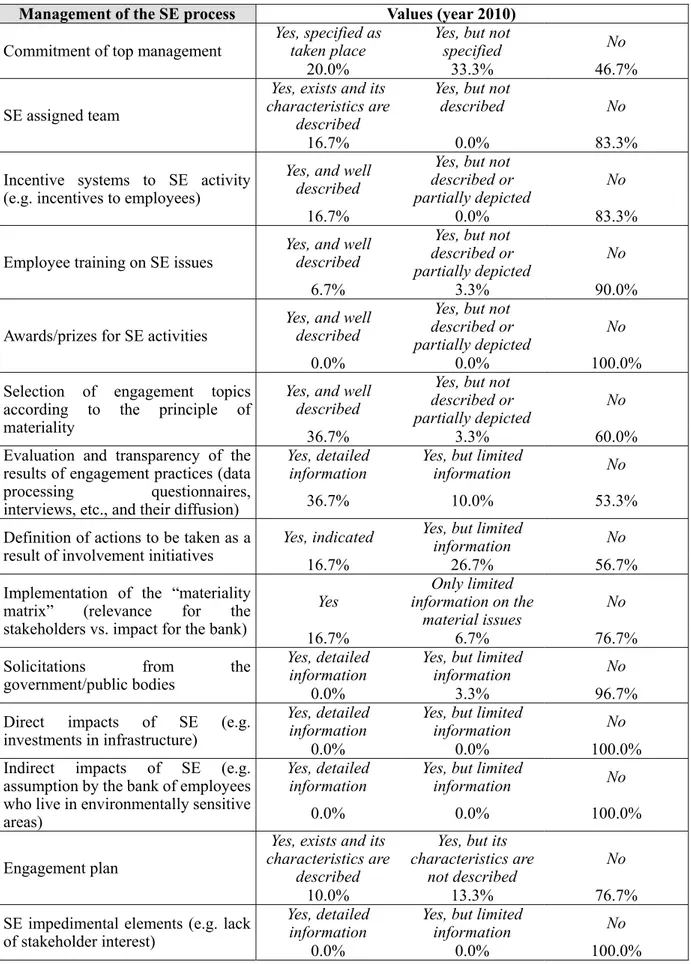
6.4 Evidence from “Management of the SE process” Area
The fourth and final area of the model concerns SE process management. Items considered, along with documental survey results, demonstrate the existence of multiple organisational and operational deficiencies at all stages of this process. Possible room for improvement regarding items collateral to bank’s activities – but affected by it – have also been detected (i.e. awards/prizes for SE, and existence of external pressure by governments and public authorities).
From data in Table 5, weakness of top management commitment is immediately obvious, absent in 46.7%, as well as the insignificant contribution of an employee team to the SE, absent in more than 80% of the sample. Application of materiality principle appears poor. Table 5 shows the proper application of this principle in only 40% of the sample analysed. At the same time, it must be recognized that 60% of the banks analysed do not select engagement topics according to materiality principle, and a large percentage (76.7%) of them do not implement the materiality matrix, a managerial tool helping organisations in choosing the process of engagement topics, an activity which plays a crucial role in the entire management of SE process.
Another important planning tool, i.e. engagement plan, is almost totally absent: it is described in its main characteristics in only 10% of cases and is completely absent in more than 70%, even though the latest version of the AA1000 Stakeholder Engagement Standard (AA1000SES) devotes ample space to the definition phase of the engagement process.
In management of SE process, the evaluation and transparency of engagement practices results also play an important role. However, items such as data processing of questionnaires, interviews, and similar are absent in more than 50% of the sample banks. Moreover, in relation to the phase of process improvement, we note the almost complete absence of incentive systems for SE activity (83.3%) and training activities on SE issues for employees (90.0%).
Moreover, analysis of items not directly related to bank’s activities shows a substantial absence (96.7%) of solicitation by governments and public bodies to activate processes of SE (although these categories of stakeholders are adequately mentioned and represented; see Stakeholders Area), as well as the total absence of recognition and/or awards to employees (100%).
The analysis also underlines the total absence (100%) of information relating to, on the one hand, the direct impact of SE, i.e. externalities of the process of SE able to change the related environment system (for example through investments by banks for the construction of dedicated infrastructure) and, on the other hand, the indirect impact of the same (e.g. through recruitment policies of human resources residing in environmentally sensitive areas).
Finally, the absence of impedimental elements to the SE activity for the totality of the sample analysed should be noted. This result is important because it highlights the substantial opening of banks and all stakeholders towards the realisation of the SE process and, despite the problems that the analysis showed, gives hope for a more complete and structured conduct in the SE field in the near future.
Table 5. The behaviour of banks in the management of the SE process
Management of the SE process Values (year 2010)
Commitment of top management
Yes, specified as
taken place Yes, but not specified No
20.0% 33.3% 46.7% SE assigned team
Yes, exists and its characteristics are
described
Yes, but not
described No
16.7% 0.0% 83.3%
Incentive systems to SE activity (e.g. incentives to employees)
Yes, and well described
Yes, but not described or
partially depicted No
16.7% 0.0% 83.3%
Employee training on SE issues Yes, and well described
Yes, but not described or
partially depicted No
6.7% 3.3% 90.0%
Awards/prizes for SE activities
Yes, and well described
Yes, but not described or
partially depicted No
0.0% 0.0% 100.0%
Selection of engagement topics according to the principle of materiality
Yes, and well described
Yes, but not described or
partially depicted No
36.7% 3.3% 60.0%
Evaluation and transparency of the results of engagement practices (data
processing questionnaires, interviews, etc., and their diffusion)
Yes, detailed
information Yes, but limited information No
36.7% 10.0% 53.3% Definition of actions to be taken as a
result of involvement initiatives
Yes, indicated Yes, but limited information No
16.7% 26.7% 56.7% Implementation of the “materiality
matrix” (relevance for the stakeholders vs. impact for the bank)
Yes information on the Only limited
material issues No
16.7% 6.7% 76.7%
Solicitations from the government/public bodies
Yes, detailed
information Yes, but limited information No
0.0% 3.3% 96.7%
Direct impacts of SE (e.g. investments in infrastructure)
Yes, detailed
information Yes, but limited information No
0.0% 0.0% 100.0%
Indirect impacts of SE (e.g. assumption by the bank of employees who live in environmentally sensitive areas)
Yes, detailed
information Yes, but limited information No
0.0% 0.0% 100.0% Engagement plan
Yes, exists and its characteristics are
described
Yes, but its characteristics are
not described No
10.0% 13.3% 76.7% SE impedimental elements (e.g. lack
of stakeholder interest)
Yes, detailed
information Yes, but limited information No
0.0% 0.0% 100.0%
7. SE and Bank Performance: Empirical Study
7.1 The Data and the General Specification
We provide further model-based empirical evidence about the relationship between bank performance and best practices in SE. For this purpose, we assembled a micro panel sample over the 2010-12 triennium, including the N =30 banks described in Section 5 followed over the mentioned time period. Rather than exploiting any conventional model-selection procedure (in order to avoid any bias deriving from statistical inference after model selection, resulting in invalid p-values and inconsistent standard estimators) we considered an a priori selection of regressors entering the model. The chosen independent variables are often reported in the existing literature as highly significant in explaining the trend of bank performance. Before listing them, we underline the dependent variable entering our analysis, that is:
• Net Income/Average Total Assets (known as ROAA): this ratio usually measures bank profitability (Dietrich & Wanzenried, 2011).
The vector of regressors comprises:
• Equity/Total Assets (in symbols ER, Equity Ratio): we expect a positive correlation between ROAA and this ratio which measures the amount of protection afforded to the bank by the equity (as demonstrated, among others, by Aburime, 2008);
• Total Assets (TA): in accordance with extensive literature (among others, Ben Naceur & Goaied, 2008), we expect a positive and significant relationship between the size, measured by total assets, and the profitability of a bank;
• Interest Expense on Customer Deposit/Average Customer Deposit (AIR, Average Interest Rate): we expect better profits from banks that are able to raise funds more cheaply because they maintain lower funding costs (Dietrich & Wanzenried, 2011); • Stakeholder Engagement (SE): this is the variable constructed according to the
methodology described in Section 4; we expect a positive correlation between ROAA and SE because greater dialogue and involvement of stakeholders should increase profit opportunities, in line with other practices of social responsibility and good governance;
• Non Interest Expense/Gross Revenues (known as Cost Income Ratio; in symbols CIR): we expect a negative correlation between ROAA and this measure of efficiency, in accordance with literature (Valverde & Fernandez, 2007);
• Reserves for Impaired Loans/Gross Loans (ILR, Impaired Loan Ratio): we expect a negative relationship between the level of risk, measured by reserves for impaired loans expressed as a percentage of total loans, and profitability (Albertazzi & Gambacorta, 2006).
We therefore concentrate our analysis on the following econometric equation: ROAA=α+β1∗ER +β2∗log(TA)+β3∗AIR +
+β4∗SE + β5∗CIR +β6∗ ILR + individual effects + disturbance
(1) Parameter estimates and significance testing were obtained by feasible econometric methods detailed in the next section.
7.2 Method
Formally, the general linear model we have used to analyze our data via specification (1) has the following form (Baltagi, 2005):
3 , 2 , 1 , , , 2 , 1 , = = + + = x i N t y T it it it it α β ε (2)
where i is the individual group denoting banks entering the sample (N =30), t denotes conventional time coordinates used for the T =3 years under consideration, xit is a p-dimensional vector of explanatory variables not including a constant and ε is an it
independent and identically distributed random disturbance. Under suitable restrictions we obtain three distinct specifications:
• the standard linear model pooling all the data across i and t , which imposes coefficient homogeneity expressed as βit =β and αit =α for all i and t ,
resulting in the following expression:
it it T
it x
y =α +β +ε (3)
which is estimated using Ordinary Least Squares (OLS);
• a “between” model which is computed on time averages discarding all the information due to intragroup variability, and estimated by the OLS estimator in a regression of individual time averages of response y and regressors x (plus the intercept);
• a random effect model in which the error term is decomposed into a disturbance term and an individual-specific component which does not change over time and models latent individual heterogeneity:
it it T i it x y =α +α +β +ε (4)
A detailed description of the computational framework needed for feasible and efficient Generalized Least Squares (GLS) estimation under the individual error structure arising from model (4) can be found in Croissant and Millo (2008).
In the quite general setting (4), the individual-specific effects α s are treated as independent i
and identically distributed random effects over the individuals (banks). These effects are also assumed to be independent of the disturbance term. In other words, we are focusing not only on banks entering our sample, but we are interested in the larger population of individuals which might have come under our observation under the same conditions. It is worth noting that, in order to consistently estimate parameters as the sample size N becomes large, it is imperative to assume for all the three above-mentioned models that the regressor terms are independent of disturbances. This “strict exogeneity” condition is commonly formulated as:
t s x
E( itεis)=0 for all , (5)
and it excludes the inclusion of lagged values of the dependent variable in the xit, as well as
any xitvariable which depends upon the history of y . The violation of condition (5) would
result in inconsistent parameter estimates, which in turn would exhibit erratic behaviour at any finite sample dimension. As this condition is very subtle and it may be very difficult to assess whether it holds or not, we have estimated three distinct models to compare the sign and the magnitude of estimates resulting from each one of them: any inconsistency would
clearly result in a set of erratic and irreconcilable results.
We dealt with the disturbance structure as well. Both fixed and random effects assume that the disturbance term is uncorrelated over time and among individuals, and that the disturbance structure does not allow for heteroskedasticity between and within individuals. Given that serial correlation is not an issue in micro panels with very few years, the presence of heteroskedasticity invalidates the standard errors and the resulting tests. For this reason, we repaired this issue by producing adjusted estimates and standard errors under a general heteroskedasticity-consistent estimation of the covariance matrix of the coefficient estimates, using the well-known “sandwich” estimator described in White (1980) (but see also Zeileis 2006). Other operating details, needed to make our analysis fully reproducible, are detailed in the next section.
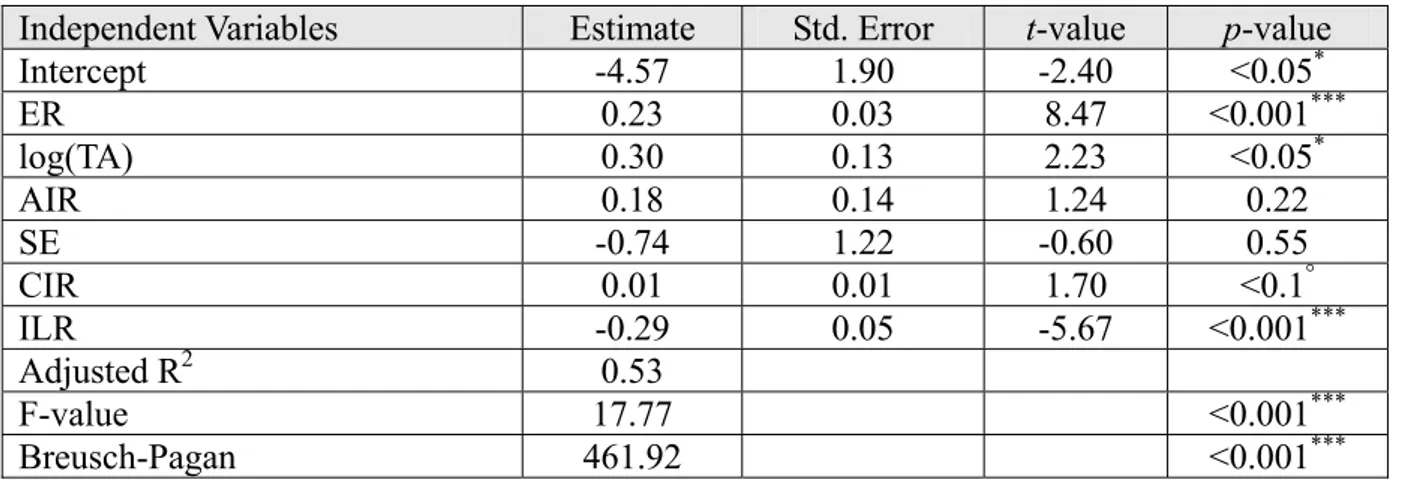
Table 6. Estimation results under the “pooling” model (3)
Independent Variables Estimate Std. Error t-value p-value
Intercept -4.57 1.90 -2.40 <0.05* ER 0.23 0.03 8.47 <0.001*** log(TA) 0.30 0.13 2.23 <0.05* AIR 0.18 0.14 1.24 0.22 SE -0.74 1.22 -0.60 0.55 CIR 0.01 0.01 1.70 <0.1° ILR -0.29 0.05 -5.67 <0.001*** Adjusted R2 0.53 F-value 17.77 <0.001*** Breusch-Pagan 461.92 <0.001***
Notes: estimates, standard errors, t-value statistics and the relative p-values for the “pooling” model (3), estimated by OLS. By convention ***, **, * and ° respectively denote significant coefficient estimates at 0.1%, 1%, 5% and 10% significance level. The Breusch-Pagan statistic tests against the null hypothesis of no heteroskedasticy.
Table 7. Estimation results under the “between” model
Independent Variables Estimate Std. Error t-value p-value
Intercept -4.11 2.14 -1.92 <0.01° ER 0.22 0.03 6.68 <0.001*** log(TA) 0.29 0.15 1.90 <0.01° AIR 0.14 0.17 0.83 0.41 SE -0.75 1.33 -0.57 0.58 CIR 0.01 0.01 0.80 0.43 ILR -0.27 0.06 -4.39 <0.001*** Adjusted R2 0.53 F-value 11.35 <0.001*** Breusch-Pagan 461.92 <0.001***
Notes: estimates, standard errors, t-value statistics and the relative p-values for the “between” model, obtained as the OLS estimator in a regression of individual time averages of response
y and regressors x . By convention ***, **, * and ° respectively denote significant
coefficient estimates at 0.1%, 1%, 5% and 10% significance level. The Breusch-Pagan statistic tests against the null hypothesis of no heteroskedasticy.
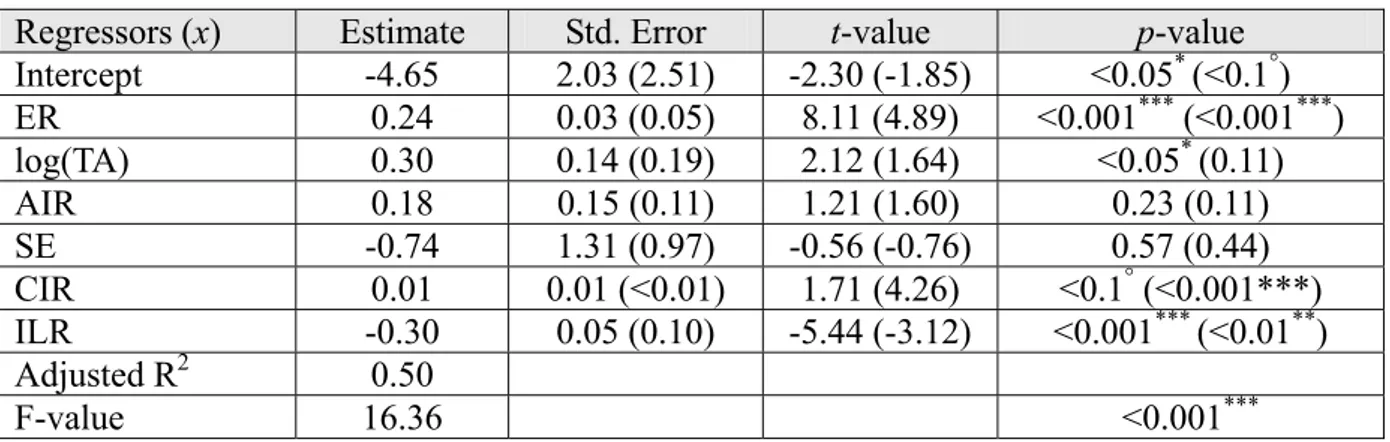
Table 8. Estimation results under the “random” panel data model (4)
Regressors (x) Estimate Std. Error t-value p-value
Intercept -4.65 2.03 (2.51) -2.30 (-1.85) <0.05* (<0.1°) ER 0.24 0.03 (0.05) 8.11 (4.89) <0.001*** (<0.001***) log(TA) 0.30 0.14 (0.19) 2.12 (1.64) <0.05* (0.11) AIR 0.18 0.15 (0.11) 1.21 (1.60) 0.23 (0.11) SE -0.74 1.31 (0.97) -0.56 (-0.76) 0.57 (0.44) CIR 0.01 0.01 (<0.01) 1.71 (4.26) <0.1° (<0.001***) ILR -0.30 0.05 (0.10) -5.44 (-3.12) <0.001*** (<0.01**) Adjusted R2 0.50 F-value 16.36 <0.001***
Notes: estimates, standard errors, t-value statistics and the relative p-values for the “random” model (4), including individual-specific (bank level) random effects. Values included in parenthesis, (standard errors, t-values and the corresponding p-values) have been obtained by means of heteroskedasticity-consistent estimation of the covariance matrix of the coefficient estimates. In both cases, by convention ***, **, * and ° respectively denote significant coefficient estimates at 0.1%, 1%, 5% and 10% significance level.
7.3 Results
In this section, the three above-mentioned models are respectively denoted as “pooling”, “between” and “random” (following a standard convention valid for panel data econometrics), and Tables 6, 7 and 8 display the corresponding parameter estimation results. It is evident that there is an excellent agreement among sign, magnitudes and statistical significances of the three sets of coefficient estimates. Therefore, parameter interpretation is largely independent of the model used to explain the data.
In accordance with our expectations, and hence the findings in the literature (described in Section 7.1), the evidence reached through the econometric analysis shows a positive and significant correlation between ROAA and ER and, with lower significance, between ROAA and the size of the bank. Tables 6 and 8 also show a positive correlation, albeit weak, between ROAA and CIR, in contrast with our expectations. However, the relationship between ROAA and ILR is in line with our expectations: the relationship is negative and statistically significant.
Finally, in reference to the analysis of the relationship between SE and bank performance, the regression analysis shows that the relationship between ROAA and SE ratings is negative, but not statistically significant. Such evidence, in accordance with Marinangeli (2012), is not in agreement with our expectations and it is most likely due to the recent approach of banks to SE issues, to the micro panel we examined and to the short observation period of our analysis. This result means that the study of the relationship between SE and bank profitability requires further investigation that can be implemented in future research, thus filling a gap in the literature.
8. Final Remarks
SE, the activity of systematic involvement by a company of its stakeholders on relevant and material issues, is a part of the instruments of Corporate Social Responsibility of firms and, in this context, is an instrument of good governance. Between corporate social responsibility and good corporate governance there is a relationship of mutual benefit (Jamali et al., 2008). On the one hand, the social responsibility approach leads firms to pay attention to the
interaction between the different actors inside the company. On the other hand, good governance is a tool that raises the profile of social responsibility and business ethics of the firm. This successful combination has been highlighted in the literature, by the transition from a shareholder view of neoclassical origin to the stakeholder view (Freeman, 1984), which recognised a more open and social concept of enterprise (Di Antonio, 2012), characterized by a governance extended to all stakeholders (Sacconi, 2000) and by a stakeholder engagement approach (Gnan et al., 2012).
Based on these considerations, the study aimed to propose an analysis of the SE phenomenon in the banking sector. To this end, after considering the literature and the main sources of self-regulation, an evaluation model of SE approach was developed, consisting of four areas of investigation (Disclosure, Stakeholders engaged, Instruments of engagement, Management of the SE process) and several items, which define the behaviour of the banks included in our sample. Then we used a metodology based on scores measured on a scale 1-3 to study the sensitivity of the banks to the SE issue, to attribute a SE rating and to express some evaluations on the SE activities carried out (research questions no. 1 and 2). The average Stakeholder Engagement Rating, proxy of the intensity of the SE approach, is 54.41% and is barely acceptable: this result shows how commitment to SE can be significantly increased, confirming the need to focus on management practices in particular, but also on Disclosure Area.
Finally, in reference to the analysis of the relationship between SE and bank performance (research question no. 3), the regression analysis shows that the relationship between SE ratings and ROAA is not statistically significant and is in contrast with our expectation. On this point, we believe that the development of SE practices among banks in the future may manifest new impacts on the profitability that currently do not emerge, likely due, on the one hand, to the recent adoption of SE practices, on the other, to the micro panel we examined and to the short observation period of our analysis.
Although this last result, our findings provide a contribute towards extending the existent knowledge of how SE approach can be used as a strategic element of bank management, as well as other CSR and corporate governance tools, and may affect bank profitability. In this regard, we have formulated a model that turns a qualitative concept, that is SE, into a quantitative variable used in regression estimates aimed to verify the determinants of bank profitability. However, our study may be subject to methodological improvements and further developments. In particular, in relation to both quantitative and qualitative analysis, by expanding the sample and the time period of observation it would be possible to assess whether the framework outlined for our sample confirms our findings or not. Insights in this direction are needed, since the awareness of the economic benefits arising from the process could gain more strength and incisiveness, inducing banks to extend and increase efforts to implement an efficient and effective SE system. We propose to address these issues in future research.
References
Abbott, W. F., & Monsen, R. J. (1979). On the measurement of corporate social responsibility: Self-reported disclosures as a method of measuring corporate social involvement. Academy of management journal, 22(3), 501-515.
Aburime, U. T. (2008). Determinants of bank profitability: Company-level evidence from Nigeria. [Online] Available: http://ssrn.com/abstract=1106825 (July 2014).
investigation of stakeholder attributes and salience, corporate performance and CEO values.
Academy of management Journal, 42(5), 507-525.
Albelda, E. (2011). The role of management accounting practices as facilitators of the environmental management: evidence from EMAS organisations. Sustainability Accounting,
Management and Policy Journal, 2(1), 76-100.
Albertazzi, U., & Gambacorta, L. (2006). Bank profitability and the business cycle. (Temi di discussion No. 601) Rome, Italy: Banca d’Italia.
Andriof, J., & Waddock, S. (2002). Unfolding stakeholder engagement. In J. Andriof, S. Waddock, B. Husted & S. Sutherland Rahman (Eds.), Unfolding stakeholder thinking:
Theory, responsibility and engagement (pp. 19-42). Sheffield, UK: Greenleag Publishing.
Association of Italian Banks (2010). ABI Monthly outlook. [Online] Available: http://www.abi.it/Pagine/Mercati/Analisi/Scenario-e-previsioni/ABI-Monthly-outlook.aspx. Ayuso, S., Rodríguez, M.A., Castro, R.G., Ariño, M.A. (2011). Does stakeholder engagement promote sustainable innovation orientation?. Industrial Management & Data System, 111(9), 1399–1417.
Ayuso, S., Rodríguez, M.A., García, R., & Ariño, M. A. (2014). Maximizing stakeholders’ interests: An empirical analysis of the stakeholder approach to corporate governance.
Business & Society, 53(3), 414-439.
Baltagi, B. D. (2005). Econometric Analysis of Panel Data. Chichester, UK: John Wiley & Sons.
Bartolomeo, M., & Pacchi, C. (2009). Comitati multi-stakeholder e responsabilità sociale d’impresa. In E. D’Orazio (ed.), Theory and Practice, Corporate and Stakeholder
Responsibility (pp.332-338). Milan, Italy: Politeia.
Beattie, V., & Thomson, S. J. (2007). Lifting the lid on the use of content analysis to investigate intellectual capital disclosures. Accounting forum, 31(2), 129-163.
Ben Naceur, S., & Goaied, M. (2008). The determinants of commercial bank interest margin and profitability: Evidence from Tunisia. Frontiers in Finance and Economics, 5(1), 106-130. Birindelli, G., Ferretti, P., Intonti, M., & Iannuzzi, A. P. (2015) On the drivers of corporate social responsibility in banks: Evidence from an ethical rating model. Journal of
Management & Governance. http://dx.doi.org/10.1007/s10997-013-9262-9.
Boesso, G. (2011). Lo stakeholder reporting nei bilanci delle società quotate. Percezioni dei
manager e comunicazione volontaria. Turin, Italy: G. Giappichelli Editore.
Callado-Munõz, F. J., & Utrero-Gonzalez, N. (2011). Does it pay to be socially responsible? Evidence from Spain’s retail banking sector. European Financial Management, 17(4), 755–78.
Clarkson, M. B. E. (1995). A stakeholder framework for analyzing and evaluating corporate social performance. Academy of Management Review, 20(1), 92-117.
Croissant, Y., & Millo, G. (2008). Panel data econometrics in R: The plm package. Journal of
Statistical Software, 27(1), 1-43.
Devinney, T. M., Schwalbach, J., & Williams, C.A. (2013). Corporate social responsibility and corporate governance: Comparative perspectives. Corporate Governance: An
Di Antonio, M. (2012). I sistemi di stakeholder management nelle banche italiane. Rome, Italy: Bancaria Editrice.
Dietrich, A., & Wanzenried, G. (2011). The determinants of commercial banking profitability before and during the crisis: Why does bank profitability vary across countries? [Online] Available: http://www.fma.org/Istanbul/Papers/DietrichnWanzenried_DeterminantsBanking Profitability.pdf. (June 2014).
Donaldson, T., & Preston, L. (1995). The stakeholder theory of the corporation: concepts, evidence and implications. Academy of Management Review, 20(1), 65-91.
Fassin, Y., & Van Rossem, A. (2009). Corporate governance in the debate on CSR and ethics: Sensemaking of social issues in management by authorities and CEOs. Corporate
Governance: An International Review, 17(5), 573–593.
Freeman, R. E. (1984). Strategic management: A stakeholder approach. Boston, U.S.: Pitman.
Global Reporting Initiative (2013a). An introduction to G4. The next generation of
sustainability reporting. Amsterdam, The Netherlands.
Global Reporting Initiative (2013b). G4 Sustainability Reporting Guidelines. Reporting
Principles and Standards Disclosures. Amsterdam, The Netherlands.
Global Reporting Initiative (2013c). G4 Sustainability Reporting Guidelines. Implementation
Manual. Amsterdam, The Netherlands.
Gnan, L., Hinna, A., Monteduro F., & Scarozza, D. (2012) Corporate governance and management practices: stakeholder involvement, quality and sustainability tools adoption. Evidences in local public utilities. Journal of Management and Governance. http://dx.doi.org/10.1007/s10997-011-9201-6.
Greenwood, M. (2007). Stakeholder engagement: Beyond the myth of corporate responsibility. Journal of Business Ethics, 74(4), 315–327.
Guedri, Z., & Hollandts, X. (2008). Beyond dichotomy: The curvilinear impact of employee ownership on firm performance. Corporate Governance: An International Review, 16(5), 460–474.
Harrison, J. S., & Wicks, A. C. (2013). Stakeholder theory, value and firm performance.
Business Ethics Quarterly, 23(1), 97-124.
Hart, S. L., & Sharma, S. (2004). Engaging fringe stakeholders for competitive imagination.
Academy of Management Executive, 18(1), 7-18.
Hu, V., & Scholtens, B., (2012). Corporate social responsibility policies of commercial banks in developing countries. Sustainable Development, 21(6), 1-13.
IFC-International Finance Corporation (2007). Stakeholder engagement: A good practice
handbook for companies doing business in emerging markets, Washington, DC.
Ingley, C., Mueller J., & Cocks G. (2011) The financial crisis, investor activists and corporate strategy: will this mean shareholders in the boardroom?. Journal of Management and
Governance. http://dx.doi.org/10.1007/s10997-010-9130-9.
Institute of Social and Ethical AccountAbility (1999). AccountAbility 1000 (AA1000)
framework. Standards, guidelines and professional qualification, Exposure Draft. London, United Kingdom.
Institute of Social and Ethical AccountAbility (2006). Guidance Note on the Principles of
Materiality, Completeness and Responsiveness as they Relate to the AA1000 Assurance Standard. London, United Kingdom.
Institute of Social and Ethical AccountAbility (2008a). AA1000 Assurance Standard. London, United Kingdom.
Institute of Social and Ethical AccountAbility (2008b). AA1000 Accountability Principles
Standard. London, United Kingdom.
Institute of Social and Ethical AccountAbility (2011). AA1000 Stakeholder Engagement
Standard, Final Exposure Draft. London, United Kingdom.
Institute of Social and Ethical AccountAbility (2015). AA1000 Stakeholder Engagement
Standard Revision for Public Comment - June 2015. London, United Kingdom.
Jamali D., Safieddine A.M., & Rabbath, M. (2008). Corporate Governance and Corporate Social Responsibility Synergies and Interrelationships. Corporate Governance: An
International Review, 16(5), 443–459.
Jones, T. M. (1995). Instrumental stakeholder theory: a synthesis of ethics and economics.
Academy of Management Review, 20(2), 404-437.
Marinangeli, B. (2012). Orientamento allo stakeholder engagement e performance economiche nelle aziende bancarie: un’analisi empirica. Economia e Diritto del Terziario, 3, 1-17.
Matute‐Vallejo, J., Bravo, R., & Pina, J. M. (2011). The influence of corporate social responsibility and price fairness on customer behaviour: Evidence from the financial sector. Corporate Social Responsibility and Environmental Management, 18(6), 317-331. Mitchell, R. K., Agle, B. R., & Wood, D. J. (1997). Toward a theory of stakeholder identification and salience: defining the principle of who and what really counts. Academy of
Management Review, 22(4), 853-86.
Mitchell, R. K., Agle, B. R., Chrisman, J. J., & Spence, L. J. (2011). Toward a theory of stakeholder salience in family firms. Business Ethics Quarterly, 21(2): 235-255.
Noland, J., & Phillips, R. (2010). Stakeholder engagement, discourse ethics and strategic management. International Journal of Management Reviews, 12(1), 39-49.
Nunnally, J. C. (1978). Psychometric Theory. New York: McGraw Hill.
Ogrizek, M. (2002). The effect of corporate social responsibility on the branding of financial services. Journal of Financial Services Marketing, 6(3), 215–228.
Phillips, R. (1997). Stakeholder Theory and a Principle of Fairness. Business Ethics
Quarterly, 7(1), 51-66.
Reed, D. (1999). Stakeholder management theory: A critical theory perspective. Business
Ethics Quarterly, 9(3), 453-483.
Rinaldi, L. (2013) Stakeholder Engagement. In C. Busco, M. Frigo, A. Riccaboni, & P. Quattrone (Eds.), Integrated Reporting: Concepts and Cases that Redefine Corporate
Accountability (pp. 95-109). New: York: Springer.
Sacconi, L. (2000). The social contract of the firm: economics, ethics, and organisation. Berlin, Germany: Springer.