Association between outer retinal alterations
and microvascular changes in intermediate stage
age-related macular degeneration: an optical
coherence tomography angiography study
Lisa Toto,
1Enrico Borrelli,
1Rodolfo Mastropasqua,
2Luca Di Antonio,
1Emanuele Doronzo,
1Paolo Carpineto,
1Leonardo Mastropasqua
11Department of Medicine and
Science of Ageing, Ophthalmology Clinic, University G. D’Annunzio Chieti-Pescara, Chieti, Italy
2
Ophthalmology Unit, Department of Neurological, Neuropsychological, Morphological and Movement Sciences, University of Verona, Verona, Italy
Correspondence to Dr Enrico Borrelli, Department of Ophthalmology, University G. D’Annunzio, Via dei Vestini, Chieti 66100, Italy;
[email protected] LT and EB equally contributed to the manuscript and should be considered as co-first authors.
Received 8 June 2016 Revised 18 July 2016 Accepted 28 August 2016
To cite: Toto L, Borrelli E, Mastropasqua R, et al. Br J Ophthalmol Published Online First: [ please include Day Month Year] doi:10.1136/bjophthalmol-2016-309160
ABSTRACT
Aims To investigate associations between changes in retinal vessels and alterations detected by spectral domain optical coherence tomography (SD-OCT) scans in intermediate stage age-related macular degeneration (AMD).
Methods Thirty eyes of 30 patients with intermediate dry AMD were enrolled in the study. Of the cohort study, 15 eyes (changes-AMD group) showed OCT changes preceding the development of drusen-associated atrophy. A control group of healthy subjects was selected for statistical comparisons. All patients underwent an ophthalmologic evaluation, including OCT angiography (OCTA) and SD-OCT scans. Main outcome measures were superficial vessel density, deep vessel density, macular thickness.
Results Foveal macular thickness was 215.2±32.9μm in changes-AMD patients and was significantly thinner than no changes-AMD patients (248.3±23.3μm, p=0.002) and healthy subjects (268.1±19.2μm, p<0.0001). Furthermore, in the parafoveal area, the thicknesses of both the inner retina and the outer retina were reduced in the changes-AMD group, after comparison with the two other groups. Parafoveal superficial vascular plexus flow density was 43.3±2.7% in changes-AMD patients and was decreased compared with the no changes-AMD group (48.7±3.3%, p=0.003) and healthy controls (50.4±6.1%, p=0.001). A direct correlation of the superficial plexus flow density with the inner retina parafoveal macular thickness (R2=0.761, p=0.028) was found.
Conclusions We demonstrated an association between SD-OCT signs and retinal blood supply in patients with intermediate AMD and we showed that patients with signs predicting development of geographic atrophy have a reducedflow in superficial vascular plexus and damage of the inner and the outer retina.
INTRODUCTION
Age-related macular degeneration (AMD) is the leading cause of irreversible central vision loss among older individuals in developed countries.1
Two subtypes of AMD exist: non-neovascular (dry) AMD and neovascular exudative (wet) AMD.2 The accumulation of lipo-glyco-proteinaceous deposits (drusen) and the degeneration of the retinal pigment epithelium (RPE) define dry AMD. Moreover, geographic atrophy (GA) is a devastating complication of the advanced form of dry AMD and is characterised by the confined almost
complete loss of the RPE layer under the retina, often with an abrupt border between the apparently healthy RPE area and the region without these cells (for that reason, the term ‘geographic’ is used).3 Furthermore, GA is accompanied by degeneration of the inner and outer retinal layers.2 4–6
Many factors have been implicated in AMD pathogenesis and progression, such as inflammation, oxidative damage, ageing, genetic predisposition and environmental elements.7 8 In recent years, several studies have reported vascular factors playing an important role in AMD pathogenesis.9–12 Indeed, there is a growing body of evidence that choroidal and retinal bloodflows are diminished in AMD,9–13 the latter aspect causing hypoxia asso-ciated with the progression of AMD.
Spectral domain optical coherence tomography (SD-OCT) scans show bands corresponding to the anatomic layers of the human retina. Recently, Wu et al14 identified the following distinctive features on SD-OCT scans in patients affected by intermedi-ate AMD that portend the development of drusen-associated GA: subsidence of the outer plexiform layer (OPL) and inner nuclear layer (INL); and development of a hyporeflective wedge-shaped band within the limits of the OPL. Indeed, all areas that developed drusen-associated atrophy showed these consistent characteristic features pre-ceding its development.14 These characteristics were termed ‘nascent geographic atrophy’ and patients with these signs are considered to have a high risk of drusen-associated atrophy occurrence.
Optical coherence tomography angiography (OCTA) has recently been developed to study retinal and choroidal microvasculature without needing dye injection and has allowed us to study the superficial and the deep retinal vascular plexuses.15
The main aim of this study was to investigate superficial and deep retinal vessels, by means of OCTA, in patients affected by intermediate AMD tofind an association between features on SD-OCT scans and retinal vessel density.
METHODS Study participants
A total of 30 eyes of 30 patients with dry AMD (12 men and 18 women; mean age 71.6±7.6 years) were enrolled in the study. Patients consecutively presented at the University Gabriele D’Annunzio Department of Ophthalmology, between June 2015
and March 2016. University Gabriele D’Annunzio Ethics Committee approved this study and all patients gave informed consent to the use of their data. The study adhered to the tenets of the Declaration of Helsinki.
All eyes included in our present study were affected by ‘inter-mediate AMD’. The staging was based on the clinical AMD clas-sification proposed by Ferris et al16in 2013 as follows: persons with medium drusen (63–125 μm), but without pigmentary abnormalities, should be considered to have ‘early AMD’; persons with large drusen (>125μm) or with pigmentary abnormalities associated with at least medium drusen should be considered to have‘intermediate AMD’; and patients with neo-vascular AMD or GA should be considered to have‘late AMD’. No patients affected by early and late AMD were enrolled. Of the cohort study, 15 eyes (changes-AMD group) showed both OPL and INL subsidence and presence of a hyporeflective wedge-shaped band within the limits of the OPL (changes pre-ceding the development of drusen-associated atrophy)14 (figure 1). The remaining 15 enrolled eyes did not show these changes (no changes-AMD group).
Staging and assignment to groups were determined on fundus colour images and on SD-OCT scans (to use the measuring tool
to evaluate drusen width) by two independent investigators in a blind manner and all the discrepancies were resolved by consen-sus between these two observers.
Criteria for inclusion were age ≥50 years old, best corrected visual acuity (BCVA) of at least 0.1 LogMAR, and diagnosis of intermediate AMD in at least one eye. Exclusion criteria were diag-nosis of early AMD, evidence or history of neovascularisation, presence of GA, previous ocular surgery (included anti-vascular endothelial growth factor therapy), any maculopathy secondary to causes other than AMD (including presence of an epiretinal mem-brane or vitreomacular traction syndrome), refractive error greater than 3 dioptres and significant media opacities.
All patients had undergone a complete ophthalmologic exam-ination, which included measurement of BCVA, intraocular pressure, fundus examination, colour fundus photography, fluor-escein angiography (FA) and OCTA. We only considered scans without significant motion artefacts and with a signal strength index >60.
A control group homogenous for age and sex was also included in the current analysis. All control subjects also under-went a complete ophthalmologic examination, including BCVA, intraocular pressure, fundus examination and OCTA.
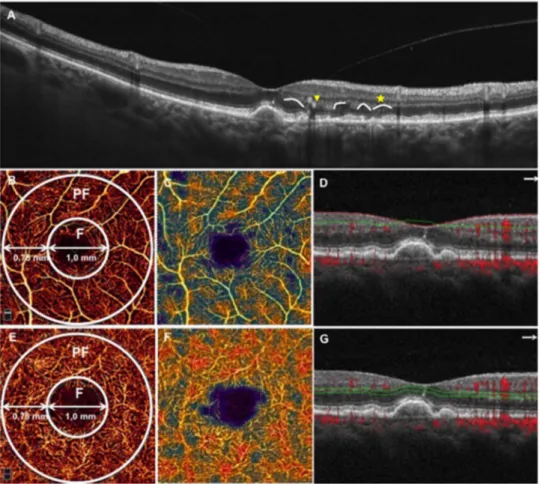
Figure 1 Spectral domain optical coherence tomography (SD-OCT) and optical coherence tomography angiography (OCTA) from an enrolled patient with intermediate age-related macular degeneration. (A) SD-OCT showing outer plexiform layer (OPL) and inner nuclear layer subsidence (yellow arrow) and a hyporeflective wedge-shaped band within the limits of the OPL (yellow star); (B) OCTA macula 3×3 scan showing the superficial vascular plexus. The superficial vascular plexus flow density was defined as the percentage area occupied by vessels in a circular region of interest (ROI) in the centre of the foveal avascular zone and with a diameter of 2.5 mm. The AngioVue software automatically splatted the ROI, as well as the superficial vascular plexus flow density evaluation, into two fields: the foveal area (F), a central circle with a diameter of 1 mm; and the parafoveal area (PF) that constitutes the remaining part inside the ROI. The PF superficial vascular plexus vessel density data were analysed; (C) corresponding colour-codedflow density map of the superficial vascular plexus flow density (the warmer the colour, the greater the flow); (D) OCT B-scan showing the slab set to evaluate the superficial retinal plexus; (E) OCTA macula 3×3 scan showing the deep vascular plexus; (F)
corresponding colour-codedflow density map of the deep vascular plexus flow density; (G) OCT B-scan showing the slab set to evaluate the deep retinal plexus.
Outcome measures included superficial vascular plexus (SVP) flow density (SVPFD); deep vascular plexus (DVP) flow density (DVPFD); and macular thickness (MT).
Procedures
SD-OCT angiography with XR Avanti
XR Avanti AngioVue OCTA (Optovue Inc., Fremont, California, USA) is a device using a system based on SSADA algorithm (Version: 2015.100.0.35). The latter algorithm allowed the device to detect theflow as a variation over time in the speckle pattern formed by interference of light scattered from red blood cells and adjacent tissue structure.17 In addition, the SD-OCT tool was skilled at acquiring the standard structural OCT scans typically used by commercially available devices.
The exam was performed as previously described.13In brief, each subject’s pupil was dilated with a combination of 0.5% tro-picamide and 10% phenylephrine, then study participants underwent SD-OCT imaging following a protocol that included AngioVue OCT 3D volume set of 3×3 mm, consisting of 304×304 pixels in the transverse dimension. Low-quality scans (ie, if the subject blinked or if there were many motion artefacts in the dataset) were excluded and repeated until a good quality was achieved. Three scans for each patient were captured, then the best quality scan (without significant motion artefacts and with a signal strength index >60) was considered for the analysis.
Vascular layer segmentation andflow density analysis
Vascular retinal layers were visualised and segmented as previ-ously described.13 18–20 To evaluate the superficial vascular retinal plexus we used a layer thickness of 60μm from the inner limiting membrane (ILM) to include all the vessels of this plexus. To visualise the deep retinal plexus, we used a 30μm thick layer from the inner plexiform layer (IPL) to visualise the plexus in its entirely (figure 1). Two investigators checked the segmentation quality before testingflow density.
Objective quantification of flow density was evaluated for each eye using the SSADA software. Quantitative analysis was performed on the OCTA en face image using the AngioVue soft-ware. Theflow density was defined as the percentage area occu-pied by vessels in a circular region of interest (ROI) in the centre of the foveal avascular zone and with a diameter of 2.5 mm. The AngioVue software automatically splatted the ROI into twofields: the foveal area, a central circle with a diameter of 1 mm; and the parafoveal area that constitutes the remaining part inside the ROI (figure 1).
The AngioVue software automatically outputs the flow density percentage inside the parafoveal area, as previously described.21 22
The software output the mean MT in the foveal (FMT) and the parafoveal (PFMT) areas. Furthermore, the software auto-matically segmented the innermost retinal layers, from the ILM to the outer portion of the IPL, and the outermost retinal layers, from the inner portion of the INL to the outer portion of the hyper-reflective line corresponding to the RPE. The latter segmentations allowed the software to separately test the parafo-veal thickness of the inner retina and the outer retina.
Statistical analysis
Statistical calculations were performed using Statistical Package for Social Sciences (V.20.0, SPSS Inc., Chicago, Illinois, USA). To detect departures from normality distribution, Shapiro– Wilk’s test was performed for all variables. All quantitative vari-ables were presented as media and SD in the results and in the
tables. The difference among the three groups was generated by conducting analysis of variance (ANOVA) analysis followed by Bonferroni’s post hoc test. Pearson’s correlation was performed to evaluate the linear correlation among variables in patients with AMD.
The chosen level of statistical significance was p<0.05. RESULTS
No difference in age (71.6±7.6, 72.8±6.5 and 69.7±8.2 years in changes-AMD, no changes-AMD and control groups, respect-ively) and BCVA (0.03±0.05 LogMAR in changes-AMD group, 0.03±0.04 LogMAR in no changes-AMD group and 0.01 ±0.04 LogMAR in healthy subjects) was found among the three groups. All the subjects enrolled were Caucasian and not affected by diabetes. Furthermore, there were no significant dif-ferences in systemic hypertension or the use of systemic antihy-pertensive medications among the groups.
Macular thickness analysis
Foveal MT was 215.2±32.9μm in changes-AMD patients and was significantly thinner than no changes-AMD patients (248.3 ±23.3μm, p=0.002) and healthy subjects (268.1±19.2 μm, p<0.0001).
Full parafoveal MT was 266.5±44.5μm in the changes-AMD group, 302.9±18.8μm in the no changes-AMD group and 316.1±13.8μm in healthy controls (p=0.002 and p<0.0001, respectively, after comparison with the changes-AMD group). Furthermore, in the parafoveal area, the thickness of the inner retina was significantly thinner in the changes-AMD group (98.7±18.2μm) compared with the no changes-AMD group (112.7±10.0μm, p=0.023) and the healthy group (117.3 ±12.1μm, p=0.007). Finally, considering the parafoveal area, the outer retina thickness was 167.7±27.6μm in changes-AMD patients and was significantly thinner than no changes-AMD patients (190.1±14.1μm, p=0.004) and healthy subjects (198.8 ±4.8μm, p<0.0001) (table 1).
Flow density analysis
Parafoveal SVPFD was 43.3±2.7% in changes-AMD patients and was decreased after comparison with the no changes-AMD group (48.7±3.3% and p=0.003). Moreover, parafoveal SVPFD was 50.4±6.1% in healthy controls ( p=0.001 in the comparison with the changes-AMD group). Furthermore, no difference was found in parafoveal SVPFD between the no changes-AMD group and healthy controls ( p=0.715).
Parafoveal DVPFD was 51.9±1.9% in changes-AMD patients, 53.6±4.9% in no changes-AMD patients and 51.6±6.0% in healthy controls ( p=1.0 in all the comparisons among the groups) (table 1).
Correlation analysis
The Pearson test showed a significant direct correlation among all the parafoveal thicknesses (full, inner and outer) in changes-AMD patients (table 2). Moreover, in the latter group, we found a direct correlation of the superficial plexus flow density with the full parafoveal MT (R2=0.734, p=0.038) and
with the innermost layers’ parafoveal MT (R2=0.761, p=0.028). Table 2 shows all the correlations among MTs and vascular plexus densities.
DISCUSSION
In this prospective study we investigated the association between retinal vessel changes and SD-OCT in patients affected by inter-mediate AMD. Overall we found patients showing signs
predicting GA development had a reduction in inner and outer retinal layers, as well as an alteration in superficial vascular retinal plexus.
Several studies reported that the presence of OPL and INL subsidence23 and the development of a hyporeflective wedge-shaped band in OPL24 were SD-OCT features of GA areas. Nevertheless, recently, Wu et al14 demonstrated that the latter
SD-OCT hallmarks were also found in patients with intermedi-ate AMD. The latter longitudinal study included 221 eyes affected by intermediate AMD and the enrolled patients were followed up every 3 months for up to 30 months. The authors demonstrated these two SD-OCT signs portend the develop-ment of drusen-associated atrophy and termed these character-istics as ‘nascent geographic atrophy’. In fact, the presence of Table 2 Correlation between macular thickness and flow density in patients with intermediate AMD
Full parafoveal macular thickness Innermost layers’ parafoveal macular thickness Outermost layers’ parafoveal macular thickness Superficial vascular plexus flow density
Deep vascular plexus flow density Changes-AMD group (n=15)
Full parafoveal macular thickness – 0.955 <0.0001 0.981 <0.0001 0.734 0.038 0.394 0.334 Innermost layers’ parafoveal macular thickness 0.955 <0.0001 – 0.879 0.004 0.761 0.028 0.352 0.392 Outermost layers’ parafoveal macular thickness 0.981 <0.0001 0.879 0.004 – 0.679 0.064 0.402 0.324 Superficial vascular
plexus flow density
0.734 0.038 0.761 0.028 0.679 0.064 – 0.284 0.495 Deep vascular plexus
flow density 0.394 0.334 0.352 0.392 0.402 0.324 0.284 0.495 – No changes-AMD group (n=15)
Full parafoveal macular thickness – 0.659 <0.0001 0.851 <0.0001 0.053 0.802 −0.086 0.683 Innermost layers’ parafoveal macular thickness 0.659 <0.0001 – 0.165 0.431 0.009 0.967 −0.030 0.887 Outermost layers’ parafoveal macular thickness 0.851 <0.0001 0.165 0.431 – −0.119 0.324 0.090 0.669 Superficial vascular
plexus flow density
0.053 0.802 0.009 0.967 −0.119 0.324 – 0.559 0.004 Deep vascular plexus
flow density −0.086 0.683 −0.030 0.887 0.090 0.669 0.559 0.004 – Bold text represents p<0.05.
Correlation analysis was obtained by Pearson correlation. AMD, age-related macular degeneration.
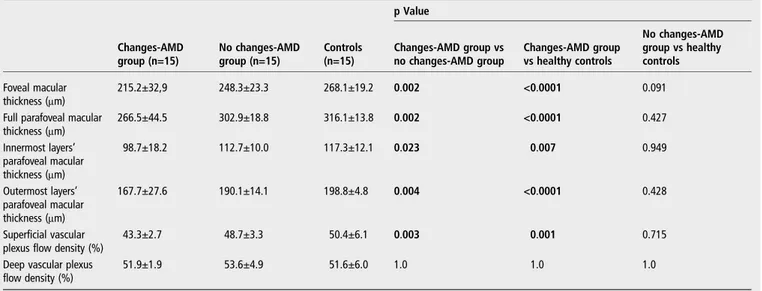
Table 1 Macular thickness and retinal vascular plexus flow density in intermediate AMD patients and controls
p Value Changes-AMD group (n=15) No changes-AMD group (n=15) Controls (n=15) Changes-AMD group vs no changes-AMD group Changes-AMD group vs healthy controls No changes-AMD group vs healthy controls Foveal macular thickness (μm) 215.2±32,9 248.3±23.3 268.1±19.2 0.002 <0.0001 0.091
Full parafoveal macular
thickness (μm) 266.5±44.5 302.9±18.8 316.1±13.8 0.002 <0.0001 0.427 Innermost layers’ parafoveal macular thickness (μm) 98.7±18.2 112.7±10.0 117.3±12.1 0.023 0.007 0.949 Outermost layers’ parafoveal macular thickness (μm) 167.7±27.6 190.1±14.1 198.8±4.8 0.004 <0.0001 0.428 Superficial vascular plexus flow density (%)
43.3±2.7 48.7±3.3 50.4±6.1 0.003 0.001 0.715
Deep vascular plexus flow density (%)
51.9±1.9 53.6±4.9 51.6±6.0 1.0 1.0 1.0
Bold text represents p<0.05.
Values were compared by one-way analysis of variance (ANOVA), followed by Bonferroni post hoc test. AMD, age-related macular degeneration.
OPL and INL subsidence and a hyporeflective wedge-shaped band in OPL were unique to areas that developed drusen-associated atrophy, unlike features such as hyperreflective foci and drusen characteristics,25parameters already reported as risk factors for the development of atrophy.
Several study showed that both the inner and the outer retina were thinner in patients with AMD, the latter aspect suggesting AMD is also featured by a neuroretinal layer damage.2 4–6 In the current study we showed that MT is reduced as soon as patients have the intermediate stage, but only considering patients with signs predicting the development of atrophy asso-ciated with drusen. Moreover, interestingly, our data demon-strated that the inner and the outer retina were significantly thinner in these patients. The latter aspect, added to the fact that the inner and outer retina thicknesses were significantly cor-related in these patients, suggested the damage started in all retinal layers and confirmed that AMD is not confined to the outer segments.
It is known that retinal vasculature and choroidal vasculature are damaged in AMD eyes and that this impairment might con-tribute to AMD progression.9 10 These features would not be surprising because of systemic hypertension,26 dietary fat intake27 28and a history of coronary, carotid and peripheral vas-cular disease29 are risk factors for AMD and for vascular disease. Indeed, our group recently showed that the superficial retinal plexus is damaged in patients not affected by late stage dry AMD.13 Moreover, it demonstrated retinal and choroidal vessel damage following the same trend in AMD, as the vascular injury starts as soon as the intermediate stage is reached.
In the current study, we showed that patients with signs pre-dicting GA on SD-OCT scans also showed a reduction in SVPFD. Moreover, we found a significant correlation between inner retina layer thickness and SVPFD. The authors think that the association between inner retina thinning and reduction of blood flow in the SVP is of interest and could be explained by several mechanisms: the reduction in thickness of the neuroretina might be followed by a reduction of metabolic demand and a resulting reduction in bloodflow; and the inner retina may perish from progressive hypoperfusion secondary to vascular damage. Indeed, several authors demonstrated reduced bloodflow in the choroid and retina causes chronic ischaemia in Bruch’s mem-brane, RPE and neuroretina.30–32 Vascular deficits due to reduced choroidal and retinal bloodflow have been identified in early and late AMD using FA and Doppler imaging.32–34Further studies should evaluate the relationship between the reduction in SVPFD and in neuroretinal thickness to clarify the causal relationship.
Moreover, we did not find differences in the deep retinal capillary plexus. This difference could be explained by the dis-similarity between the two plexuses. Indeed, the two vascular plexuses have different patterns: the SVP is composed of capil-laries developing an interconnected vascular network between arterioles and venules; the DVP is compounded by polygonal units, in which the capillaries converge radially towards an epi-centre called a capillary vortex.15 18 The different structure might elucidate the preservation of the deep capillary plexus in intermediate AMD.
Our study has several limitations. The series presented here is relatively small. However, one should consider the strict inclu-sion criteria for patients and the control group, as well as the similarity of groups with respect to meaningful characteristics such as age. Another limitation is that the OPL and INL subsid-ence could in theory influence the deep capillary plexus segmen-tation. Finally, a further major limitation is that we did not
evaluate choroidal vessels. However, the OCTA choriocapillaris evaluation should be interpreted with caution because drusen could lead to an attenuation artefact confusing the evaluation.
In conclusion, we provide thefirst study evaluating the associ-ation between SD-OCT signs and retinal blood supply in patients with intermediate AMD and we show that patients with signs predicting the development of GA had a reduced flow in SVP and damage of the inner and the outer retina. This study raises many questions and prompts further investigation, includ-ing evaluation of new therapeutic approaches targetinclud-ing reduc-tion of retinal vessel damage progression and the possible slowdown toward GA.
Contributors LT, EB, PC and LM conceived the study. LT and EB conducted the study. EB collected the data. EB performed the statistical analysis. LT, EB, LDA, RM wrote the article.
Competing interests None declared. Patient consent Obtained.
Ethics approval University Gabriele D’Annunzio Ethics Committee. Provenance and peer review Not commissioned; externally peer reviewed.
REFERENCES
1 Friedman DS, O’Colmain BJ, Muñoz B, et al. Prevalence of age-related macular degeneration in the United States.Arch Ophthalmol2004;122:564–72. 2 Coleman HR, Chan CC, Ferris FL, et al. Age-related macular degeneration.Lancet
2008;372:1835–45.
3 Gass JD. Drusen and disciform macular detachment and degeneration.Arch Ophthalmol1973;90:206–17.
4 Zucchiatti I, Parodi MB, Pierro L, et al. Macular ganglion cell complex and retinal nervefiber layer comparison in different stages of age-related macular degeneration.
Am J Ophthalmol2015;160:602–7.e1.
5 Lee EK, Yu HG. Ganglion cell-inner plexiform layer and peripapillary retinal nerve fiber layer thicknesses in age-related macular degeneration.Invest Ophthalmol Vis Sci2015;56:3976–83.
6 Sadigh S, Cideciyan AV, Sumaroka A, et al. Abnormal thickening as well as thinning of the photoreceptor layer in intermediate age-related macular degeneration.Invest Ophthalmol Vis Sci2013;54:1603–12.
7 Zarbin MA, Rosenfeld PJ. Pathway-based therapies for age-related macular degeneration: an integrated survey of emerging treatment alternatives.Retina
2010;30:1350–67.
8 Leveziel N, Tilleul J, Puche N, et al. Genetic factors associated with age-related macular degeneration.Ophthalmologica2011;226:87–102.
9 Wang JJ, Mitchell P, Rochtchina E, et al. Retinal vessel wall signs and the 5 year incidence of age related maculopathy: the Blue Mountains Eye Study.Br J Ophthalmol2004;88:104–9.
10 Remsch H, Spraul CW, Lang GK, et al. Changes of retinal capillary bloodflow in age-related maculopathy.Graefes Arch Clin Exp Ophthalmol2000;238:960–4.
11 Boltz A, Luksch A, Wimpissinger B, et al. Choroidal bloodflow and progression of age-related macular degeneration in the fellow eye in patients with unilateral choroidal neovascularization.Invest Ophthalmol Vis Sci2010;51:4220–5. 12 Feigl B. Age-related maculopathy—linking aetiology and pathophysiological
changes to the ischaemia hypothesis.Prog Retin Eye Res2009;28:63–86. 13 Toto L, Borrelli E, Di Antonio L, et al. Retinal vascular plexuses’ changes in dry
age-related macular degeneration, evaluated by means of optical coherence tomography angiography.Retina2016;36:1566–72.
14 Wu Z, Luu CD, Ayton LN, et al. Optical coherence tomography-defined changes preceding the development of drusen-associated atrophy in age-related macular degeneration.Ophthalmology2014;121:2415–22.
15 Spaide RF, Klancnik JM, Cooney MJ. Retinal vascular layers imaged byfluorescein angiography and optical coherence tomography angiography.JAMA Ophthalmol
2015;133:45–50.
16 Ferris FL, Wilkinson CP, Bird A, et al. Clinical classification of age-related macular degeneration.Ophthalmology2013;120:844–51.
17 Lumbroso B, Huang D, Jia Y, et al. Clinical guide to Angio-OCT non invasive, Dyeless OCT angiography. 1st edn. New Delhi, India: Jaypee Brothers Medical Publisher (P) Ltd, 2015.
18 Savastano MC, Lumbroso B, Rispoli M. In vivo characterization of retinal vascularization morphology using optical coherence tomography angiography.
Retina2015;35:2196–203.
19 Huang Y, Zhang Q, Thorell MR, et al. Swept-source OCT angiography of the retinal vasculature using intensity differentiation-based optical microangiography algorithms.Ophthalmic Surg Lasers Imaging Retina2014;45:382–9.
20 Moult E, Choi W, Waheed NK, et al. Ultrahigh-speed swept-source OCT angiography in exudative AMD.Ophthalmic Surg Lasers Imaging Retina2014;45:496–505.
21 Jia Y, Morrison JC, Tokayer J, et al. Quantitative OCT angiography of optic nerve head bloodflow.Biomed Opt Express2012;3:3127.
22 Jia Y, Tan O, Tokayer J, et al. Split-spectrum amplitude-decorrelation angiography with optical coherence tomography.Opt Express2012;20:4710–25.
23 Sayegh RG, Simader C, Scheschy U, et al. A systematic comparison of spectral-domain optical coherence tomography and fundus autofluorescence in patients with geographic atrophy.Ophthalmology2011;118:1844–51. 24 Monés J, Biarnés M, Trindade F. Hyporeflective wedge-shaped band in geographic
atrophy secondary to age-related macular degeneration: an underreportedfinding.
Ophthalmology2012;119:1412–19.
25 Ouyang Y, Heussen FM, Hariri A, et al. Optical coherence tomography-based observation of the natural history of drusenoid lesion in eyes with dry age-related macular degeneration.Ophthalmology2013;120:2656–65.
26 Hyman L, Schachat AP, He Q, et al. Hypertension, cardiovascular disease, and age-related macular degeneration. Age-Related Macular Degeneration Risk Factors Study Group.Arch Ophthalmol2000;118:351–8.
27 Mares-Perlman JA, Brady WE, Klein R, et al. Dietary fat and age-related maculopathy.Arch Ophthalmol1995;113:743–8.
28 Zerbib J, Delcourt C, Puche N, et al. Risk factors for exudative age-related macular degeneration in a large French case-control study. Graefes Arch Clin Exp Ophthalmol 2014;252:899–907.
29 Vingerling JR, Dielemans I, Bots ML, et al. Age-related macular degeneration is associated with atherosclerosis. The Rotterdam Study. Am J Epidemiol 1995;142:404–9.
30 Feigl B, Brown B, Lovie-Kitchin J, et al. Functional loss in early
age-related maculopathy: the ischaemia postreceptoral hypothesis.Eye (Lond)
2007;21:689–96.
31 Schlingemann RO. Role of growth factors and the wound healing response in age-related macular degeneration.Graefes Arch Clin Exp Ophthalmol
2004;242:91–101.
32 Grunwald JE, Metelitsina TI, Dupont JC, et al. Reduced foveolar choroidal blood flow in eyes with increasing AMD severity.Invest Ophthalmol Vis Sci
2005;46:1033–8.
33 Friedman E, Krupsky S, Lane AM, et al. Ocular bloodflow velocity in age-related macular degeneration.Ophthalmology1995;102:640–6.
34 Ciulla TA, Harris A, Chung HS, et al. Color Doppler imaging discloses reduced ocular bloodflow velocities in nonexudative age-related macular degeneration.