This content has been downloaded from IOPscience. Please scroll down to see the full text.
Download details:
IP Address: 151.42.27.217
This content was downloaded on 12/06/2016 at 19:10
Please note that terms and conditions apply.
Geoneutrinos and reactor antineutrinos at SNO+
M Baldoncini1,2, V Strati1,3, S A Wipperfurth4,5, G Fiorentini1,2,3, F
Mantovani1,2, W F McDonough4,5 and B Ricci1,2
1 University of Ferrara, Department of Physics and Earth Sciences, Ferrara, Italy
2 INFN, Ferrara Section, Ferrara, Italy
3 INFN, Legnaro National Laboratories, Legnaro, Italy
4Department of Terrestrial Magnetism, Carnegie Institution of Washington, Washington, USA
5 Department of Geology, University of Maryland, College Park, Maryland, USA
E-mail: [email protected]
Abstract. In the heart of the Creighton Mine near Sudbury (Canada), the SNO+ detector is
foreseen to observe almost in equal proportion electron antineutrinos produced by U and Th in the Earth and by nuclear reactors. SNO+ will be the first long baseline experiment to measure
a reactor signal dominated by CANDU cores (⇠55% of the total reactor signal), which generally
burn natural uranium. Approximately 18% of the total geoneutrino signal is generated by the U and Th present in the rocks of the Huronian Supergroup-Sudbury Basin: the 60% uncertainty on the signal produced by this lithologic unit plays a crucial role on the discrimination power on the mantle signal as well as on the geoneutrino spectral shape reconstruction, which can in principle provide a direct measurement of the Th/U ratio in the Earth.
1. Introduction
Designed as a retrofit of the former Sudbury Neutrino Observatory (SNO) at SNOLAB, SNO+ is a multipurpose kiloton-scale liquid scintillation detector aimed at performing low energy neutrino physics measurements. Thanks to an overburden of 6 km water equivalent and to a very low background, the SNO+ detector can reach several physics goals, including the observation of electron antineutrinos produced by the Earth and by nuclear reactors via the Inverse Beta Decay (IBD) reaction [1].
Geoneutrinos produced in beta minus decays along the238U and232Th decay chains provide an exceptional insight into the Earth’s interior, allowing for the determination of the heat-producing element abundances and hence of the total radiogenic heat power of the planet. The SNO+ detector is located in the Superior Province (Ontario, Canada), one of the Earth’s largest Archean’s cratons, characterized by a thick (⇠ 42 km) continental crust, which gives rise to a sizable geoneutrino crustal signal rate [2]. In this framework, nuclear reactors are the most severe source of background as there is a significant overlap between the reactor antineutrino energy spectrum and the geoneutrino one at low energies. The Bruce, Pickering and Darlington power stations, which are respectively 240 km, 340 km and 350 km far from the SNO+ site, host globally 18 operating cores for a total thermal power of approximately 43 GW [3].
The primary aim of this study is predicting the expected geoneutrino and reactor signals at SNO+ on the basis of existing reference Earth and reactor models. Since these predictions are a↵ected by some degree of uncertainties, the purpose is to highlight priorities for future
operational status, available atwww.fe.infn.it/antineutrino.
In the reactor signal and spectra we identify a near component, corresponding to the contribution originating from the 8 CANDU cores of the Canadian Bruce power station, and a far component, generated by all the other 431 cores operating in the world. We determined the CANDU fission fractions fi (with i =235U,238U,239Pu and241Pu) on the base of the number of
neutrons produced by the i th fissile isotope for a typical CANDU reactor (Table II.3 of [4]) and of the average number of neutrons produced in one fission of the i th isotope [5]. Applying the relation between fission and power fractions (see e.g. Eq. 5 of [3]) the resulting set of power fractions for a CANDU reactor is1:
235U:239Pu:241Pu:238U = 0.543 : 0.411 : 0.022 : 0.024
The investigated sources of uncertainties are the reactor thermal powers and fission fractions, the energy released per fission, the IBD cross section and the electron antineutrino survival probability (in terms of uncertainties on the oscillation parameters) from which we estimate an overall signal uncertainty following the Monte Carlo based approach of [3]. The reactor signal is evaluated in Terrestrial Neutrino Units (TNU), corresponding to one IBD event per 1032free protons per year.
In Table1the two components of the rector signal are reported separately for the Low Energy Region (LER, 1.806 MeV – 3.272 MeV) and the Full Energy Region (FER, 1.806 MeV – 10.000 MeV). It emerges that approximately 38% of the reactor signal in the FER at SNO+ is generated by the Bruce power station, which has a total thermal power of approximately 22 GW. As a consequence, the temporal profile of the signal at SNO+ resembles the temporal profile of the Bruce power station’s e↵ective thermal power, which is the sum of the 8 cores thermal powers, each one weighted by the corresponding monthly load factor.
In Figure 1 the SNO+ reactor signal in the FER and the Bruce power station’s e↵ective thermal power are reported on a monthly time scale, from January 2004 to December 2014. In these 10 years the average total reactor antineutrino signal in the FER is (14.8 ± 1.4) events per 1032free protons per month, where the uncertainty corresponds to the standard deviation of the monthly signal values. According to [6], the signal fluctuations are expected to be reduced in the next future due to upgrades in the management of the turning o↵ schedule of Canadian reactors. In the top-right box of Figure 1 a scatter plot of the total reactor signal in the FER versus the Bruce power station’s e↵ective thermal power is also shown.
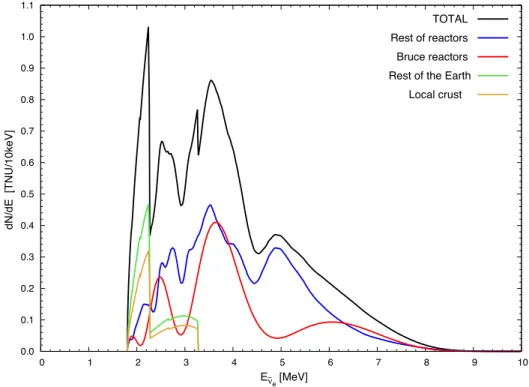
The shape of the reactor spectrum produced by the Bruce power station (Figure 2) shows typical long baseline oscillation structures, modulated in frequency and amplitude by m2 and sin2✓
12, respectively. The more muted oscillation structure of the spectrum produced by the
rest of the reactors is a consequence of the averaging of the contributions of the residual cores distributed globally and reflects a wide range of reactor baselines and antineutrino luminosities.
1 In Table 1 of [3] the order of power fractions for CANDU reactors has been wrongly swapped. This misprint
does not a↵ect the results of the paper since the calculations have been done using the power fractions in the right order.
0 5 10 15 20 25 30
Jan-04 Jul-04 Jan-05 Jul-05 Jan-06 Jul-06 Jan-07 Jul-07 Jan-08 Jul-08 Jan-09 Jul-09 Jan-10 Jul-10 Jan-11 Jul-11 Jan-12 Jul-12 Jan-13 Jul-13 Jan-14 Jul-14
0 5 10 15 20 25 30 35 40 45 50 Events / 10 32 f.p. per month
Bruce monthly effective P
Th [GW] 0 5 10 15 20 25 30
Jan-04 Jul-04 Jan-05 Jul-05 Jan-06 Jul-06 Jan-07 Jul-07 Jan-08 Jul-08 Jan-09 Jul-09 Jan-10 Jul-10 Jan-11 Jul-11 Jan-12 Jul-12 Jan-13 Jul-13 Jan-14 Jul-14
0 5 10 15 20 25 30 35 40 45 50 Events / 10 32 f.p. per month
Bruce monthly effective P
Th [GW] 10 11 12 13 14 15 16 17 18 19 7 8 9 10 11 12 13 14 15 16 17 18 19 20 21 22 Events / 10 32 f.p. per month
Bruce monthly effective PTh[GW]
Figure 1. SNO+ reactor signal and Bruce power station’s e↵ective thermal power. The SNO+ signal in the FER (red solid line, left y axis) and the Bruce power station’s e↵ective thermal power (black dashed line, right y axis) are reported on a monthly time scale from January 2004 to December 2014. In the top-right box a scatter plot of the total reactor signal in the FER and the Bruce power station’s e↵ective thermal power is shown.
3. Geoneutrinos
The prediction of the geoneutrino signal at SNO+ is based on the modeling of the distribution and amount of U and Th in the Earth’s reservoirs. The continental crust, despite accounting for approximately 0.5% of the Earth’s mass, is the main reservoir of U and Th and generates 75% of the total geoneutrino signal expected at SNO+ [7]. For this reason a deep understanding of the continental crust, in particular the region immediately surrounding the detector, is mandatory to evaluate the geoneutrino signal and its uncertainties. These studies can be performed both via 3D geochemical and geophysical crustal models [2] and via heat balance models based on the combination of the Moho heat flux and of the crustal heat production [8].
The local crust of SNO+, i.e. six 2 ⇥2 tiles centered at the detector location, is modeled in [2] and is based on integrating regional geological, geophysical, and geochemical data. The geoneutrino signal from the local crust is predicted to be 15.6+5.33.4TNU. A detailed analysis of the geoneutrino signal contribution from the di↵erent lithologic units of the local crust reveals that the Huronian Supergroup-Sudbury Basin (HS-SB), with a signal of 7.3+5.03.0 TNU, is the major source of signal as well as of uncertainty concerning the local contribution to the expected geoneutrino signal. The±1 range (4.3 - 12.3 TNU) of the geoneutrino signal produced by the HS-SB is comparable with the full range of the expected mantle signal (2 - 19 TNU) [9, 10]. With the perspective of inferring the mantle geoneutrino signal by subtracting the estimated crustal contribution to the total [9], improving the HS-SB modeling is mandatory.
0.0 0.1 0.2 0.3 0.4 0.5 0.6 0.7 0 1 2 3 4 5 6 7 8 9 10 dN/dE [TNU/10keV] E– νe [MeV]
Figure 2. Geoneutrino and reactor antineutrino spectra at SNO+. The geoneutrino spectrum is subdivided into the local crust (brown line) and rest of the Earth (green line) components. The reactor spectrum is split into the contributions generated by the Bruce power station (red line) and by the rest of reactors (blue line). The overall antineutrino spectrum at SNO+ (black line) is also shown.
Table 1. Geoneutrino and reactor antineutrino signals at SNO+ reported in TNU. The total geoneutrino signal is the sum of the contributions from the local crust, the rest of the crust, the continental litospheric mantle and the mantle. The reactor signal is given separately for the LER and FER. The total reactor signal is the sum of the contributions generated by the Bruce power station and by the rest of the reactors.
Geoneutrinos Reactor antineutrinos
LER [TNU] LER [TNU] FER [TNU]
Local crust 15.6+5.33.4 Bruce reactors 17.3+1.00.7 73.7+2.01.8 Rest of the crust 15.1+2.82.4
Rest of reactors 31.2+0.90.8 118.9+2.82.6 Continental litoshperic mantle 2.1+2.91.2
Mantle 9
TOTAL 40+64 TOTAL 48.5+1.81.5 192.6+4.74.4
antineutrino survival probability adopting the oscillation parameters reported in [2]. In Table
1 we summarize the four main geoneutrino signal components at SNO+, corresponding to the local crust, rest of the crust, continental litospheric mantle and mantle contributions.
4. Conclusions and perspectives
As the antineutrino signal in the LER at SNO+ is expected to be generated by nuclear reactors and by the Earth in a ratio of⇠1.2, a detailed characterization of both the geoneutrino and the reactor antineutrino sources is compulsory in terms of both absolute values and uncertainties.
A multitemporal analysis of the expected reactor signal at SNO+ over a time lapse of 10 years (January 2004 – December 2014) reveals that the monthly signal fluctuations associated to di↵erent reactors operational condition are on the order of 10% at 1 level. The 18 operating CANDU reactors belonging to the Bruce, Pickering and Darlington power stations generate approximately 55% of the total reactor signal in the LER at SNO+. For this reason, an accurate profile of the CANDU fissile isotope inventory over the entire duty cycle is mandatory for the SNO+ experiment.
The HS-SB is the strongest geoneutrino source among the local crust reservoirs and it is predicted to produce 7.3+5.03.0 TNU with respect to a total geoneutrino signal of 40+64 TNU. The compositional heterogeneity of this lithologic unit, which is due to the presence of a mixture of Paleoproterozoic sedimentary, metasedimentary and igneous rocks of the Canadian Shield, a↵ects the geoneutrino signal uncertainty on the order of 60%. Therefore, a systematic sampling of the main lithologies of the HS-SB is highly recommended for improving the knowledge of the U and Th content of the unit and to put more stringent constraints on the local contribution to the geoneutrino signal at SNO+.
References
[1] Chen M C 2006 Earth Moon Planet 99 221
[2] Huang Y, Strati V, Mantovani F, Shirey S B and McDonough W F 2014 Geochemistry, Geophysics, Geosystems 15 3925
[3] Baldoncini M, Callegari I, Fiorentini G, Mantovani F, Ricci B, Strati V and Xhixha G 2015 Phys. Rev. D 91 065002
[4] Bain A, Boyd F and Critoph E 1997 Canada enters the nuclear age: a technical history of Atomic Energy of Canada limited as seen from its research laboratories (Canada: McGill-Queen’s University Press) [5] Nichols A, Aldama D and Verpelli M 2008 IAEA INDC (NDS)-0534
[6] Andringa S et al. (SNO+ Collaboration) 2015 Preprint arXiv:1508.05759
[7] Huang Y, Chubakov V, Mantovani F, Rudnick R L and McDonough W F 2013 Geochem. Geophys. Geosyst. 14 2003
[8] Phaneuf C and Mareschal J C 2014 Tectonophysics 622 135
[9] Fiorentini G, Fogli G L, Lisi E, Mantovani F and Rotunno A M 2012 Physical Review D 86
[10] Sramek O, McDonough W F, Kite E S, Lekic V, Dye S T and Zhong S 2013 Earth and Planetary Science Letters 361 356