ScienceDirect
Energy Procedia 00 (2018) 000–000
www.elsevier.com/locate/procedia
1876-6102 Copyright © 2018 Elsevier Ltd. All rights reserved.
Selection and peer-review under responsibility of the scientific committee of the 10th International Conference on Applied Energy (ICAE2018).
10
thInternational Conference on Applied Energy (ICAE2018), 22-25 August 2018, Hong Kong,
China
Thermoeconomic assessment of a PV/T combined heating and
power system for University Sport Centre of Bari
Kai Wang
a, María Herrando
a,b, Antonio M. Pantaleo
a,c, Christos N. Markides
a,*
aClean Energy Processes (CEP) Laboratory, Department of Chemical Engineering, Imperial College London, London SW7 2AZ, United Kingdom bFluid Mechanics Group, University of Zaragoza, Zaragoza 50007, Spain
cDepartment of Agro-Environmental Sciences, University of Bari, Via Amendola 165/A, 70125 Bari, Italy
Abstract
This paper presents a thermoeconomic analysis of a solar combined heating and power (S-CHP) system based on hybrid photovoltaic-thermal (PV/T) collectors for the University Sport Centre (USC) of Bari, Italy. Hourly demand data for space heating, swimming pool heating, hot water and electricity provision as well as the local weather data are used as inputs to a transient model developed in TRNSYS. Economic performance is evaluated by considering the investment costs and the cost savings due to the reduced electricity and natural gas consumptions. The results show that 38.2% of the electricity demand can be satisfied by the PV/T S-CHP system with an installation area of 4,000 m2. The coverage increases to 81.3% if the excess electricity is fed to the
grid. In addition, the system can cover 23.7% of the space heating demand and 53.8% of the demands for the swimming pool and hot water heating. A comparison with an equivalent gas-fired internal combustion engine (ICE) CHP system shows that the PV/T system has a higher payback time, i.e., 11.6 years vs. 3 years, but outperforms the ICE solution in terms of CO2 emission reduction,
i.e., 435 tons CO2/year vs. 164 tons CO2/year. This work suggests that the proposed PV/T S-CHP system has a good potential of
decarbonisation, while the economic competitiveness should be further enhanced to boost its deployment. Copyright © 2018 Elsevier Ltd. All rights reserved.
Selection and peer-review under responsibility of the scientific committee of the 10th International Conference on Applied
Energy (ICAE2018).
Keywords: cogeneration; combined heat and power; CHP; hybrid collector; internal combustion engine; PV/thermal; PV/T; solar energy; sport centre
* Corresponding author. Tel.: +44 (0)20 7594 1601.
1. Introduction
Renewable energy has surpassed fossil fuels as the main driver for global power capacity growth since 2015, accounting for over 50% of new installations [1], with solar photovoltaic (PV) technology playing a vital role and expected to dominate the growth over the next five years. Apart from power generation by using PV panels, solar energy can be harvested effectively as heat via solar thermal technologies [2,3]. Hybrid PV-thermal (PV/T) collectors combine PV cells and solar thermal collectors into one integrated component, offering higher energy output than the side-by-side PV and solar thermal technologies as both heat and electricity are generated from the same aperture area.
Although the PV/T market is still small, PV/T-based systems have attracted an interest recently due to their good potential for covering the cooling, heating and power demands for buildings. Research on PV/T-water systems was mainly focused on system modelling [4], thermal or optical performance improvement [5-7], technology integration [8], as well as technoeconomic and environmental assessment of potential applications [9]. Most of the previous analyses on the PV/T-water systems were targeted for residential buildings [4,5,9,10]. Other types of buildings, such as commercial and public buildings which are considered as important application directions for PV/T systems but less studied, differ significantly from residential buildings in terms of available roof area and energy demand, thereby require further investigations.
This paper aims to investigate the thermoeconomic potential of a PV/T-based solar combined heating and power (S-CHP) system in the University Sport Centre (USC) of Bari, Italy, for covering the demands of swimming pool, hot water, space heating and electricity. Based on the thermoeconomic metrics obtained from an hourly transient model over a year, the PV/T S-CHP system is further compared to an internal combustion engine (ICE) CHP system, so as to assess the potentials and challenges of this renewable energy solution.
2. Methodology
A plan of the USC of Bari, Italy is shown in Fig. 1(a), with roof areas shadowed in red. The thermal demands of the swimming pool, hot water and space heating are currently covered by gas boilers with an annual consumption of about 175,000 Sm3 of natural gas. The water delivery temperatures for the swimming pool and hot water are both
55 °C, while that for space heating is 70 °C. Apart from the thermal demands, the USC requires an annual electricity demand of 814 MWh. In order to reduce the dependency on natural gas for the USC, a PV/T-based S-CHP is proposed to cover the heating and power demands, as shown in Fig. 1(b). The thermal output of the PV/T-water collectors is stored in a water storage tank through a heat transfer loop. If there is thermal demand, the stored energy is extracted and upgraded to the required temperature by existing gas boilers if necessary. The electrical output of the PV/T panels is used to cover the USC’s electricity demand and the surplus electricity at any time step is injected into the grid in net metering option, hence withdrawn from the grid when demand exceeds solar generation.
Fig. 1. (a) The planimetry of the USC of Bari with roof areas shadowed in red, (b) schematic of a PV/T S-CHP system for the USC (SH: space heating; SP: swimming pool; HW: hot water).
The PV/T S-CHP system is modelled in TRNSYS software with hourly local weather and energy demand data given as inputs. Quarter-hourly data are available for the total electricity demand of the USC, which are aggregated into hourly electricity consumption for the simulations. A flat profile from 8 am to 9 pm is assumed to estimate the space heating demand based on the available monthly data. Similarly, a flat profile from 7 am to 9 pm is assumed for the thermal demand for the swimming pool. Hot water demand is required from 12 pm to 10 pm, with an assumed profile in accordance with the profile of users in the USC. Polycarbonate flat-box PV/T collectors, developed in previous
research [11], are considered with a nominal electric power of 240 Wp, an electrical efficiency of 14.7% and a
temperature coefficient of 0.45 %/K. These PV/T collectors are modelled by modifying model element Type 560 to match the thermal performance curve. An installation area of 4,000 m2 is considered for the PV/T collectors, which is
the maximum area that can be covered of the total roof area in the USC. A stratified water storage tank (Type 534) is used for thermal energy storage, with 6 nodes along its vertical axis. Hot water for space heating is extracted via a port at the top of the tank and returns to the lower part (Node 4) of the tank. To satisfy the thermal demand of swimming pool and hot water, which is at a lower temperature, water is extracted through a second port at the upper part (Node 2) of the tank and returned to a lower part (Node 4). In both streams, auxiliary gas boilers are used to heat up the water when the water temperatures are lower than the required ones. The total capacity of the water storage tanks is 200 m3,
considering parallel tanks, which corresponds to the typically value of 50 litre per unit area of PV/T collectors [12]. The economic performance of the PV/T S-CHP is assessed in terms of the payback time by considering the annual cost savings due to the reduced electricity and natural gas bills, together with the investment cost (𝐶0) and the operation and maintenance costs (𝐶O&M). The costs of the PV/T collectors [11], storage tank [13], pumps and fluids [11] are estimated by using correlations based on the existing market prices. The auxiliary heater cost is not included as the USC has gas-fired boilers. The payback time is calculated from,
𝑃𝐵𝑇 =ln[𝐶0(𝑖F−𝑑)𝐹𝑆 +1]
ln(1+𝑖F1+𝑑) ,
(1)
where d is the discount rate (taken as 5% [14]), and iF refers to the inflation rate considered for the annual fuel
savings (taken as 1.23% [15]). To estimate the annual fuel saving, FS, the total utility (electricity and natural gas) cost saving due to the electricity and thermal energy demand covered by the system is estimated as,
𝐹𝑆 = 𝐸cov∙ 𝑐e+ 𝐸grid∙ 𝑠e+𝜂𝑄cov
boiler𝑐ng− 𝐶O&M
,
(2)where Ecov and Qcov are the electrical and thermal demands covered by the system, Egrid the electricity provided to the grid
via net metering, ce and cng the electricity (0.205 €/kWh) and natural gas (0.0563 €/kWh) prices, ηboiler the boiler efficiency
(85%), and se the electricity price for the net metering option applicable to the system (0.103 €/kWh). The utility price
values correspond to current tariffs for the USC of Bari. The annual CO2 emission reduction by the PV/T S-CHP system is
also estimated based on the current CO2 emission factors in Italy. The results are then compared to an ICE-CHP system.
3. Results and discussion
3.1. Transient operation
An hourly transient simulation is performed over a year for the PV/T S-CHP system to assess the thermoeconomic performance. Fig. 2 shows the electricity demand of the USC, the net electricity generated, once subtracted the water-pump consumption, and electricity covered by the PV/T S-CHP system in two representative periods of the year, i.e., 9 days in January and in August. It is observed that the system generates much more electricity than the USC demand at daytimes when solar irradiance is high. The excess electricity, which accounts for more than half of the total generation, is fed into the grid using the net metering option. When the generated electricity is not sufficient to cover all the demand at low or no solar irradiance conditions, electricity from the grid is used to fill the gap. As expected, more electricity is generated in August than that in January by the PV/T S-CHP system (due to high-irradiance and sunny days), which allows the system to cover most of the daytime demand.
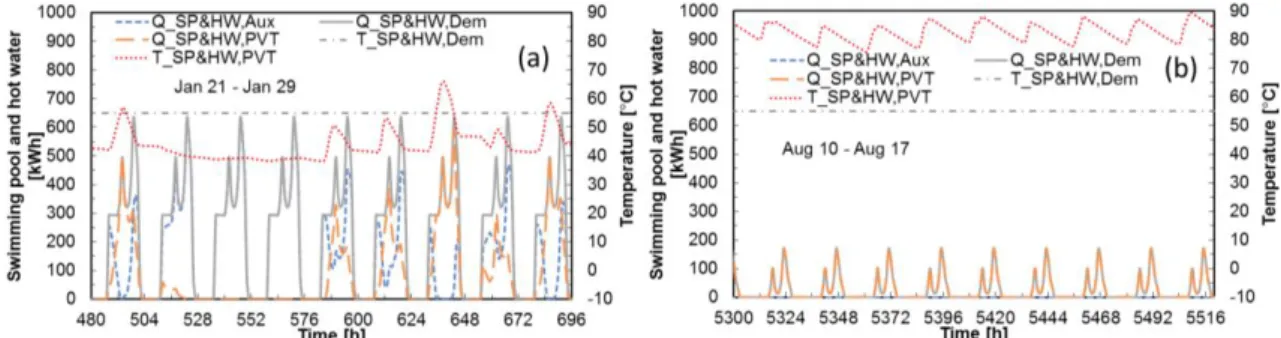
The thermal demand, thermal output and auxiliary heating, as well as the required and delivered water temperatures for the swimming pool heating and hot water are shown in Fig. 3. The temperature of the outlet water from the water storage tank in the 21st – 29th of January is much lower than that in 10th – 17th of August (40-50 °C in
most of the days vs. 80-90 °C), due to the lower solar irradiance in winter. Consequently, in winter auxiliary heating is required (blue dotted lines in Fig. 3 (a)) to heat the water to the delivery set-point temperature (55 °C), while in summer the outlet tank temperature should be cooled down to the set-point temperature, no requiring any auxiliary heating. Thus, only a small amount of the thermal demand is covered by the PV/T S-CHP in January, while a 100% of the demand is satisfied in August. Solar thermal energy from the PV/T S-CHP system serves as the preheating source for swimming pool heating and hot water in most of the winter days, as shown in Fig. 3(a). As before, the water temperature supplied from the top of the water storage tank is lower than the space heating delivery
temperature (70 °C), thus requiring auxiliary heating (blue dotted lines in Fig. 4). Still, the thermal output of the PV/T S-CHP system takes up a considerable amount of the demand through preheating the water (orange dashed lines in Fig. 4), from which the cost of natural gas consumption is reduced.
Fig. 2. Electricity demand (EDem), electricity generated (EPV/Tnet), electricity demand covered (ECov) and total solar irradiance at title angle (Itot): (a)
21st – 29th Jan., (b) 10th – 17th Aug.
Fig. 3. Thermal energy demand (QSP&HW,Dem), thermal output of PV/T collectors (QSP&HW,PV/T), auxiliary heating (QSP&HW,Aux), required (TSP&HW,Dem) and
delivered (TSP&HW,PV/T) water temperatures from the water tank for swimming pool and hot water: (a) 21st – 29th Jan., (b) 10th – 17th Aug.
Fig. 4. Thermal demand (QSH,Dem), thermal output of PV/T collectors (QSH,PV/T), auxiliary heating (QSH,Aux), required water temperature (TSH,Dem)
and water temperature delivered from the water tank (TSH,PV/T) for space heating in 21st – 29th Jan.
3.2. Monthly results
Monthly results of the demand, generation, and demand coverage of the electricity, swimming pool heating and hot water, and space heating are shown in Fig. 5. It is found that the total electricity generation of the PV/T S-CHP system is appropriately the same as the demand in half of a year when solar irradiance is high. However, due to the daily profile of solar energy, only half of the total generated electricity is directly used in the USC, while the rest is exported to the grid. Auxiliary heating is the dominant source for swimming pool heating and hot water usage from November to March, whereas the solar heating covers most of the thermal demand in the rest months. In particular, the contribution of solar heating from June to September is up to 100%. As the space heating with a relatively high water temperature is required in winter, the thermal output of the PV/T S-CHP only covers a small amount of the thermal demand of the space heating, and it is mostly used for water preheating.
Fig. 5. (a) Monthly electricity demand (EDem), generation (EPV/Tnet) and coverage (ECov), (b) monthly thermal demand (QSP&HW,Dem), thermal energy
covered by the PV/T S-CHP system (QSP&HW,PV/T) and auxiliary heating (QSP&HW,Aux) for swimming pool and hot water, (c) monthly thermal
demand (QSH,Dem), thermal energy covered by the PV/T S-CHP system (QSH,PV/T) and auxiliary heating (QSH,Aux) for space heating.
3.3. Economic analysis and comparison with ICE-CHP system
Table 1 summarizes the annual energetic and economic results for the PV/T S-CHP system, as well as the results of an ICE-CHP system. The S-CHP system can cover 23.7% of the total annual space heating demand, 53.8% of the thermal demand of swimming pool and hot water. The total thermal demand in the USC covered by the PV/T S-CHP system is 51.2%. The electricity covered by the S-S-CHP system, defined as the percentage of the electricity demand instantly satisfied, is 38.2%. If the electricity injected to the grid is also included (as it is injected with the net-metering option), the total electricity demand covered increases up to 81.3%. However, the percentage of the instantaneous electricity covered influences the profitability of the investment, because the tariff for the electricity fed into the grid and consumed later on is only the generation cost component (i.e., 50%) of the total electricity tariff. In this case, the payback time (PBT) of the PV/T S-CHP system is 11.6 years.
Table 1. Energetic and economic results of PV/T S-CHP system and ICE-CHP system.
PV/T S-CHP ICE-CHP Installed power (kW) (electrical/thermal breakdown) 624 (electrical) 95 & 185 (electrical & thermal)
SH demand covered (%) 23.7% -
SP&HW demand covered (%) 53.8% -
Total thermal demand covered (%) 51.2% 82.9%
Electricity covered (%) 38.2% 83.1%
Total electricity supply (%) 81.3% 83.1%
Total investment (C0, M€) 1.31 0.328
Payback time (PBT, year) 11.6 3.0
Annual CO2 emission reduction (tons CO2/year) 435 164
For comparison purposes, a gas-fired ICE-CHP system is also assessed. It is found that the ICE-CHP system covers much higher thermal and electricity demands, 82.9% and 83.1% respectively, with a lower investment cost, which results in a payback time of 3 years. The higher coverage of the electricity demand arises from the constant electricity generation of the ICE, which allows a complete instantaneous consumption of all the generated electricity. Although the total electricity generated by the PV/T S-CHP is similar to that generated by the ICE-CHP system, the mismatch between generation and demand in the former case affects the payback time. However, the CO2 emission reduction of the PV/T
S-CHP system is considerably higher than that of the ICE-S-CHP system, which would amongst other help meet the EU commitment of 40% carbon emission reductions by 2030. Further incentives from renewable electricity and heating, and from high efficiency CHP system, are available from the White Certificates mechanism as operated in the Italian energy framework, which provides a contribution up to 250 Eur/TOE (ton oil equivalent) saved. These support measures, that increase the profitability of both the investments here proposed, have not been considered in this preliminary assessment.
4. Conclusion
A S-CHP system has been studied for the provision of electricity, along with swimming pool, hot water and space heating in the USC of Bari, Italy. Transient modelling has been performed in TRNSYS over a year with hourly weather and demand data given as inputs. Excess electricity generated by the PV/T collectors is fed to the grid by using a net metering option. The current gas-fired boilers are used as a backup heating system if the thermal output of the S-CHP is not sufficient. The results show that the total electricity generated by the PV/T S-CHP system corresponds to 81.3% of the total electricity demand of the site, however, due to the temporal variability of the solar irradiance the instantaneous electricity generation covers only 38.2% of the real-time demand, while the rest is exported to the grid and imported later at a lower price. The S-CHP also covers 51.2% of the total thermal demand of the site, including 23.7% of the space heating demand and 53.8% of the demand for swimming pool heating and hot water. An ICE CHP system fired by natural gas has also been assessed for comparison purposes. It is found that the PV/T S-CHP system has a longer payback time than the gas-fired ICE CHP system, i.e., 11.6 years vs. 3 years, but has a much better CO2 emission
reduction performance, i.e., 435 tons CO2/year vs. 164 tons CO2/year. This work suggests that PV/T S-CHP has a good
potential in decarbonisation. However, further efforts relating to technology innovation and cost reduction are required before the PV/T S-CHP system becomes economically competitive with conventional fossil-fuel solutions.
Acknowledgement
This work was supported by the UK Engineering and Physical Sciences Research Council (EPSRC) [grant number EP/M025012/1]. Data supporting this publication can be obtained on request from [email protected].
Reference
[1] www.iea.org (accessed 6/3/2018).
[2] Freeman J, Hellgardt K, Markides CN. An assessment of solar-powered organic Rankine cycle systems for combined heating and power in UK domestic applications. Appl Energy 2015;138:605-20.
[3] Freeman J, Hellgardt K, Markides CN. Working fluid selection and electrical performance optimisation of a domestic solar-ORC combined heat and power system for year-round operation in the UK. Appl Energy 2016;186:291-303.
[4] Herrando M, Markides CN, Hellgardt K. A UK-based assessment of hybrid PV and solar-thermal systems for domestic heating and power: System performance. Appl Energy 2014;161:512-32.
[5] Herrando M, Freeman J, Ramos A, et al. Energetic and economic optimisation of a novel hybrid PV-thermal system for domestic combined heating and power. In: 13th International Conference on Heat Transfer, Fluid Mechanics and Thermodynamics; 2017. p. 966-971.
[6] Ju X, Xu C, Han X, et al. A review of the concentrated photovoltaic/thermal (CPVT) hybrid solar systems based on the spectral beam splitting technology. Appl Energy 2014;187:534-63.
[7] Guarracino I, Mellor A, Ekins-Daukes NJ, et al. Dynamic coupled thermal-and-electrical modelling of sheet-and-tube hybrid photovoltaic/thermal (PVT) collectors. Appl Therm Eng 2016;101:778-795.
[8] Tsai HL. Modeling and validation of refrigerant-based PVT-assisted heat pump water heating (PVTA–HPWH) system. Sol Energy 2015;122:36-47.
[9] Herrando M, Markides CN. Hybrid PV and solar-thermal systems for domestic heat and power provision in the UK: Techno-economic considerations. App Energy 2016;161:512-32.
[10] Ramos A, Chatzopoulou MA, Guarracino I, et al. Hybrid photovoltaic-thermal solar systems for combined heating, cooling and power provision in the urban environment. Energy Convers Manag 2017;150:838-50. [11] Herrando M, Guarracino I, del Amo A, et al. Energy Characterization and Optimization of New Heat Recovery
Configurations in Hybrid PVT Systems. In: International Conference on Solar Energy for Buildings and Industry, ISES Conference Proceedings; 2016.
[12] Calise F, Dentice D’Accadia M, Vanoli L. Design and dynamic simulation of a novel solar trigeneration system based on hybrid photovoltaic/thermal collectors (PVT). Energy Convers Manag 2012;60:214-25.
[13] Lapesa. Geiser Inox,www.lapesa.es/en/domestic-hot-water/geiser-inox.html (accessed19/7/2018).
[14] Kim Y, Thu K, Kaur H, et al. Thermal analysis and performance optimization of a solar hot water plant with economic evaluation. Sol Energy 2012;86:1378-95.
[15] inflation.eu. Historic inflation - overview of CPI inflation year. Worldwide Inflation Data www.inflation.eu/inflation-rates/historic-cpi-inflation.aspx (accessed 5/3/2018).