https://doi.org/10.1007/s10340-019-01095-8 ORIGINAL PAPER
Landscape composition predicts the distribution of Philaenus
spumarius, vector of Xylella fastidiosa, in olive groves
Giacomo Santoiemma1 · Giovanni Tamburini2 · Francesco Sanna1 · Nicola Mori1 · Lorenzo Marini1 Received: 13 August 2018 / Revised: 28 January 2019 / Accepted: 18 February 2019 / Published online: 23 February 2019 © The Author(s) 2019
Abstract
The meadow spittlebug, Philaenus spumarius (Hemiptera: Aphrophoridae; Linnaeus, 1758), is considered the main vector in the ongoing Xylella fastidiosa outbreak in the olive groves of southern Italy. Identifying the factors driving the spatial distribution of P. spumarius is of primary importance to determine X. fastidiosa infection risk in healthy olive groves. Here, we investigated the local and landscape factors shaping the occurrence and abundance of P. spumarius by sampling 182 olive groves over 2 years in the Abruzzo region. We found the occurrence and abundance of the vector to be positively associ-ated with the proportion of olive groves in the landscape and negatively with the cover of vineyards. Philaenus spumarius best responded to landscape processes at small spatial scale (125–250 m) confirming the available information regarding its dispersal ability. At the local scale, soil management and pesticide application did not affect the vector probably because both interventions were not timed according to the vector biology and ecology. Our findings suggest that the management of agricultural landscape mosaics can drive the spatial distribution of P. spumarius. In particular, the landscape composi-tion of the close surrounding of the olive groves may potentially influence the emergence probability of local X. fastidiosa epidemics through its effects on the vector spatial distribution and activity.
Keywords Landscape epidemiology · Meadow spittlebug · Pathogen · Vineyard
Key message
• The meadow spittlebug, Philaenus spumarius, is con-sidered the main vector in the ongoing Xylella fastidiosa outbreak in the olive groves of southern Italy.
• Occurrence and abundance of P. spumarius were meas-ured in 182 healthy olive groves at risk of X. fastidiosa infection.
• Vector occurrence and abundance were positively associ-ated with the proportion of olive groves in the landscape and negatively with the cover of vineyards (125–250-m scale).
• Local management effects on P. spumarius control need further investigation.
Introduction
Xylella fastidiosa is a xylem-limited gram-negative
bacte-rium, known to be the causal agent of a variety of economi-cally important diseases in commercial crops and ornamen-tal plants in North and South America (Purcell 2013; Sicard et al. 2018). In Europe, X. fastidiosa was first recorded on olive trees in southern Italy (Puglia region, province of Lecce) where it has been recognized to be the main cause of the so-called olive quick decline syndrome (Saponari et al.
2013, 2017; Loconsole et al. 2014). The detrimental impact Communicated by V. Gagic.
Giacomo Santoiemma and Giovanni Tamburini have equally contributed to the study.
Electronic supplementary material The online version of this
article (https ://doi.org/10.1007/s1034 0-019-01095 -8) contains
supplementary material, which is available to authorized users. * Giovanni Tamburini
1 DAFNAE, University of Padova, Viale dell’Università 16,
35020 Legnaro, Paduva, Italy
2 Department of Ecology, Swedish University of Agricultural
of this pathogen on yield production and its high infectivity have imposed dramatic control measures in an attempt to halt the spreading pathogen, i.e., the destruction of infected plants and healthy ones around them (EFSA Panel on Plant Health 2015; European Union 2015). Xylella fastidiosa represents a serious threat for many important agricul-tural industries (e.g., olive, grapevine, stone fruits, citrus) among several Mediterranean countries. Nevertheless, the chances of eradicating X. fastidiosa from the region have been showed to be extremely low (Strona et al. 2017) and new introductions of infected plants from outside Europe have already been recorded in southern France and in the island of Mallorca (Denancé et al. 2017; EPPO 2016). There is, therefore, an urgent need to better understand the cryp-tic epidemiology of the outbreak, in order to define new management strategies to contain the epidemic (Strona et al.
2017; Sicard et al. 2018).
Xylella fastidiosa is transmitted to host plants by a wide
range of xylem fluid-feeding sharpshooters and spittlebugs worldwide (Almeida et al. 2005). The bacterium is persistent in the vector and can multiply in the foregut (Hill and Purcell
1995; Baldi and La Porta 2017). The meadow spittlebug,
Philaenus spumarius (Hemiptera: Aphrophoridae; Linnaeus
1758; Fig. 1a), is considered the main vector in the ongoing
X. fastidiosa outbreak in the olive groves of southern Italy
(Saponari et al. 2014; EFSA Panel on Plant Health 2015; Cornara et al. 2017b; White et al. 2017). It is in fact the most abundant xylem fluid-feeding hemipteran in the area (Cornara et al. 2014), commonly present in grasslands and field edges, and it has been found to be the only species that consistently tested positive for the presence of the pathogen (Cornara et al. 2017a, b). Philaenus spumarius completes one generation per year, and it develops as a low mobility nymph on weeds during the spring (Morente et al. 2018), moving beneath olive trees and then to olive canopy during the dry period (Cornara et al. 2017b). Philaenus spumarius has the potential to live under different environmental condi-tions as long as the host plants are actively growing and not
subjected to severe water stress (Cornara et al. 2018). Adults, being able to both jump and fly, can travel for only hundreds of meters during their lifetime (4–6 months. Weaver and King 1954; EFSA Panel on Plant Health 2015). Identifying the factors driving the spatial distribution of P. spumarius is of primary importance to determine X. fastidiosa infection risk in healthy olive groves (Cornara et al. 2018).
Vector biology dictates the transmission dynamics of vec-tor-borne pathogens in a given environment where the host is present (Reisen 2010). However, the characteristics of that environment (e.g., habitat type, presence of food resources, disturbances) can strongly affect vector population growth and dispersal ability, ultimately influencing infection risk (e.g., Overgaard et al. 2003). Locally, crop management can influence the infection risk depending on whether it favors or limits the presence of the vector in the immediate host surroundings (see Plantegenest et al. 2007). The removal of vegetation cover (e.g., mowing, soil tillage) and the appli-cation of pesticides within and surrounding olive orchards are expected to reduce P. spumarius populations because of their impact on nymphs (Cornara et al. 2018). At the land-scape scale, the presence of suitable habitats surrounding the orchards can enhance the potential infection pressure on the focal field. Moreover, the presence of Xylella host in the landscape (e.g., olive orchards), besides supporting vector populations, can prolong the persistence of the disease in the area (Cornara et al. 2018).
Here, we investigate the local and landscape factors shap-ing the occurrence and abundance of P. spumarius in healthy olive groves at risk of X. fastidiosa infection. We sampled 182 olive groves across 2 years in Abruzzo region. Accord-ing to available spread models, the region is considered at risk of infection for its proximity to X. fastidiosa outbreak (Strona et al. 2017; White et al. 2017). To develop effec-tive and timely management strategies to contain X.
fastidi-osa, it is therefore crucial to start investigating vector
ecol-ogy before the arrival of the disease (EFSA Panel on Plant Health 2015). We hypothesized that: (1) Intensive local
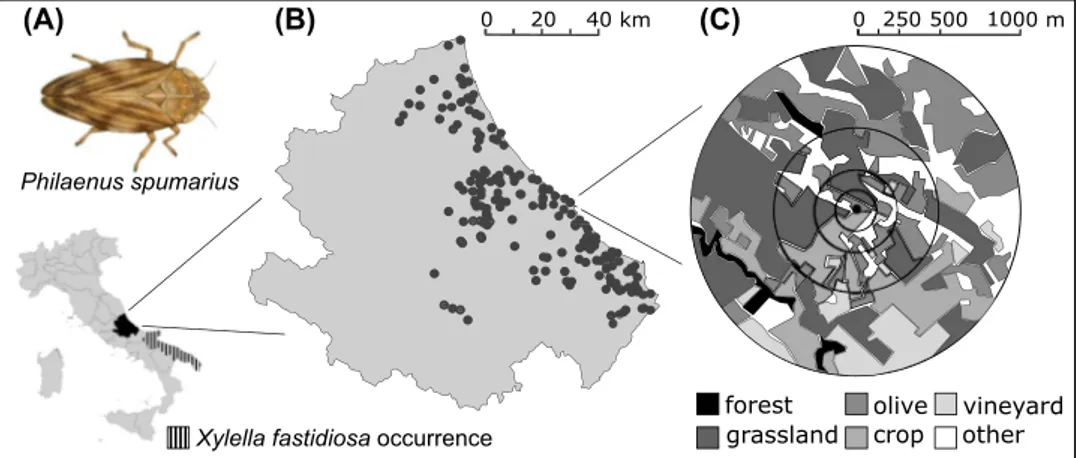
Fig. 1 Study organism Philae-nus spumarius (a), location of experimental groves (b) and example of landscape buffer from 125- to 1000-m scale (c) 0 20 40 km Philaenus spumarius forest vineyard (A) olive 250 500 1000 m 0
Xylella fastidiosa occurrence
(B) (C)
management (i.e., vegetation removal through tillage and pesticide application) would negatively affect P. spumarius; (2) landscapes characterized by a high proportion of grass-lands and olive groves would favor the vector occurrence in olive groves, whereas (3) a high proportion of cropland would limit it. We also explored P. spumarius response to elevation, expecting higher occurrence probability in rela-tively cool sites.
Materials and methods
Study areaThe study was conducted in Abruzzo region, southern Italy (Fig. 1b). The agricultural landscapes in the area are gen-erally dominated by olive groves (25%), grasslands (20%) and vineyards (15%). Semi-natural habitats (25%) are mainly represented by grasslands and mixed broadleaf forests. Grasslands include both pastures and intensive mown mead-ows (see Table S1 in supplementary materials). Climate is transitional between continental and Mediterranean and is strongly influenced by elevation and distance from the sea. The mean annual temperature is 15 C, and the annual pre-cipitation is 850 mm.
Experimental setup
Sampling took place in 182 olive groves mainly located in the eastern part of the region (Fig. 1b). The survey was car-ried out in 2 years, 2016 and 2017, and included, respec-tively, 70 and 127 groves (15 sites were monitored in both years). The elevation of the groves ranged from 6 to 636 m a.s.l., covering the whole elevational range of olive tree in the region. The insect monitoring and the local management information collection were performed by the phytosanitary services of the Abruzzo region.
For each experimental grove, local inspectors collected information regarding soil and pest management. Twenty-seven olive groves out of 70 in 2016 and 10 out of 127 in 2017 were treated against the olive fly in summer mostly using dimethoate. Sixty-four groves out of 70 in 2016 and 73 out of 127 in 2017 were characterized by a permanent grass cover that was mown several times during the growing season, whereas the rest were superficially tilled once in late spring. After tillage, weeds generally re-colonize the bare soil. Repeated tillage is not applied in the study area due to soil erosion problems. No specific local management is cur-rently in place to control P. spumarius. Hence, both pesticide application and soil tillage were not timed according to the vector biology and ecology.
We quantified the landscape characteristics around each olive grove within a 125, 250, 500 and 1000 m radius buffer
(Fig. 1c). Within each buffer, we manually digitized grass-land, forest, olive, crop and vineyard patches by visual inspection of high-resolution satellite images in Google Earth Pro (Google Inc.© 2017). We kept separated vine-yards and annual crops since their specific management could influence P. spumarius occurrence in different ways. In particular, vineyards are frequently tilled and usually treated 1–2 times against several pests such as grape berry moth, scales, thrips and leafhoppers. Repeated tillage is a common practice due to the local vine training system characterized by a dense canopy cover that protects the soil from direct rain impact. We quantified habitat cover (%) at four spatial scales as measure of landscape composition and patch density (number of patches per 100 hectares) at the three largest spatial scales (Table S1; Connors et al. 2013). We did not calculate patch density at 125-m scale because the average patch size in the study area (mean = 6.25 ha, SD = ± 2.94; measured at 1000-m scale) was larger than the buffer area (4.91 ha). All the analyses performed at 125-m scale included therefore patch density measured at the clos-est appropriate scale, i.e., 250 m. We performed landscape analyses in GIS (Quantum GIS 2.14, QGIS Development Team 2014). We found low correlations among landscape features and local management factors (Table S2, Fig. S1). We did not explicitly incorporate olive grove size in the anal-yses because fields are usually well connected and the defini-tion of field boundaries can often be arbitrary. We decided to use the cover of olive groves at our smallest spatial scale (125 m) as a better proxy for olive habitat area.
Adult insect sampling
In each year, the regional phytosanitary service performed a mean of 7 (SD = ± 2.1) consecutive sampling rounds in each site. Philaenus spumarius adults were sampled using one unbaited yellow sticky trap (20 × 24.5 cm) placed in the center of each grove and hung on an olive tree c. 1 m from the ground. This trap has been proved to effectively attract the meadow spittlebug (Elbeaino et al. 2014). In 2016, the sampling started on the 22nd of July and ended on the 28th of October, while in 2017 it started on the 14th of July and ended on the 30th of November. Sticky traps were exposed on average 13 days (SD = ± 2.0) per sampling round. The traps were checked in the laboratory and the number of P.
spumarius individuals counted by the staff at the University
of Padova.
Statistical analysis
We explored the effects of local and landscape factors on
P. spumarius occurrence (presence/absence data) and
abun-dance (number of adults per trap, per sampling round) with generalized linear mixed-effects models (GLMMs; binomial
and negative binomial distribution, respectively). We run four models for each response variable to test the effect of landscape factors at different spatial scales (125, 250, 500 and 1000 m radius). Each model included the cover propor-tion for different habitats (grassland, olive grove, cropland, vineyard) and patch density in the landscape and site eleva-tion as continuous variables, and soil management (grass vs. tilled) and insecticide application (yes vs. no) as categorical variables. We included year and sampling month (categori-cal) in the model to describe the temporal dynamics of the vector. Since the number of exposure days slightly differed among traps, this continuous variable was included in the models as fixed effect (presence/absence data) or as an offset (abundance data). Site ID was considered as random fac-tor. Forest cover was not included since it was expected to have a much weaker effect on P. spumarius compared to the other types of habitat (Cornara et al. 2018). Preliminary analyses confirmed our hypothesis. The variables included in the models as fixed effects presented low collinearity (see Table S2 and Fig. S1 in Supplementary material). The variance inflation factor (VIF) was used to further assess multicollinearity: The highest VIF scores were below 2 (common threshold for VIF is usually > 10; Dormann et al.
2013). The best landscape scale was then identified based on AIC (Akaike 2011). We performed the analyses using the “lme4” package (Bates et al. 2017) implemented in R (R Core Team 2018). We checked the models for overdisper-sion and residual distribution using the “DHARMa” package (Hartig 2017). The DHARMa package uses a simulation-based approach to create readily interpretable scaled residu-als from fitted GLMM. There was no evidence of either spa-tial or temporal autocorrelation of model residuals (analyses performed using “ncf” and “acf” packages, respectively; Bjørnstad 2016). Because of the large amount of zeros in our dataset (60.1% of the observations), we further tested the response of P. spumarius to local and landscape factors with zero-inflated GLMMs (eight models: occurrence and abundance data tested at four landscape scales). We used zero-inflated models as true absences could not be distin-guished from potential false absences related to sampling incompleteness. Models’ characteristics were the same as described above. Results from zero-inflated models were strongly consistent with those of the GLMMs (see Supple-mentary materials; Tables S3-S4) suggesting against the presence of frequent false absences in the dataset (Martin et al. 2005).
Results
We checked 1429 traps exposed during the 2 years, and P.
spumarius was present on 562. We counted a total of 2263 P. spumarius individuals (mean per trap = 1.58, SD = ± 4.8).
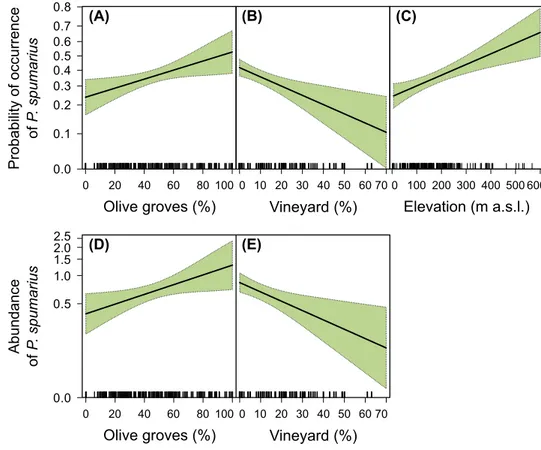
The model at 125-m scale yielded the lowest AIC for both occurrence and abundance (Tables 1 and 2, respectively). For abundance, the model at 250-m scale was equally sup-ported (ΔAIC < 2). Despite the worse fit of the models at larger scales, results were qualitatively similar to those at the 125-m scale. The probability of occurrence and the abun-dance of P. spumarius was both positively influenced by olive grove cover in the landscape (Fig. 2a, d) and negatively affected by vineyard cover (Fig. 2b, d). Vector occurrence was also found to increase with elevation (Fig. 2c). Both occurrence and abundance were higher in 2016 than in 2017 and peaked in August (and October for abundance data), while we found no significant effects of patch density, local management and sampling period on vector populations.
Discussion
We found several environmental factors driving the occur-rence and abundance of P. spumarius in olive groves. At the landscape scale, high proportions of olive groves generally supported a higher occurrence and abundance of P.
spumar-ius, whereas high cover of vineyards was found to negatively
affect its presence. P. spumarius best responded to landscape processes at small spatial scale (125–250 m) confirming the available information in the literature regarding its disper-sal ability (Weaver and King 1954). Olive groves situated at higher elevations had higher probability to harbor this spittlebug. Our findings suggest that the composition of agricultural landscapes affects the spatial distribution of P.
spumarius, potentially influencing the emergence probability
of local X. fastidiosa epidemics.
Our study shows that olive groves represent a suitable habitat for the persistence of P. spumarius populations in agricultural landscapes. A high proportion of olive groves in the landscape supported higher occurrence probability and abundance of P. spumarius in the focal grove. Our find-ings suggest that olive groves probably sustain P. spumarius all along its life cycle: The ground cover vegetation allows nymph development in spring (Morente et al. 2018) while olive trees provide food resources for the adults and a suit-able environment for reproduction during summer (EFSA Panel on Plant Health 2015; Cornara et al. 2017b).
We found high proportion of vineyards in the landscape to negatively affect the occurrence and abundance of P.
spu-marius in the focal groves. Vineyards are generally expected
to support more diverse and abundant insect communities, including P. spumarius populations, in comparison with annual crops (Cornara et al. 2018). Nevertheless, intensively managed vineyards are well known to have detrimental effects on biodiversity at multiple trophic levels (Bruggisser et al. 2010; Nascimbene et al. 2012; Winter et al. 2018). The management of vineyards in the study region is generally
Table 1 R esults of t he GLMMs (f amil y: binomial) tes ting t he r esponse of Philaenus spumar ius occur rence t o landscape com
position, site ele
vation, patc h density , sam pling mont h (Jul y, Augus t, Sep tember , Oct ober , N ov ember), sam pling y
ear (2016, 2017), insecticide (no, y
es) and soil manag
ement (g
rass, tilled). The model consider
ing landscape v ar iables at 125-m scale includes patc h density calculated at 250 m since t he a ver ag e patc h size in t he landscape w as lar ger t han t he buffer ar
ea at 125-m scale. The number of da
ys of tr ap e xposur e w as included as co var iate. Mar ginal ( mR 2) and conditional ( cR 2) pseudo-R -sq uar ed, model es timate (Es t), s tandar d er ror (SE), Z and P v alues ar e pr esented f or eac h model Scale: 125 m Scale: 250 m Scale: 500 m Scale: 1000 m ΔAIC: 0 ΔAIC: 6.4 ΔAIC: 11.8 ΔAIC: 12.8 mR 2 = 0.15 cR 2 = 0.29 mR 2 = 0.14 cR 2 = 0.29 mR 2 = 0.13 cR 2 = 0.29 mR 2 = 0.13 cR 2 = 0.3 Est SE Z P Est SE Z P Est SE Z P Est SE Z P Gr assland − 0.019 0.121 − 0.160 0.8726 0.110 0.116 0.952 0.3409 0.169 0.120 1.415 0.1570 0.047 0.124 0.379 0.7046 Oliv e 0.313 0.131 2.394 0.0167 0.355 0.117 3.043 0.0023 0.331 0.111 2.977 0.0029 0.201 0.111 1.817 0.0692 Cr op 0.097 0.112 0.869 0.3850 0.079 0.105 0.751 0.4529 0.129 0.102 1.264 0.2061 0.111 0.101 1.100 0.2711 Vine yar d − 0.374 0.121 − 3.097 0.0020 − 0.299 0.121 − 2.463 0.0138 − 0.195 0.127 − 1.535 0.1247 − 0.302 0.130 − 2.317 0.0205 Ele vation 0.343 0.093 3.690 0.0002 0.320 0.093 3.456 0.0005 0.341 0.096 3.569 0.0004 0.352 0.100 3.501 0.0005 Patc h density 0.086 0.093 0.923 0.3558 0.090 0.095 0.944 0.3453 0.085 0.094 0.897 0.3697 0.096 0.097 0.995 0.3197 Mont h (v s. Jul y) A ugus t 0.468 0.231 2.027 0.0427 0.474 0.231 2.053 0.0400 0.467 0.231 2.022 0.0432 0.457 0.231 1.981 0.0476 Sep tember 0.316 0.227 1.396 0.1629 0.323 0.227 1.427 0.1536 0.312 0.227 1.376 0.1689 0.307 0.227 1.355 0.1753 Oct ober 0.389 0.237 1.642 0.1006 0.407 0.237 1.715 0.0863 0.400 0.237 1.684 0.0922 0.394 0.237 1.659 0.0972 N ov ember 0.004 0.403 0.010 0.9921 0.025 0.404 0.061 0.9513 0.010 0.404 0.025 0.9797 0.002 0.404 0.006 0.9951 Year (v s. 2016) 2017 − 0.906 0.214 − 4.243 < 0.0001 − 0.907 0.215 − 4.219 < 0.0001 − 0.918 0.215 − 4.262 < 0.0001 − 0.916 0.218 − 4.209 < 0.0001 Insecticide (v s. no) Y es − 0.053 0.243 − 0.219 0.8268 − 0.050 0.245 − 0.202 0.8396 − 0.032 0.248 − 0.128 0.8978 − 0.070 0.252 − 0.280 0.7796 Soil (v s. g rass) T illed 0.244 0.195 1.253 0.2101 0.202 0.197 1.024 0.3060 0.116 0.198 0.584 0.5591 0.104 0.201 0.518 0.6042 D ay s 0.066 0.086 0.773 0.4396 0.071 0.087 0.823 0.4105 0.069 0.086 0.797 0.4253 0.065 0.087 0.745 0.4564
conventional, and it often includes bare soil management and one–two applications of pesticides per year. Our results suggest that P. spumarius might persist with difficulties in intensively managed vineyards and that a high cover of this crop might limit the insect presence at the landscape scale.
Unexpectedly, we did not find any positive effects of grassland cover in the landscape on P. spumarius popula-tions. Although grasslands potentially represent an impor-tant habitat for the meadow spittlebug (Cornara et al. 2018), their effects on population abundances are conditioned largely by management intensity (Weaver and King 1954). Pastures and intensive mown meadows might not favor P.
spumarius development and persistence because of
veg-etation disturbance due to frequent mowing and grazing (Weaver and King 1954). Moreover, although the number of patches in the landscape is known to potentially affect herbivore populations (e.g., Olson et al. 2018), we did not find patch density to be an important predictor of P.
spu-marius occurrence and abundance. The vector in our study
area was most probably limited more by the cover of suitable habitats rather than by the configuration of the landscape that potentially affect its dispersal.
The effects of landscape composition on the occurrence of P. spumarius in olive groves were consistent across dif-ferent spatial scales but stronger at 125 m radius. Our results are consistent with the available information on the ability of the meadow spittlebug to move across habitats (Cornara
et al. 2018) and are in line with the available data regard-ing its dispersal ability (few hundreds of meters per year; Weaver and King 1954; EFSA Panel on Plant Health 2015).
We found high elevation to increase the meadow spit-tlebug occurrence probability, although this effect was not significant when exploring vector abundance. Even though
P. spumarius can tolerate a wide variety of climatic
condi-tions (Cornara et al. 2018), olive groves located at higher elevations might have favored its persistence because of cooler temperatures. The optimal temperature described for the survival and reproduction of P. spumarius is in fact 15.6 °C (Karban and Strauss 2004). This result suggests that the northern and cooler regions are highly suitable for the vector establishment and persistence. Moreover, we found P.
spumarius occurrence and abundance to peak in August, the
warmest month of the year in the study area: The meadow spittlebug is in fact known to move to olive canopies during the dry period (Cornara et al. 2017b). Vector abundance peaked again in October, probably because of increased adult activity driven by cooler temperatures (Cornara et al.
2017b).
Pest control measures adopted in olive groves targeting other organisms (e.g., Prays oleae B., Bactrocera oleae R.,
Euphyllura olivina C., Saissetia oleae O.; Paredes et al.
2015) did not affect adults of P. spumarius. The timing and the location of insecticide application (ground vs. tree foliage) should be targeted to P. spumarius to increase
Fig. 2 Probability of occurrence (a–c) and abundance (d–e) of Philaenus spumarius (per trap per sampling round) in response to the proportion of olive groves and vineyards in the landscape (125-m scale) and to elevation. Plots include model estimate (black line) and 95% confidence interval (green shading). Plots presenting partial residuals are available in the supplementary materials (Fig. S2). (Color figure online) (A) (B) (C) Olive groves (%) Probability of occurrence of P. spumarius 0.1 0.2 0.3 0.4 0.5 0.6 0.7 0.8 0 20 40 60 80 100 Vineyard (%) 0 10 20 30 40 50 60 70 Elevation (m a.s.l.) 100 200 300 400 500 600 (D) (E) Olive groves (%) Abundanc e of P. spumariu s 0.0 0.5 1.0 1.5 2.5 0 20 40 60 80 100 Vineyard (%) 0 10 20 30 40 50 60 70 2.0 0 0.0
Table 2 R esults of t he GLMMs (f amil y: neg ativ e binomial) tes ting t he r esponse of Philaenus spumar ius abundance t o landscape com
position, site ele
vation, patc h density , sam pling mont h (Jul y, A ugus t, Sep tember , Oct ober , N ov ember), sam pling y
ear (2016, 2017), insecticide (no, y
es) and soil manag
ement (g
rass, tilled). The model consider
ing landscape v ar iables at 125-m scale includes patc h density calculated at 250 m since t he a ver ag e patc h size in t he landscape w as lar ger t han t he buffer ar
ea at 125-m scale. The number of da
ys of tr ap e xposur e w as included as an offse t. Mar ginal ( mR 2) and conditional ( cR 2) pseudo-R -sq uar ed, model es timate (Es t), s tandar d er ror (SE), Z and P v alues ar e pr esented f or eac h model Scale: 125 m Scale: 250 m Scale: 500 m Scale: 1000 m ΔAIC: 0 ΔAIC: 1.3 ΔAIC: 2.9 ΔAIC: 6.3 mR 2 = 0.23 cR 2 = 0.65 mR 2 = 0.22 cR 2 = 0.63 mR 2 = 0.23 cR 2 = 0.64 mR 2 = 0.21 cR 2 = 0.64 Est SE Z P Est SE Z P Est SE Z P Est SE Z P Gr assland 0.062 0.122 0.508 0.6113 0.179 0.116 1.541 0.1233 0.270 0.118 2.280 0.0226 0.162 0.122 1.331 0.1830 Oliv e 0.300 0.129 2.322 0.0203 0.352 0.114 3.092 0.0020 0.347 0.107 3.229 0.0012 0.209 0.108 1.946 0.0517 Cr op 0.204 0.112 1.816 0.0694 0.164 0.104 1.577 0.1148 0.189 0.100 1.891 0.0586 0.123 0.099 1.239 0.2153 Vine yar d − 0.331 0.122 − 2.725 0.0064 − 0.273 0.121 − 2.255 0.0241 − 0.166 0.124 − 1.336 0.1815 − 0.279 0.129 − 2.165 0.0304 Ele vation 0.147 0.093 1.590 0.1119 0.140 0.091 1.534 0.1251 0.150 0.093 1.614 0.1066 0.147 0.098 1.497 0.1345 Patc h density 0.023 0.095 0.244 0.8074 0.037 0.095 0.389 0.6969 − 0.011 0.093 − 0.114 0.9096 0.044 0.096 0.457 0.6480 Mont h (v s. Jul y) A ugus t 0.409 0.182 2.249 0.0245 0.418 0.182 2.302 0.0214 0.412 0.182 2.263 0.0237 0.407 0.182 2.241 0.0251 Sep tember 0.272 0.180 1.514 0.1301 0.279 0.179 1.554 0.1203 0.271 0.180 1.508 0.1315 0.269 0.180 1.498 0.1340 Oct ober 0.409 0.190 2.149 0.0316 0.424 0.190 2.227 0.0259 0.422 0.190 2.217 0.0266 0.419 0.190 2.201 0.0277 N ov ember 0.005 0.347 0.015 0.9884 0.010 0.347 0.028 0.9773 − 0.015 0.346 − 0.045 0.9644 − 0.024 0.346 − 0.071 0.9437 Year (v s. 2016) 2017 − 0.834 0.184 − 4.541 < 0.0001 − 0.827 0.183 − 4.514 < 0.0001 − 0.843 0.183 − 4.610 < 0.0001 − 0.854 0.185 − 4.613 < 0.0001 Insecticide (v s. no) Y es − 0.054 0.237 − 0.230 0.8181 − 0.067 0.235 − 0.285 0.7755 − 0.046 0.235 − 0.196 0.8442 − 0.110 0.240 − 0.459 0.6462 Soil (v s. g rass) T illed 0.236 0.191 1.235 0.2167 0.190 0.191 0.996 0.3191 0.105 0.190 0.554 0.5799 0.091 0.194 0.468 0.6399
pesticide effectiveness. For example, treatments in mid-summer have been previously found to be ineffective in spittlebug control, because of successive migration from surrounding habitats. On the other hand, although removal of vegetation cover through tillage is expected to drasti-cally reduce vector populations (Cornara et al. 2018), one tillage event per year might be insufficient in affecting P.
spumarius. Weedy vegetation can in fact rapidly
re-col-onize the bare soil after disturbance, probably allowing an efficient re-establishment of P. spumarius population from the surroundings. It is important to stress that no olive grove in the area kept a permanent bare ground cover due to erosion problems. Hence, more studies are urgently needed to identify specific local management strategies to effectively control P. spumarius (Cornara et al. 2018).
The probability of spread of X. fastidiosa and its estab-lishment in novel areas in Europe is considered to be very high, because of the abundance of suitable host plants and the wide distribution and polyphagy of its vectors (EFSA Panel on Plant Health 2015). Determining the factors driving X. fastidiosa disease invasion is pivotal to better forecast future spread patterns (White et al. 2017). Our study shows that olive groves are a key habitat for the presence and abundance of the vector in agroecosystems. Landscapes at higher elevations dominated by a matrix of olive groves are more likely to harbor populations of P.
spumarius and are therefore more exposed to the risk of
emergence of novel X. fastidiosa epidemics. More studies are urgently needed to, first, identify efficient local man-agement strategies to control P. spumarius, and second, to better understand the role of multiple habitats (e.g., field margins) in affecting vector movements across agricultural landscapes.
Author contributions
LM and NM conceived and designed research. NM super-vised data collection. GS and FS identified specimens and compiled landscape dataset. GS, GT and LM performed data analysis and manuscript drafting.
Acknowledgements We are grateful to the farmers who allowed us to carry out the sampling, to Domenico D’Ascenzo and Maria Assunta Scotillo who coordinated the field surveys and to the local inspectors of the phytosanitary services who performed the insect sampling and collected information on local management.
Funding This work was supported by Regione Abruzzo - Dipartimento
Politiche Dello Sviluppo Rurale E Della Pesca through the project “Monitoraggio ed ecologia di Philaenus spumarius e degli altri vet-tori di Xylella fastidiosa in Abruzzo.”
Compliance with ethical standards
Conflict of interest The authors declare that they have no conflict of interest.
Human and animal rights This article does not contain any studies with human participants or animals (vertebrates) performed by any of the authors.
Open Access This article is distributed under the terms of the
Crea-tive Commons Attribution 4.0 International License (http://creat iveco
mmons .org/licen ses/by/4.0/), which permits unrestricted use, distribu-tion, and reproduction in any medium, provided you give appropriate credit to the original author(s) and the source, provide a link to the Creative Commons license, and indicate if changes were made.
References
Akaike H (2011) Akaike’s information criterion. In: International ency-clopedia of statistical science. Springer, Berlin, p 25
Almeida RPP, Blua MJ, Lopes JORS, Purcell AH (2005) Vector trans-mission of Xylella fastidiosa: applying fundamental knowledge to generate disease management strategies. Annu Entomol Soc Am
96:775–786. https ://doi.org/10.1603/0013-8746(2005)098%5b077
5:vtoxf a%5d2.0.co;2
Baldi P, La Porta N (2017) Xylella fastidiosa: host range and advance
in molecular identification techniques. Front Plant Sci 8:944. https
://doi.org/10.3389/fpls.2017.00944
Bates D, Maechler M, Bolker B, et al (2017) Linear mixed-effects models using “Eigen” and S4. R package version 1.1–15. 1–117 Bjørnstad ON (2016) Spatial nonparametric covariance functions. R
package version 1.1-7. 1–42
Bruggisser OT, Schmidt-Entling MH, Bacher S (2010) Effects of vineyard management on biodiversity at three trophic levels.
Biol Conserv 143:1521–1528. https ://doi.org/10.1016/j.bioco
n.2010.03.034
Connors JP, Galletti CS, Chow WT (2013) Landscape configuration and urban heat island effects: assessing the relationship between landscape characteristics and land surface temperature in Phoenix,
Arizona. Landsc Ecol 28:271–283. https ://doi.org/10.1007/s1098
0-012-9833-1
Cornara D, Loconsole G, Boscia D et al (2014) Survey of the auchen-orrhyncha in the Salento Peninsula in search of putative vectors of Xylella fastidiosa Pauca Codiro strain. J Plant Pathol 96:S4 Cornara D, Cavalieri V, Dongiovanni C et al (2017a) Transmission
of Xylella fastidiosa by naturally infected Philaenus spumarius (Hemiptera, Aphrophoridae) to different host plants. J Appl
Ento-mol 141:80–87. https ://doi.org/10.1111/jen.12365
Cornara D, Saponari M, Zeilinger AR et al (2017b) Spittlebugs as vectors of Xylella fastidiosa in olive orchards in Italy. J Pest Sci
90:521–530. https ://doi.org/10.1007/s1034 0-016-0793-0
Cornara D, Bosco D, Fereres A (2018) Philaenus spumarius: when an old acquaintance becomes a new threat to European agriculture. J
Pest Sci 91:957–972. https ://doi.org/10.1007/s1034 0-018-0966-0
Denancé N, Legendre B, Briand M et al (2017) Several subspecies and sequence types are associated with the emergence of Xylella fas-tidiosa in natural settings in France. Plant Pathol 66:1054–1064.
https ://doi.org/10.1111/ppa.12695
Dormann CF, Elith J, Bacher S et al (2013) Collinearity: a review of methods to deal with it and a simulation study evaluating
their performance. Ecography 36:27–46. https ://doi.org/10.111
EFSA Panel on Plant Health (2015) Scientific Opinion on the risks to plant health posed by Xylella fastidiosa in the EU territory, with the identification and evaluation of risk reduction options. EFSA
J 13:3989. https ://doi.org/10.2903/j.efsa.2015.3989
Elbeaino T, Yaseen T, Valentini F et al (2014) Identification of three potential insect vectors of Xylella fastidiosa in southern Italy.
Phytopathol Mediterr 53:328–332. https ://doi.org/10.14601 /phyto
patho l_medit err-14113
EPPO Reporting Service no. 11 – 2016, Num. article 2016/213 European Union (2015) Commission implementing decision (EU)
2015/789 of 18 May 2015 as regards measures to prevent the introduction into and the spread within the union of Xylella fastidi-osa (Wells et al.) (notified under document C(2015) 3415) Google Inc. © (2017) Google Earth Pro
Hartig F (2017) Residual diagnostics for hierarchical (multi-level/ mixed) regression models. R package version 0.1.5. 1–21 Hill BL, Purcell AH (1995) Acquisition and retention of Xylella
fas-tidiosa by an efficient vector, Graphocephala atropunctata.
Phy-topathology 85:209–212. https ://doi.org/10.1094/Phyto -85-209
Karban R, Strauss SY (2004) Physiological tolerance, climate change, and a northward range shift in the spittlebug, Philaenus
spu-marius. Ecol Entomol 29:251–254. https ://doi.org/10.111
1/j.1365-2311.2004.00576 .x
Loconsole G, Potere O, Boscia D et al (2014) Detection of Xylella fastidiosa in olive trees by molecular and serological methods.
J Plant Pathol 96:7–14. https ://doi.org/10.4454/JPP.V96I1 .041
Martin TG, Wintle BA, Rhodes JR, Kuhnert PM, Field SA, Low-Choy SJ, Tyre AJ, Possingham HP (2005) Zero tolerance ecol-ogy: improving ecological inference by modelling the source of
zero observations. Ecol Lett 8:1235–1246. https ://doi.org/10.111
1/j.1461-0248.2005.00826 .x
Morente M, Cornara D, Plaza M, Durán J, Capiscol C, Trillo R, Ruiz M, Ruz C, Sanjuan S, Pereira J, Moreno A, Fereres A (2018) Distribution and relative abundance of insect vectors of xylella fastidiosa in olive groves of the iberian peninsula. Insects 9(4):175 Nascimbene J, Marini L, Paoletti MG (2012) Organic farming benefits
local plant diversity in vineyard farms located in intensive
agri-cultural landscapes. Environ Manag 49:1054–1060. https ://doi.
org/10.1007/s0026 7-012-9834-5
Olson DM, Prescott KK, Zeilinger AR, Hou S, Coffin AW, Smith CM, Ruberson JR, Andow DA (2018) Landscape Effects on Reproduc-tion of Euschistus servus (Hemiptera: Pentatomidae), a mobile, polyphagous, multivoltine arthropod herbivore. Environ Entomol
47:660–668. https ://doi.org/10.1093/ee/nvy04 5
Overgaard HJ, Ekbom B, Suwonkerd W, Takagi M (2003) Effect of landscape structure on anopheline mosquito density and diversity in northern Thailand: implications for malaria transmission and
control. Landsc Ecol 18:605–619. https ://doi.org/10.1023/a:10260
74910 038
Paredes D, Cayuela L, Gurr GM, Campos M (2015) Is ground cover vegetation an effective biological control enhancement strategy
against Olive Pests? PLoS ONE. https ://doi.org/10.1371/journ
al.pone.01172 65
Plantegenest M, Le May C, Fabre F (2007) Landscape
epidemiol-ogy of plant diseases. J R Soc Interface 4:963–972. https ://doi.
org/10.1098/rsif.2007.1114
Purcell A (2013) Paradigms: examples from the bacterium Xylella
fastidiosa. Annu Rev Phytopathol 51:339–356. https ://doi.
org/10.1146/annur ev-phyto -08271 2-10232 5
QGIS Development Team (2014) Quantum GIS Geographic Informa-tion System
R Core Team (2018) R: a language and environment for statistical computing
Reisen WK (2010) Landscape epidemiology of vector-borne diseases.
Annu Rev Entomol 55:461–483. https ://doi.org/10.1146/annur
ev-ento-11240 8-08541 9
Saponari M, Boscia D, Nigro F, Martelli GP (2013) Identification of DNA sequences related to Xylella fastidiosa in oleander, almond and olive trees exhibiting leaf scorch symptoms in Apulia (South-ern Italy). J Plant Pathol 95:668
Saponari M, Loconsole G, Cornara D et al (2014) Infectivity and trans-mission of Xylella fastidiosa by Philaenus spumarius (Hemiptera: Aphrophoridae) in Apulia, Italy. J Econ Entomol 107:1316–1319.
https ://doi.org/10.1603/ec141 42
Saponari M, Boscia D, Altamura G et al (2017) Isolation and path-ogenicity of Xylella fastidiosa associated to the olive quick
decline syndrome in southern Italy. Sci Rep 7:17723. https ://doi.
org/10.1038/s4159 8-017-17957 -z
Sicard A, Zeilinger AR, Vanhove M et al (2018) Xylella fastidiosa: insights into an emerging plant pathogen. Annu Rev Phtopathol
56:181–202. https ://doi.org/10.1146/annur ev-phyto -08041
7-04584 9
Strona G, Carstens CJ, Beck PSA (2017) Network analysis reveals why
Xylella fastidiosa will persist in Europe. Sci Rep 7:71. https ://doi.
org/10.1038/s4159 8-017-00077 -z
Weaver CR, King DR (1954) Meadow spittlebug. Philaenus leucophtal-mus (L.) Research Bulletin, 741. Ohio Agricultural Experimental Station, Wooster
White SM, Bullock JM, Hooftman DAP, Chapman DS (2017) Model-ling the spread and control of Xylella fastidiosa in the early stages
of invasion in Apulia, Italy. Biol Invasions 19:1825–1837. https ://
doi.org/10.1007/s1053 0-017-1393-5
Winter S, Bauer T, Strauss P et al (2018) Effects of vegetation management intensity on biodiversity and ecosystem
ser-vices in vineyards: a meta-analysis. J Appl Ecol. https ://doi.
org/10.1111/1365-2664.13124
Publisher’s Note Springer Nature remains neutral with regard to jurisdictional claims in published maps and institutional affiliations.