DEPARTMENT OF CIVIL ENGINEERING
DEPARTMENT OF CIVIL ENGINEERING PhD course in Risk and
Sustainability in Civil, Architecture and Environmental Engineering
Systems
XXXI CYCLE - N.S. (2015-2018)
PhD course in Steel and Composite Construction
University of Salerno
University of Coimbra
PSEUDO DYNAMIC TESTS AND NUMERICAL ANALYSIS
OF FREE FROM DAMAGE MULTISTOREY STEEL
BUILDINGS WITH INNOVATIVE CONNECTIONS
a.a. 2018/2019
Giovanni Ferrante Cavallaro
Tutor
Tutor
Prof. Gianvittorio Rizzano
Prof. Aldina Santiago
Co-tutor
Co-tutor
Prof. Vincenzo Piluso
Prof. Luís Simões da Silva
President of the Doctoral
College
President of the Doctoral
College
“E se per caso non doveste vederci più,
sarete certi, che come ogni altra cosa al mondo,
ci rivedremo un giorno tra le stelle.”
Pseudo dynamic tests and numerical analysis of free from damage multistorey steel buildings with innovative connections
List of figures ……….…
xiList of tables ………
xxxiABSTRACT
1CHAPTER 1
51.1. Traditional Moment – Resisting Frames (MRFs)
71.1.1. Joints classification 9
1.1.2. Frame classification 12
1.1.3. Seismic design of MRFs 14
1.2. Recent research developments and proposal for
an innovative solution
Pseudo dynamic tests and numerical analysis of free from damage multistorey steel buildings with innovative connections
1.3. Objective of the thesis
181.4. References
20CHAPTER 2
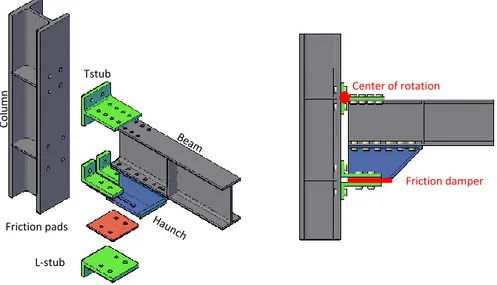
232.1. The FREEDAM connection
252.2. Choice of friction material
28 2.2.1. Friction shims coating process 302.2.2. Experimental layout 36
2.2.3. Experimental tests – Results 1st phase 41 2.2.4. Experimental tests – Results 2nd phase 57
2.3. Conclusions
852.4. References
86CHAPTER 3
893.1. Bolts pre-load
913.1.1. Tightening procedures according to EN1090-2 93
3.2. Tightening tests and short-term relaxation tests
on SFC sub-assemblies
100
3.2.1. Experimental layout 100
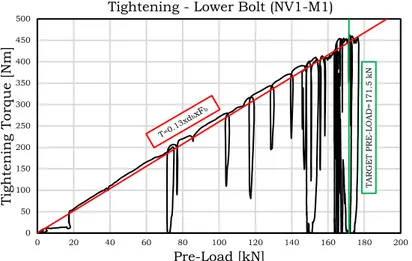
3.2.2. Tightening tests 104
3.2.3. Short-term and mid-term relaxation tests 111
3.3. Conclusions
123Pseudo dynamic tests and numerical analysis of free from damage multistorey steel buildings with innovative connections
CHAPTER 4
1294.1. Design procedure of a FREEDAM connection
1314.2. Tests on internal beam-to-column joints
143 4.2.1. Design of specimen whit friction pads inhorizontal configuration
145
4.2.2. Design of specimen whit friction pads in vertical configuration 158 4.2.3. Experimental layout 171 4.2.4. Coupons tests 181 4.2.5. Experimental results 184
4.3. FE Models
2224.3.1. Introduction to the finite element simulations 222 4.3.2. Geometry description and modelling
assumptions
222
4.3.3. Monitored parameters 227
4.3.4. Experimental results vs. FE analyses 229
4.4. Conclusions
2354.5. References
236CHAPTER 5
2375.1. Introduction to pseudo-dynamic tests
239 5.1.1. Procedure of a pseudo-dynamic test 243 5.1.2. Advantages and disadvantages of pseudo- 246Pseudo dynamic tests and numerical analysis of free from damage multistorey steel buildings with innovative connections
dynamic tests
5.2. Design of the structure for the pseudo-dynamic
test
247
5.2.1. Definition of loads and masses 248 5.2.2. Frame design with the iterative procedure of the
theory of control of the collapse mechanism
251
5.2.3. Overview collapse mechanisms 255 5.2.4. Design of the frame with the procedure in closed
form of the control theory of the collapse mechanism.
278
5.2.5. Design of the benchmark beam-to-column joint and experimental behaviour
296
5.2.6. Design of FREEDAM connection 301
5.3. Definition of a set of accelerograms
3135.4. Structural model in SeismoStruct
322 5.4.1. Seismostruct model for frame equipped withFREEDAM connections
323
5.4.2. Seismostruct model for frame equipped with RBS connections
330
5.4.3. Numerical simulations using SeismoStruct model
334
5.4.4. Modal analysis for the determination of natural periods of vibration of the structure
334
Pseudo dynamic tests and numerical analysis of free from damage multistorey steel buildings with innovative connections
5.4.6. Incremental dynamic analysis (IDA) 339
5.4.7. Remarks 411
5.5. Choice of the accelerogram for the
pseudo-dynamic test
418
5.5.1. RAINFLOW method 419
5.5.2. Final considerations 427
5.6. Pseudo-dynamic test on specimen equipped with
RBS connections
428
5.6.1. Experimental set-up 428
5.6.2. Pseudo-dynamic test 435
5.6.3. Comparison between numerical analysis and experimental results
439
5.7. Pseudo-dynamic test on specimen equipped with
FREEDAM connections
457
5.8. References
463CHAPTER 6 - Conclusions
465Pseudo dynamic tests and numerical analysis of free from damage multistorey steel buildings with innovative connections
List of figures
Fig. 1.1 - Structural typologies of moment resistant frames……… 7
Fig. 1.2 -
Spatial distribution: a) space frames; b) perimeter frames; c) MRFs in only a few rigid bays – Source:
Astaneh-Asl [1]……….. 8
Fig. 1.3 -
Beam-to-column joints classification according to their
flexural resistance..………. 10 Fig. 2.1 - FREEDAM connection………...………..….. 25
Fig. 2.2 -
Preliminary treatment: a) plates before treatment; b)
mechanical blasting; c) grinding………. 32
Fig. 2.3 -
Electric arc wire spray: a) plates before spray; b) machine for electric arc wire spray; c) spray
coating……...……… 33 Fig. 2.4 - Plates at the end of the process………...………..… 33
Fig. 2.5 -
a) Typical layout of a specimen; b) specimen in the
machine………... 37
Fig. 2.6 - Tightening sequence ………...……….. 40 Fig. 2.7 - Typical Torque vs Pre-load diagram……….……… 41
Pseudo dynamic tests and numerical analysis of free from damage multistorey steel buildings with innovative connections
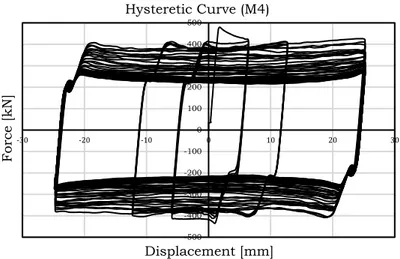
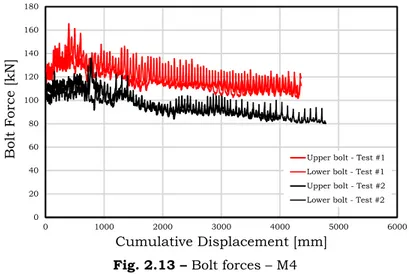
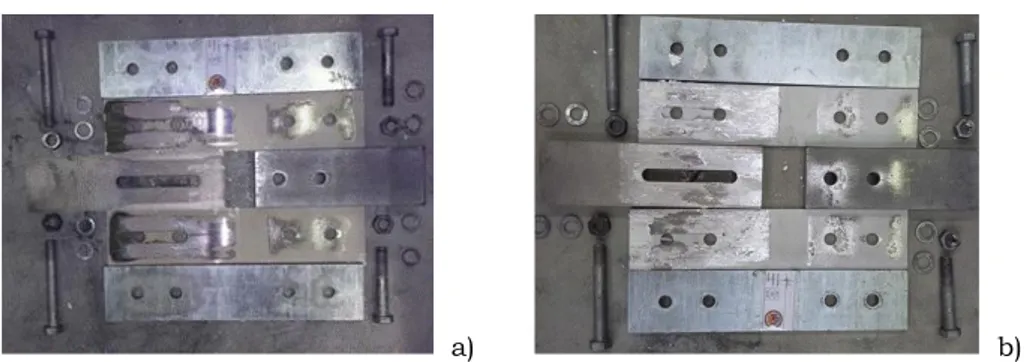
Fig. 2.8 - Hysteretic behaviour of soft materials: M2 …….………… 44 Fig. 2.9 - Hysteretic behaviour of soft materials: M3……….…….... 44 Fig. 2.10 - Hysteretic behaviour of soft materials: M1…..……… 45 Fig. 2.11 - Hysteretic behaviour of soft materials: M4………….….… 46 Fig. 2.12 - Actual friction coefficient – M4……….………... 46 Fig. 2.13 - Bolt forces – M4……….………..………. 47 Fig. 2.14 - Damage of the interfaces: a) M1; b) M4………..…………. 48 Fig. 2.15 - Hysteretic behaviour of hard materials: Carbide M6…… 49 Fig. 2.16 - Hysteretic behaviour of hard materials: Carbide M7….. 50
Fig. 2.17 -
Hysteretic behaviour of hard materials: 3M friction
shims……… 50
Fig. 2.18 -
Damage of the interfaces: a) M6; b) 3M friction
shims……… 51
Fig. 2.19 - Typical diagrams of the bolt forces ……….…………. 52 Fig. 2.20 - ”Actual“ friction coefficient vs cumulative travel: M6…. 53
Fig. 2.21 -
Comparisons: “Actual” friction coefficient vs cumulated
displacement………... 54
Fig. 2.22 -
Comparisons: “Effective” friction coefficient vs
cumulated displacement……… 54 Fig. 2.23 - Energy dissipation capacity………. 56 Fig. 2.24 - Energy degradation………..………... 56
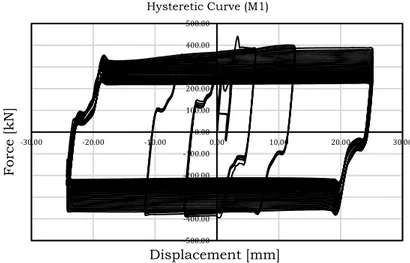
Fig. 2.25 -
Influence of the bolts’ pre-load over the
force-displacement hysteretic response (M1)………. 59
Fig. 2.26 -
Influence of the bolts’ pre-load over the
force-displacement hysteretic response (M4)………. 62
Fig. 2.27 -
Influence of the bolts’ pre-load over the
force-displacement hysteretic response (M6)………. 63
Fig. 2.28 -
Influence of the bolts’ pre-load over the actual friction
coefficient……… 66
Pseudo dynamic tests and numerical analysis of free from damage multistorey steel buildings with innovative connections
Fig. 2.30 - Bolts’ preloading and effective damping for material M4 68 Fig. 2.31 - Bolts’ preloading and effective damping for material M6 69 Fig. 2.32 - Effect of disc springs………... 70
Fig. 2.33 -
Influence of the disc spring configuration over the
hysteretic response (M1)……… 72
Fig. 2.34 -
Influence of the disc spring configuration over the
hysteretic response (M4)……… 74
Fig. 2.35 -
Influence of the disc spring configuration over the
hysteretic response (M6)……… 76 Fig. 2.36 - Bolts’ preloading and effective damping for material M1 77 Fig. 2.37 - Bolts’ preloading and effective damping for material M4 78 Fig. 2.38 - Bolts’ preloading and effective damping for material M6 79
Fig. 2.39 -
Influence of the disc spring configuration over the
preload and effective friction coefficient ……….. 85
Fig. 3.1 -
Torque method. a) Current procedure with Vk=0.06 and mean value equal to 0.77fubAb; b) Improved
procedure with mean value equal to 0.80fubAb………….. 96
Fig. 3.2 -
Combined method, distribution preload according to
EN 1090-2 [10]……….. 97
Fig. 3.3 -
Configurations adopted for the tightening tests. a) HV
washers; b) HV + Disc Spring washers………. 101
Fig. 3.4 -
Disc Spring washers. a) Geometric features of a Disc Spring washer; b) Experimental behaviour of a disc
spring washer……… 102 Fig. 3.5 - Examples of tightening sessions………. 105 Fig. 3.6 - Summary of the tightening tests………. 108
Fig. 3.7 -
Regression curves of short term relaxation tests (Flat washers) normalised with respect to the loss occurred
in fixed time instants a) 1h; b) 6h; c) 12h; d) 18h………. 116 Fig. 3.8 - Regression curves of short term relaxation tests (Disc 118
Pseudo dynamic tests and numerical analysis of free from damage multistorey steel buildings with innovative connections
Springs) normalised with respect to the loss occurred in fixed time instants a) 1h; b) 6h; c) 12h; d) 18h……….
Fig. 3.9 - Medium-term relaxation tests results………... 120
Fig. 4.1 - Design values of the friction coefficient (static or dynamic)……….. 134
Fig. 4.2 - FREEDAM joint configurations: a) horizontal friction device; b) vertical friction device ……… 136
Fig. 4.3 - Lever arm of friction joints: a) configuration n.1; b) configuration n.2 ………. 139
Fig. 4.4 - Distance between the axis of the beam plastic hinge and the column flange: a) configuration n.1; b) configuration n.2….………. 141
Fig. 4.5 - FREEDAM-CYC01 joint configuration………. 145
Fig. 4.6 - Geometry of the specimen FREEDAM-CYC01……… 157
Fig. 4.7 - FREEDAM-CYC02 joint configuration ………. 158
Fig. 4.8 - Rigid deformation of the FREEDAM-CYC02 joint ……… 160
Fig. 4.9 - Internal joint configuration (HE220M / IPE270 - Horizontal pads)………. 171
Fig. 4.10 - Internal joint configuration (HE500B / IPE450 – Horizontal pads)……… 172
Fig. 4.11 - Internal joint configuration (HE220M / IPE270 - Vertical pads)..……….. 172
Fig. 4.12 - Internal joint configuration (HE500B / IPE450 - Vertical pads)………. 173
Fig. 4.13 - Test layout for internal joints HE220M-IPE270…..…….. 173
Fig. 4.14 - Test layout for internal joints HE500B-IPE450…………. 174
Fig. 4.15 - Static scheme for the calculation of the constraint reactions in the test layout ……….………. 175
Fig. 4.16 - Loading protocol according to AISC 341/2010 [2]……… 176
Pseudo dynamic tests and numerical analysis of free from damage multistorey steel buildings with innovative connections
Fig. 4.18 - Sensors’ layout ………. 179 Fig. 4.19 - Sensors’ layout scheme....………..………. 180 Fig. 4.20 - Sensors’ layout ………. 180 Fig. 4.21 - Geometric characteristics of the coupon to be tested…. 181
Fig. 4.22 -
Stress-strain curves of the coupon tests from S355
steel plates……….. 182
Fig. 4.23 -
Stress-strain curves of the coupon tests from HE220M
and HE500BM profile………. 183
Fig. 4.24 -
Stress-strain curves of the coupon tests from IPE270 –
S355 steel……… 183
Fig. 4.25 -
Stress-strain curves of the coupon tests from IPE450 –
S355 steel……… 184
Fig. 4.26 - Setup of the test ………... 185 Fig. 4.27 - Setup of the test……… 185
Fig. 4.28 -
Moment evaluated at the column’s face vs chord
rotation – Left side of the joint ……… 186
Fig. 4.29 -
Moment evaluated at the column’s face vs chord
rotation – Right side of the joint ………….……… 186
Fig. 4.30 -
Force at level of the actuator vs displacement at level of
the friction damper – Left...………...……… 188
Fig. 4.31 -
Force at level of the actuator vs displacement at level of
the friction damper – Right….……….. 188 Fig. 4.32 - Bolt preload vs Time - Left side……… 190 Fig. 4.33 - Bolt preload vs Time - Right side……… 190
Fig. 4.34 -
Force vs Relative displacement between L-stub and
column - Left side………. 191
Fig. 4.35 -
Force vs Relative displacement between L-stub and
column - Right side………. 191
Fig. 4.36 -
Force vs Relative displacement between T-stub and
Pseudo dynamic tests and numerical analysis of free from damage multistorey steel buildings with innovative connections
Fig. 4.37 -
Force vs Relative displacement between T-stub and
beam - Right side……….…… 192
Fig. 4.38 -
Force vs Relative displacement between Haunch and
Beam - Left side………..……….…… 193
Fig. 4.39 -
Force vs Relative displacement between Haunch and
Beam - Right side………..….. 193
Fig. 4.40 -
Force vs Vertical Displacement at the beam end - Left
side……… 194
Fig. 4.41 -
Force vs Vertical Displacement at the beam end - Right
side..………. 194
Fig. 4.42 - Setup of the test ………... 196 Fig. 4.43 - Setup of the test……….. 196
Fig. 4.44 -
Moment evaluated at the column’s face vs chord
rotation – Left side of the joint ……… 197
Fig. 4.45 -
Moment evaluated at the column’s face vs chord
rotation – Right side of the joint ………. 197
Fig. 4.46 -
Force at level of the actuator vs displacement at level of
the friction damper – Left...………... 198
Fig. 4.47 -
Force at level of the actuator vs displacement at level of
the friction damper – Right….……….…. 198 Fig. 4.48 - Bolt preload vs Time - Left side……… 199 Fig. 4.49 - Bolt preload vs Time - Right side……… 199
Fig. 4.50 -
Force vs Relative displacement between L-stub and
column - Left side……….……… 200
Fig. 4.51 -
Force vs Relative displacement between L-stub and
column - Right side………. 200
Fig. 4.52 -
Force vs Relative displacement between T-stub and
Pseudo dynamic tests and numerical analysis of free from damage multistorey steel buildings with innovative connections
Fig. 4.53 -
Force vs Relative displacement between T-stub and
beam - Right side……….……… 201
Fig. 4.54 -
Force vs Relative displacement between Haunch and
Beam - Left side………..……… 202
Fig. 4.55 -
Force vs Relative displacement between Haunch and
Beam - Right side………..………….…. 202
Fig. 4.56 -
Force vs Vertical Displacement at the beam end - Left
side…..………. 203
Fig. 4.57 -
Force vs Vertical Displacement at the beam end - Right
side..………. 203
Fig. 4.58 - Setup of the test ………..………... 205 Fig. 4.59 - Setup of the test………..………. 205
Fig. 4.60 -
Moment evaluated at the column’s face vs chord
rotation – Left side of the joint ……… 206
Fig. 4.61 -
Moment evaluated at the column’s face vs chord
rotation – Right side of the joint ……….… 206
Fig. 4.62 -
Force at level of the actuator vs displacement at level of
the friction damper – Left...………...…………... 207
Fig. 4.63-
Force at level of the actuator vs displacement at level of
the friction damper – Right….………..……… 207 Fig. 4.64 - Bolt preload vs Time - Left side……… 208 Fig. 4.65 - Bolt preload vs Time - Right side……… 208
Fig. 4.66 -
Force vs Relative displacement between L-stub and
column - Left side………. 209
Fig. 4.67 -
Force vs Relative displacement between L-stub and
column - Right side………. 209
Fig. 4.68 -
Force vs Relative displacement between T-stub and
beam - Left side………. 210
Fig. 4.69 -
Force vs Relative displacement between T-stub and
Pseudo dynamic tests and numerical analysis of free from damage multistorey steel buildings with innovative connections
Fig. 4.70 -
Force vs Relative displacement between Haunch and
Beam - Left side……… 211
Fig. 4.71 -
Force vs Relative displacement between Haunch and
Beam - Right side……… 211
Fig. 4.72 -
Force vs Vertical Displacement at the beam end - Left
side…..………. 212
Fig. 4.73 -
Force vs Vertical Displacement at the beam end - Right
side..………. 212
Fig. 4.74 - Setup of the test ………... 214 Fig. 4.75 - Setup of the test……… 214
Fig. 4.76 -
Moment evaluated at the column’s face vs chord
rotation – Left side of the joint ……… 215
Fig. 4.77 -
Moment evaluated at the column’s face vs chord
rotation – Right side of the joint ………. 215
Fig. 4.78 -
Force at level of the actuator vs displacement at level of
the friction damper – Left... ……….. 216
Fig. 4.79-
Force at level of the actuator vs displacement at level of
the friction damper – Right….…………..……… 216 Fig. 4.80 - Bolt preload vs Time - Left side……… 217 Fig. 4.81 - Bolt preload vs Time - Right side……… 217
Fig. 4.82 -
Force vs Relative displacement between L-stub and
column - Left side………. 218
Fig. 4.83 -
Force vs Relative displacement between L-stub and
column - Right side………. 218
Fig. 4.84 -
Force vs Relative displacement between T-stub and
beam - Left side………. 219
Fig. 4.85 -
Force vs Relative displacement between T-stub and
beam - Right side……….……… 219
Fig. 4.86 -
Force vs Relative displacement between Haunch and
Pseudo dynamic tests and numerical analysis of free from damage multistorey steel buildings with innovative connections
Fig. 4.87 -
Force vs Relative displacement between Haunch and
Beam - Right side………..……….. 220
Fig. 4.88 -
Force vs Vertical Displacement at the beam end - Left
side…..………. 221
Fig. 4.89 -
Force vs Vertical Displacement at the beam end - Right
side..………. 221
Fig. 4.90 -
FREEDAM connection with horizontal friction
pads…….…..……….. 222
Fig. 4.91 -
FREEDAM connection with vertical friction
pads……….. 223
Fig. 4.92 -
FE model of the Internal joint equipped with
FREEDAM connection……… 223
Fig. 4.93 - FE model - mesh……….. 224
Fig. 4.94 - FE model – bolts……… 224
Fig. 4.95 -
Test layout for internal joints with HE220M column
and IPE270 beams………... 225 Fig. 4.96 - Specimen during the test……….. 226 Fig. 4.97 - Boundary conditions for the FE model………. 226 Fig. 4.98 - Loading protocol according to AISC 341/2010 [2]……… 227
Fig. 4.99 -
Static scheme for the evaluation of the bending
moment……… 228
Fig. 4.100 - Plastic deformation in the connection……….. 230 Fig. 4.101 - Plastic deformation for the beam and the bolts…………. 230
Fig. 4.102 -
Schemes of the forces on the part of the connection
during the test……….. 230 Fig. 4.103 - Stresses in the nodal area………. 231
Fig. 4.104 -
Comparison between experimental results and FE
model (Actuator)……… 231
Fig. 4.105 -
Comparison between experimental results and FE
Pseudo dynamic tests and numerical analysis of free from damage multistorey steel buildings with innovative connections
Fig. 4.106 - FE model – vertical configuration……… 232
Fig. 4.107 - Plastic deformation in the connection……….. 233
Fig. 4.108 - Plastic deformation for the beam and the bolts…………. 233
Fig. 4.109 - Stresses in the nodal area………. 233
Fig. 4.110 - Comparison between experimental results and FE model (Actuator)……… 234
Fig. 4.111 - Comparison between experimental results and FE model (Damper-Right side)……… 234
Fig. 5.1 - Scheme of the numerical-experimental procedure for a pseudo-dynamic test……….. 245
Fig. 5.2 - Longitudinal section of the frame…...………... 252
Fig. 5.3 - Floor scheme…….………. 252
Fig. 5.4 - Mechanism type 1……… 255
Fig. 5.5 - Mechanism type 2……… 255
Fig. 5.6 - Mechanism type 3……… 255
Fig. 5.7 - Global mechanism……… 255
Fig. 5.8 - Rigid movement of structural elements ……….. 256
Fig. 5.9 - Global mechanism…….………. 258
Fig. 5.10 - Two floors two spans frame…..……… 259
Fig. 5.11 - Equilibrium curves for the different mechanisms………. 263
Fig. 5.12 - Two floors, single span frame with distributed and concentrated force……… 268
Fig. 5.13 - Index of mechanism 1 - Mechanism type-1……… 268
Fig. 5.14 - Index of mechanism 2 - Mechanism type-1……… 269
Fig. 5.15 - Index of mechanism 1 - Mechanism type-2 (Coincident with global mechanism)………. 270
Fig. 5.16 - Index of mechanism 2 - Mechanism type-2……… 270
Fig. 5.17 - Index of mechanism 1 - Mechanism type-3……… 271
Fig. 5.18 - Index of mechanism 2 - Mechanism type-3……… 272 Fig. 5.19 - Scheme of the beam for the evaluation of the axial 277
Pseudo dynamic tests and numerical analysis of free from damage multistorey steel buildings with innovative connections
forces in the columns……….………
Fig. 5.20 -
Static scheme that assure that the plastic hinges
develop at the beam ends…………..……… 280
Fig. 5.21 - Spectrum according to Eurocode 8 [1]……….. 289
Fig. 5.22 - Behaviour factors according to Eurocode 8 [1]………….. 290
Fig. 5.23 - Scheme for the accidental eccentricity………. 291
Fig. 5.24 - Bending moment for the check of the beams ……… 292
Fig. 5.25 - Bending moment for the check of the columns ………… 293
Fig. 5.26 - Benchmark case: Beam-to-Column Connection with RBS……… 297
Fig. 5.27 - Design parameters for RBS connections ………. 297
Fig. 5.28 - Cyclic behaviour of the beam-to-column joint with RBS tested in Iannone et al., (2008) [2].……… 301
Fig. 5.29 - Lever arm scheme.……….. 302
Fig. 5.30 - Geometrical parameters ….………... 303
Fig. 5.31 - Geometrical parameters –T-stub………. 306
Fig. 5.32 - T-stub flange……….. 307
Fig. 5.33 - T-stub web……….. 308
Fig. 5.34 - Haunch……… 309
Fig. 5.35 - L-stubs………. 311
Fig. 5.36 - Coalinga accelerogram……… 315
Fig. 5.37 - Helena accelerogram………... 315
Fig. 5.38 - Imperial Valley accelerogram……… 316
Fig. 5.39 - Kobe accelerogram……….. 316
Fig. 5.40 - Landers accelerogram………. 317
Fig. 5.41 - Northridge accelerogram……… 317
Fig. 5.42 - Santa Barbara accelerogram……… 318
Fig. 5.43 - Spitak accelerogram……… 318
Fig. 5.44 - Elastic spectrum……….. 320
Pseudo dynamic tests and numerical analysis of free from damage multistorey steel buildings with innovative connections
Fig. 5.46 - Set of accelerograms……… 321 Fig. 5.47 - Mean spectrum for the set of accelerograms……….. 322 Fig. 5.48 - Hysteresis loops for Steel S355……… 323 Fig. 5.49 - Seismostruct model………. 323 Fig. 5.50 - Structural scheme of the model……….. 324 Fig. 5.51 - Plasticity model………. 325 Fig. 5.52 - Hysteresis curve for the FREEDAM connection…………. 325
Fig. 5.53 -
Hysteretic curves - FREEDAM connection - Maximum
friction……….. 328
Fig. 5.54 -
Hysteretic curves - FREEDAM connection – minimum
friction……….. 329 Fig. 5.55 - Hysteretic curves - FREEDAM connection……….. 329 Fig. 5.56 - Seismostruct model………. 330
Fig. 5.57 - Test layout……….. 331
Fig. 5.58 - Deformability of beam and column……… 332 Fig. 5.59 - Hysteretic curves – RBS connection………. 333
Fig. 5.60 -
Load distribution on the frame for the pushover
analysis……… 336
Fig. 5.61 - Pushover analysis - FREEDAM - Maximum friction…… 337 Fig. 5.62 - Pushover analysis - FREEDAM - Minimum friction……. 337 Fig. 5.63 - Pushover analysis – RBS……… 338
Fig. 5.64 -
Base shear vs Displacement at the top – COALINGA
Max friction……… 341 Fig. 5.65 - Displacement vs rotation – COALINGA Max friction…… 341 Fig. 5.66 - Compression vs rotation – COALINGA Max friction……. 342 Fig. 5.67 - Tension vs rotation – COALINGA Max friction……… 342
Fig. 5.68 -
Base shear vs Displacement at the top – COALINGA
min friction………. 343 Fig. 5.69 - Displacement vs rotation – COALINGA min friction……. 344 Fig. 5.70 - Compression vs rotation – COALINGA min friction……. 344
Pseudo dynamic tests and numerical analysis of free from damage multistorey steel buildings with innovative connections
Fig. 5.71 - Tension vs rotation – COALINGA min friction……… 345
Fig. 5.72 -
Base shear vs displacement at the top – COALINGA
RBS……… 346
Fig. 5.73 - Displacement vs rotation – COALINGA RBS………... 346 Fig. 5.74 - Compression vs rotation – COALINGA RBS……… 347 Fig. 5.75 - Tension vs rotation – COALINGA RBS……….. 347
Fig. 5.76 -
Base shear vs Displacement at the top – HELENA Max
friction……….. 349 Fig. 5.77 - Displacement vs rotation – HELENA Max friction………. 349 Fig. 5.78 - Compression vs rotation – HELENA Max friction………. 350 Fig. 5.79 - Tension vs rotation – HELENA Max friction……… 350
Fig. 5.80 -
Base shear vs Displacement at the top – HELENA min
friction……….. 352 Fig. 5.81 - Displacement vs rotation – HELENA min friction………. 352 Fig. 5.82 - Compression vs rotation – HELENA min friction………. 353 Fig. 5.83 - Tension vs rotation – HELENA min friction………. 353 Fig. 5.84 - Base shear vs displacement at the top – HELENA RBS.. 355 Fig. 5.85 - Displacement vs rotation – HELENA RBS……… 355 Fig. 5.86 - Compression vs rotation – HELENA RBS………. 356 Fig. 5.87 - Tension vs rotation – HELENA RBS……….. 356
Fig. 5.88 -
Base shear vs Displacement at the top – IMPERIAL
VALLEY Max friction……… 358
Fig. 5.89 -
Displacement vs rotation – IMPERIAL VALLEY Max
friction……….. 358
Fig. 5.90 -
Compression vs rotation – IMPERIAL VALLEY Max
friction……….. 359 Fig. 5.91 - Tension vs rotation – IMPERIAL VALLEY Max friction… 359
Fig. 5.92 -
Base shear vs Displacement at the top – IMPERIAL
VALLEY min friction……… 361 Fig. 5.93 - Displacement vs rotation – IMPERIAL VALLEY min 361
Pseudo dynamic tests and numerical analysis of free from damage multistorey steel buildings with innovative connections
friction………..
Fig. 5.94 -
Compression vs rotation – IMPERIAL VALLEY min
friction……….. 362 Fig. 5.95 - Tension vs rotation – IMPERIAL VALLEY min friction…. 362
Fig. 5.96 -
Base shear vs displacement at the top – IMPERIAL
VALLEY RBS……….. 364
Fig. 5.97 - Displacement vs rotation – IMPERIAL VALLEY RBS…… 364 Fig. 5.98 - Compression vs rotation – IMPERIAL VALLEY RBS……. 365 Fig. 5.99 - Tension vs rotation – IMPERIAL VALLEY RBS…………... 365
Fig. 5.100 -
Base shear vs Displacement at the top – KOBE Max
friction……….. 367 Fig. 5.101 - Displacement vs rotation – KOBE Max friction…………. 367 Fig. 5.102 - Compression vs rotation – KOBE Max friction…………. 368 Fig. 5.103 - Tension vs rotation – KOBE Max friction………. 368
Fig. 5.104 -
Base shear vs Displacement at the top – KOBE min
friction……….. 370 Fig. 5.105 - Displacement vs rotation – KOBE min friction………….. 370 Fig. 5.106 - Compression vs rotation – KOBE min friction……… 371 Fig. 5.107 - Tension vs rotation – KOBE min friction………. 371 Fig. 5.108 - Base shear vs displacement at the top – KOBE RBS…... 373 Fig. 5.109 - Displacement vs rotation – KOBE RBS………. 373 Fig. 5.110 - Compression vs rotation – KOBE RBS……….. 374 Fig. 5.111 - Tension vs rotation – KOBE RBS……… 374
Fig. 5.112 -
Base shear vs Displacement at the top – LANDERS
Max friction……… 376 Fig. 5.113- Displacement vs rotation – LANDERS Max friction……. 376 Fig. 5.114 - Compression vs rotation – LANDERS Max friction……... 377 Fig. 5.115 - Tension vs rotation – LANDERS Max friction………. 377
Fig. 5.116 -
Base shear vs Displacement at the top – LANDERS min
Pseudo dynamic tests and numerical analysis of free from damage multistorey steel buildings with innovative connections
Fig. 5.117 - Displacement vs rotation – LANDERS min friction…….. 379 Fig. 5.118 - Compression vs rotation – LANDERS min friction……… 380 Fig. 5.119 - Tension vs rotation – LANDERS min friction………. 380 Fig. 5.120 - Base shear vs displacement at the top – LANDERS RBS 382 Fig. 5.121 - Displacement vs rotation – LANDERS RBS………. 382 Fig. 5.122 - Compression vs rotation – LANDERS RBS……….. 383 Fig. 5.123 - Tension vs rotation – LANDERS RBS……… 383
Fig. 5.124 -
Base shear vs Displacement at the top – NORTHRIDGE
Max friction……… 385 Fig. 5.125- Displacement vs rotation – NORTHRIDGE Max friction. 385 Fig. 5.126 - Compression vs rotation – NORTHRIDGE Max friction.. 386 Fig. 5.127 - Tension vs rotation – NORTHRIDGE Max friction………. 386
Fig. 5.128 -
Base shear vs Displacement at the top – NORTHRIDGE
min friction………. 388 Fig. 5.129 - Displacement vs rotation – NORTHRIDGE min friction.. 388 Fig. 5.130 - Compression vs rotation – NORTHRIDGE min friction… 389 Fig. 5.131 - Tension vs rotation – NORTHRIDGE min friction………. 389
Fig. 5.132 -
Base shear vs displacement at the top – NORTHRIDGE
RBS……… 391
Fig. 5.133 - Displacement vs rotation – NORTHRIDGE RBS………… 391 Fig. 5.134 - Compression vs rotation – NORTHRIDGE RBS…………. 392 Fig. 5.135 - Tension vs rotation – NORTHRIDGE RBS……… 392
Fig. 5.136 -
Base shear vs Displacement at the top – SANTA
BARBARA Max friction……… 394
Fig. 5.137-
Displacement vs rotation – SANTA BARBARA Max
friction……….. 394
Fig. 5.138 -
Compression vs rotation – SANTA BARBARA Max
friction……….. 395 Fig. 5.139 - Tension vs rotation – SANTA BARBARA Max friction…. 395 Fig. 5.140 - Base shear vs Displacement at the top – SANTA 397
Pseudo dynamic tests and numerical analysis of free from damage multistorey steel buildings with innovative connections
BARBARA min friction………
Fig. 5.141 -
Displacement vs rotation – SANTA BARBARA min
friction……….. 397
Fig. 5.142 -
Compression vs rotation – SANTA BARBARA min
friction……….. 398 Fig. 5.143 - Tension vs rotation – SANTA BARBARA min friction…. 398
Fig. 5.144 -
Base shear vs displacement at the top – SANTA
BARBARA RBS……….. 400
Fig. 5.145 - Displacement vs rotation – SANTA BARBARA RBS…….. 400 Fig. 5.146 - Compression vs rotation – SANTA BARBARA RBS……... 401 Fig. 5.147 - Tension vs rotation – SANTA BARBARA RBS………. 401
Fig. 5.148 -
Base shear vs Displacement at the top – SPITAK Max
friction……….. 403 Fig. 5.149- Displacement vs rotation – SPITAK Max friction………... 403 Fig. 5.150 - Compression vs rotation – SPITAK Max friction………… 404 Fig. 5.151 - Tension vs rotation – SPITAK Max friction………. 404
Fig. 5.152 -
Base shear vs Displacement at the top – SPITAK min
friction……….. 406 Fig. 5.153 - Displacement vs rotation – SPITAK min friction………… 406 Fig. 5.154 - Compression vs rotation – SPITAK min friction…………. 407 Fig. 5.155 - Tension vs rotation – SPITAK min friction………... 407 Fig. 5.156 - Base shear vs displacement at the top – SPITAK RBS…. 409 Fig. 5.157 - Displacement vs rotation – SPITAK RBS……….. 409 Fig. 5.158 - Compression vs rotation – SPITAK RBS……… 410 Fig. 5.159 - Tension vs rotation – SPITAK RBS………. 410
Fig. 5.160 -
Consequences of the use of link elements for modelling
FREEDAM connections on pushover curves……….. 411 Fig. 5.161 - Base shear vs displacement – FREEDAM Max. friction.. 412 Fig. 5.162 - Base shear vs displacement – FREEDAM min friction… 413 Fig. 5.163 - Base shear vs displacement – RBS………. 413
Pseudo dynamic tests and numerical analysis of free from damage multistorey steel buildings with innovative connections
Fig. 5.164 - Displacement vs rotation – FREEDAM min friction……. 414 Fig. 5.165 - Compression vs rotation – FREEDAM min friction……. 414 Fig. 5.166 - Tension vs rotation – FREEDAM min friction………. 415 Fig. 5.167 - Deformation vs Time curve and Stress vs strain curve.. 419 Fig. 5.168 - Rainflow scheme……….. 420 Fig. 5.169 - Spectral acceleration vs time – COALINGA………. 423 Fig. 5.170 - Spectral acceleration vs time – IMPERIAL VALLEY…….. 424 Fig. 5.171 - Spectral acceleration vs time – LANDERS……… 425 Fig. 5.172 - Spectral acceleration vs time – SPITAK………. 426
Fig. 5.173 - Column bases……… 429
Fig. 5.174 - Columns and beams……… 429
Fig. 5.175 - Complete structure……….. 429 Fig. 5.176 - Experimental test set-up……… 430
Fig. 5.177 -
a) LVDT and wire transducers; b) MTS Temposonic
transducer……….. 431 Fig. 5.178 - Transducers layout at the 1st and 2nd level………. 432 Fig. 5.179 - Displacement transducers on frames……… 433 Fig. 5.180 - Stain gauges on frames……….. 435 Fig. 5.181 - Structural elements before damage……… 437 Fig. 5.182 - Structural elements after damage……….. 437 Fig. 5.183 - Collapse of the slab………. 437 Fig. 5.184 - Displacement of the column base……….. 438 Fig. 5.185 - Displacement of the steel braced……… 438 Fig. 5.186 - Interruption point of the accelerogram………. 438 Fig. 5.187 - Displacement vs Time 1st level………. 439 Fig. 5.188 - Displacement vs Time 2nd level……… 440 Fig. 5.189 - Force vs Time 1st level………. 440 Fig. 5.190 - Force vs Time 2nd level……… 441 Fig. 5.191 - Transducers layout……….. 442
Pseudo dynamic tests and numerical analysis of free from damage multistorey steel buildings with innovative connections
Fig. 5.193 - Moment vs rotation - Beam 1A - RBS 1……… 445 Fig. 5.194 - Energy vs time - Beam 1A – RBS……….. 446 Fig. 5.195 - Moment vs rotation - Beam 1B - RBS 1……… 446 Fig. 5.196 - Energy vs time - Beam 1B- RBS……… 447 Fig. 5.197 - Moment vs rotation - Beam 2A - RBS 1……… 447 Fig. 5.198 - Energy vs time - Beam 2A- RBS………... 448 Fig. 5.199 - Moment vs rotation - Beam 2B - RBS 1……… 448 Fig. 5.200 - Energy vs time - Beam 2B – RBS……….. 449 Fig. 5.201 - Beams hysteretic curves - RBS 1……… 449 Fig. 5.202 - Columns hysteretic curves - RBS 1……… 450 Fig. 5.203 - Overall dissipated energy - RBS 1……….. 450 Fig. 5.204 - Moment vs rotation - Beam 1A - RBS 2……… 452 Fig. 5.205 - Energy vs time - Beam 1A - RBS 2………. 453 Fig. 5.206 - Moment vs rotation - Beam 1B - RBS 2……… 453 Fig. 5.207 - Energy vs time - Beam 1B - RBS 2……… 454 Fig. 5.208 - Moment vs rotation - Beam 2A - RBS 2……… 454 Fig. 5.209 - Energy vs time - Beam 2A - RBS 2………. 455 Fig. 5.210 - Moment vs rotation - Beam 2B - RBS 2………... 455 Fig. 5.211 - Energy vs time - Beam 2B - RBS 2……… 456 Fig. 5.212 - Beams hysteretic curves - RBS 2……… 456 Fig. 5.213 - Columns hysteretic curves - RBS 2……… 457 Fig. 5.214 - Overall dissipated energy - RBS 2……….. 457 Fig. 5.215 - Position of the displacment trasducers – FREEDAM…… 458 Fig. 5.216 - Moment vs rotation – Beam 1A- FREEDAM……… 459 Fig. 5.217 - Energy vs time – Bema 1A – FREEDAM……… 459 Fig. 5.218 - Moment vs rotation – Beam 1B – FREEDAM……….. 460 Fig. 5.219 - Energy vs time – Bema 1B – FREEDAM………... 460 Fig. 5.220 - Moment vs rotation – Beam 2A – FREEDAM……….. 460 Fig. 5.221 - Energy vs time – Bema 2A – FREEDAM……… 461 Fig. 5.222 - Moment vs rotation – Beam 2B – FREEDAM………. 461
Pseudo dynamic tests and numerical analysis of free from damage multistorey steel buildings with innovative connections
Fig. 5.223 - Energy vs time – Bema 2B – FREEDAM………... 461 Fig. 5.224 - Total energy dissipated by FREEDAM connections…….. 462 Fig. 5.225 - Total energy dissipated by FREEDAM connections…….. 462 Fig. 5.226 - Total dissipated energy……….………. 463
Pseudo dynamic tests and numerical analysis of free from damage multistorey steel buildings with innovative connections
Tab. 1.1 - Joint classification………..…… 12
Tab. 1.2 -
Classification of structures with reference to their ductility
supply ……….... 13
Tab. 1.3 - Connection required ductility…..………... 14 Tab. 2.1 - Summary of the tests – 1st phase ….…….…………..………….... 42
Tab. 2.2 -
Summary of the tests – 2nd phase (The round brackets represent the disc springs configuration, n° of parallel or
series)……… 81
Tab. 3.1 - Tightening tests’ list ………... 104 Tab. 3.2 - Tightening tests – Summary of statistical results………. 110 Tab. 3.3 - Short term relaxation tests list …...……….………. 111 Tab. 3.4 - Short term relaxation tests result (Flat washers)……….. 114 Tab. 3.5 - Short term relaxation tests result (Disc Springs)……….. 119 Tab. 3.6 - Medium term relaxation tests results.………..………..…. 121 Tab. 4.1 - Static friction coefficients for every tests………. 132 Tab. 4.2 - Design values of the friction coefficients ………. 134 Tab. 4.3 - Values of the overstrength factor 𝛾𝑜𝑣………. 135
Pseudo dynamic tests and numerical analysis of free from damage multistorey steel buildings with innovative connections
Tab. 4.4 - Geometric data, pendulum reactions, moment in the joint... 176 Tab. 4.5 - Preload values for the bolts of the FREEDAM devices…………. 177 Tab. 5.1 - Loads applied to the frame ………….………. 249 Tab. 5.2 - Loads applied to the multi-span structure………..…… 249 Tab. 5.3 - Total loads applied to the frame……….. 253 Tab. 5.4 - Parameters ξ, λ, ζ calculated or each mechanism………. 273 Tab. 5.5 - Parameters Δ𝑖𝑚(𝑡) calculated or each mechanism……….. 273 Tab. 5.6 - Parameters α calculated or each mechanism ……… 274 Tab. 5.7 - Parameters ρ𝑖𝑚 calculated or each mechanism ………. 274 Tab. 5.8 - Parameters ρ𝑖𝑚 calculated or each analysis type ……….. 275 Tab. 5.9 - Checks of the ρ𝑖𝑚 parameter ……… 275 Tab. 5.10 - Kinematic multipliers …..………. 275 Tab. 5.11 - Minimum values of the kinematic multipliers ……….. 276 Tab. 5.12 - Checks of the kinematic multipliers ………. 276 Tab. 5.13 - Columns checks……… 278 Tab. 5.14 - Parameters 𝛾𝑖𝑚
(𝑡) (vibration mode)………..……….. 284 Tab. 5.15 - Parameters 𝛾𝑖𝑚
(𝑡) (masses)……… 284 Tab. 5.16 - Axial load of the columns………. 286 Tab. 5.17 - Design of the columns sections………. 286 Tab. 5.18 - Plastic moments of the columns………. 288 Tab. 5.19 - Check of the column sections……….. 289 Tab. 5.20 - Base shear……….. 291 Tab. 5.21 - Floor forces………. 291 Tab. 5.22 - Loads applied to the frame……… 294 Tab. 5.23 - Second order effects……… 295
Tab. 5.24 - Drift
limits………. 296 Tab. 5.25 - Checks of the drift……… 296 Tab. 5.26 - Loads applied to the frame……… 314 Tab. 5.27 - FREEDAM link properties………. 327
Pseudo dynamic tests and numerical analysis of free from damage multistorey steel buildings with innovative connections
Tab. 5.28 -
Adopted values for the prediction of the bilinear hysteretic curves……… 328 Tab. 5.29 - Natural vibration periods……….. 334 Tab. 5.30 - Scale factors of the accelerograms………... 335 Tab. 5.31 - Capacities of the actuators……… 339 Tab. 5.32 - FREEDAM - Maximum friction coefficient –COALINGA……….. 340 Tab. 5.33 - FREEDAM - Minimum friction coefficient – COALINGA……….. 343 Tab. 5.34 - RBS – COALINGA………. 345 Tab. 5.35 - FREEDAM - Maximum friction coefficient – HELENA…………. 348 Tab. 5.36 - FREEDAM - Minimum friction coefficient – HELENA………….. 351 Tab. 5.37 - RBS – HELENA……….. 354 Tab. 5.38 -
FREEDAM - Maximum friction coefficient – IMPERIAL VALLEY……… 357
Tab. 5.39 -
FREEDAM - Minimum friction coefficient – IMPERIAL VALLEY……… 360 Tab. 5.40 - RBS – IMPERIAL VALLEY……….. 363 Tab. 5.41 - FREEDAM - Maximum friction coefficient – KOBE……….. 366 Tab. 5.42 - FREEDAM - Minimum friction coefficient – KOBE……… 369 Tab. 5.43 - RBS – KOBE………... 372 Tab. 5.44 - FREEDAM - Maximum friction coefficient – LANDERS……….. 375 Tab. 5.45 - FREEDAM - Minimum friction coefficient –LANDERS…………. 378 Tab. 5.46 - RBS – LANDERS……… 381 Tab. 5.47 - FREEDAM - Maximum friction coefficient – NORTHRIDGE….. 384 Tab. 5.48 - FREEDAM - Minimum friction coefficient NORTHRIDGE…….. 387 Tab. 5.49 - RBS – NORTHRIDGE……….. 390 Tab. 5.50 - FREEDAM - Maximum friction coefficient – SANTA BARBARA 393
Tab. 5.51 -
FREEDAM - Minimum friction coefficient - SANTA
BARBARA……… 396
Tab. 5.52 - RBS – SANTA BARBARA……… 399 Tab. 5.53 - FREEDAM - Maximum friction coefficient – SPITAK……… 402
Pseudo dynamic tests and numerical analysis of free from damage multistorey steel buildings with innovative connections
Tab. 5.54 - FREEDAM - Minimum friction coefficient – SPITAK………. 405
Tab. 5.55 - RBS – SPITAK……… 408
Tab. 5.56 - FREEDAM Maximum friction – summary……… 417 Tab. 5.57 - FREEDAM Minimum friction – summary………. 417
Tab. 5.58 - RBS – summary……… 418
Tab. 5.59 - FREEDAM Maximum friction – Results……… 421 Tab. 5.60 - FREEDAM Minimum friction – Results………. 422
Tab. 5.61 - RBS – Results……… 422
Tab. 5.62 - COALINGA – details (A)……….. 423 Tab. 5.63 - COALINGA – details (B)……….. 423 Tab. 5.64 - IMPERIAL VALLEY – details (A)……… 424 Tab. 5.65 - IMPERIAL VALLEY – details (B)………... 424 Tab. 5.66 - LANDERS – details (A)………. 425 Tab. 5.67 - LANDERS – details (B)……… 425 Tab. 5.68 - SPITAK – details (A)………. 426 Tab. 5.69 - SPITAK – details (B)………. 426 Tab. 5.70 - Pseudo-dynamic test RBS 1………. 445 Tab. 5.71 - Pseudo-dynamic test RBS 2………. 452
Pseudo dynamic tests and numerical analysis of free from damage multistorey steel buildings with innovative connections
ABSTRACT
One of the most widespread structural systems is represented by Moment Resisting Frames (MRFs). This structural system is made up of frames capable of resisting seismic actions through predominantly flexural tension states. The stiffness and lateral resistance of the system depend on the flexural strength of the members and the type of connection, while the development of the plastic hinges guarantee the dissipation of the seismic input energy. The location of the dissipative zones varies according to the design approach adopted, typically they develop in beams, columns and connections. The most widespread design philosophy is to have strong columns, weak beams and full-strength rigid connections with complete resistance restoration, in this way all the seismic energy tends to be dissipated by the plastic hinges at the ends of the beams and at the base of the columns of the first level.
In order to overcome the traditional design approach, the present research work introduces a new type of beam-column connection capable of exhibiting a remarkable rigidity in service conditions (SLE) and able to exhibit a remarkable dissipative capacity when a rare seismic event occurs. The codes currently in force provide that for seismic events characterized by a period of return comparable with the useful life of the construction (frequent or occasional events) the structures remain in the elastic field ensuring that the seismic energy is completely dissipated through viscous damping. Vice versa, the seismic energy must be dissipated through plastic engagement of parts of the
Pseudo dynamic tests and numerical analysis of free from damage multistorey steel buildings with innovative connections
structure, with wide and stable hysteresis cycles, for rare and very rare seismic events with a return period of about 500 years. The development of the hysteresis involves structural damage that have to be such as not to lead to the collapse of the structure in order to guarantee the protection of the life of those who occupy the building. The prediction of the behaviour of the structure in non-linear field for rare seismic events represents an aspect that only experimental research can describe in depth by developing new analytical models and innovative design philosophies. The execution of quasi-static tests can provide useful information in order to investigate the nonlinear behaviour of the members and the assemblages even if the forces or the displacement histories applied during the tests do not correspond exactly to the actions that occur during a real seismic event. The information obtained through these test procedures is however useful for calibrating analytical models and comparing the behaviour of structural components. The execution of tests on real scale structures is the best way to investigate the global behaviour of a structural system. For a more complete knowledge about the response in the dynamic field, the pseudo-dynamic tests represent a test protocol able to provide information of the structural response of a component or of a structure in a dynamic field through a static test.
The main purpose of this work, developed within the FREEDAM research project financed by the European Community, is to develop an innovative beam-column connection. These innovative connections are equipped with an additional damper able to dissipate the energy deriving from destructive seismic events.
Pseudo dynamic tests and numerical analysis of free from damage multistorey steel buildings with innovative connections
The FREEDAM beam-column connection, through an appropriate design of the various components, is able to withstand frequent earthquakes and rare events without causing damage to the structural elements.
The thesis is divided into six chapters.
The Chapter 1 reports a brief introduction to the traditional beam-column connections, specifying the characteristics of the different types of connections and their influence on the behaviour of the Moment Resisting Frames. In the last part of the chapter the FREEDAM dissipative connection is presented, specifying its peculiarities and the benefits that its introduction into the structural system brings. The Chapter 2 is devoted to the description of the results obtained from an extensive experimental campaign developed at the STRENGTH laboratory of the University of Salerno, for the choice of the material for the friction dampers used in the FREEDAM connections by carrying out a statistical characterization of the static and dynamic friction coefficients. The Chapter 3 collects the results of a further experimental campaign carried out at the University of Salerno laboratory and aimed at studying the tightening losses for pre-loading bolt systems equipped with different washers. In Chapter 4 a design procedure has been define for the FREEDAM beam-column connections, then this procedure has been applied in order to design two different types of connections that have been experimentally tested at the University of Coimbra Laboratory (PT). In the same chapter, the test layouts and the results obtained from the cyclic tests carried out on the nodes equipped with FREEDAM friction dampers have been described, finally developing models to the finite elements and
Pseudo dynamic tests and numerical analysis of free from damage multistorey steel buildings with innovative connections
comparing the experimental results with the computerized models. Finally, the Chapter 5 shows the results of the pseudo-dynamic tests carried out on a full-scale steel Moment Resistant Frame equipped in a first case with traditional full strength beam-column connections (dogbone) and in a second case equipped with the innovative connections proposed. These results have been compared to each other and with the results obtained from finite element models.
Pseudo dynamic tests and numerical analysis of free from damage multistorey steel buildings with innovative connections
1.1. Traditional Moment – Resisting Frames
(MRFs)
The Moment Resisting Frames represent one of the most diffused structural solution. On one hand, this structural system is able to exploit the flexural resistance of the members that compose it to resist lateral loads. On the other hand, the dissipation of the seismic input energy is guarantee by the development of dissipative zones. The location of the dissipative zones strongly depends from the adopted design approach, commonly they are located in correspondence of the beam ends, or in columns and joints (Fig. 1.1).
Fig. 1.1 – Structural typologies of moment resistant frames
From the application of the capacity design criterion to the design of a MRF usually it derives that the beams correspond to the weak element and the columns to the strong one, while the connections are rigid. This classical approach involves that the structure is able to fully exploit its ductility and its dissipation capacity by means of the development of plastic hinges in correspondence of the beam ends and the columns of
Pseudo dynamic tests and numerical analysis of free from damage multistorey steel buildings with innovative connections
the first storey. Alternative approaches are possible, one of the most important consist into the plastic engagement of the joints, removing the assumption of full strength joints, in this way the joint components provide a contribution to the energy dissipation.
The use of the Moment Resisting Frames is affected by a series of disadvantages, above all the structural behaviour is strongly affected by the second order effects that provoke an increase of the lateral drifts, making more difficult to comply with the code requirements for checks both at the ULS and at the SLS.
The traditional MRFs can be classified into three different categories based on the arrangement of the seismic-resistant frames: space frames, perimeter frames and few distributed MRFs.
a) b) c)
Fig. 1.2 – Spatial distribution: a) space frames; b) perimeter frames; c) MRFs in only a few rigid bays – Source: Astaneh-Asl [1]
A three directional structural system (Fig. 1.2a) is composed by columns, beams and connections, and it is able to resist to the applied loads exploiting the flexural stiffness, the strength and the ductility of each member sometimes with the help of horizontal diaphragms or floor Bracing systems.
Pseudo dynamic tests and numerical analysis of free from damage multistorey steel buildings with innovative connections
The perimeter MRF (Fig. 1.2b) is characterized by the presence of the moment resisting frames only in correspondence of the perimeter of the structures, in such a way to resist to the lateral loads like a box. The members that belong to the frames placed in the central part of the building are designed to resist only to gravitational loads. In any case the members designed to the resist only to gravity loads, the floor diaphragms and the other non-structural elements, also provide a contribution in terms of stiffness, strength and damping to the lateral load resistance of the structure. The main advantage of this solution is represented by the reduction of the number of rigid moment connections with respect to a comparable space frame, consequently reducing the cost of the structure.
The structures belonging to the last category (Fig. 1.2c) present rigid connections in only few bays of the entire planar frame. For this reason, the columns that are not part of the moment-resisting frame have to resist only to gravity loads, while the connections are simple shear connections, and the contribution of these members to resistance to the lateral loads of the structure is neglected.
1.1.1. Joints classification
The dynamic response and the post-elastic behaviour of the MRFs is strongly related to the typology of connections adopted. Furthermore, the evaluation of the internal actions in the structure, both in Serviceability Limit States (SLSs) and Ultimate Limit States (ULSs), strongly depends on the elastic and plastic response of the connecting system, that can range from rigid to flexible.
Pseudo dynamic tests and numerical analysis of free from damage multistorey steel buildings with innovative connections
There are two main different typologies of beam-to-column joint: the first one does not allow relative rotation between the connected members, in other words all the elements converging in the joint present the same rotation, the second one permits the relative rotations. In the first case the frames are continuous, in the second one are pinned. When an elastic design procedure is adopted, the connection is mainly characterized by the rotational stiffness, leading to classify the connections into three categories:
Nominally pinned connections, that are able to rotate without develop bending moment actions and for this reason influencing negatively the column resisting capacity. This type of connection is able to transfer shear and axial forces from the beam to the column.
Rigid connections, that are able to transmit all the reactions without develop significant deformations and without altering the moment distribution.
Semi-rigid connections, whose behaviour is related to the moment-rotation curve of the joint.
Fig. 1.3 – Beam-to-column joints classification according to their flexural resistance
Pseudo dynamic tests and numerical analysis of free from damage multistorey steel buildings with innovative connections
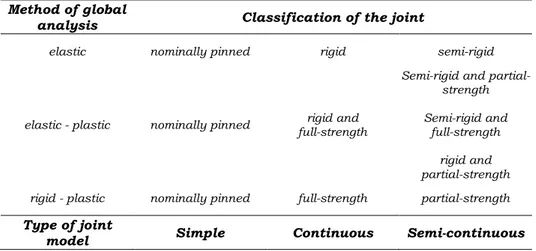
In case of a rigid-plastic design, according to Eurocode 3 [2], the connections are classified based on the joint flexural resistance as following:
Full strength joints with a design resistance equal or greater than the resistance of the connected members. Obviously, the development of plastic hinges takes place in correspondence of the member ends. The plastic rotation capacity of the joint is related to the ratio between the width and the thickness of the plates that constitute the member sections (Case A). When the strain-hardening of the material is not enough to prevent the yielding of the connection, the rotational capacity of the beam sections is not completely exploited and the additional plastic rotation of the joint plays an important rule (Case B).
Partial strength connections, that are characterized by a design resistance lower than the connected members, and this means that a sufficient rotational capacity of the joint is needed (Case D). In case C the rotational capacity of the connection could be exceeded.
Nominally pinned connections, that present a design resistance lower than the connected members.
The last classification criterion, based on the plastic rotation supply, divides the joints into two categories:
Full ductility connections, that can develop a rotation in plastic field greater than the one that connected member can exhibit.
Partial ductility connections, that cannot develop a plastic rotation greater than the one exhibits by the connected member. The different classification for the joints are summarized in Table 1.1.
Pseudo dynamic tests and numerical analysis of free from damage multistorey steel buildings with innovative connections
Table 1.1 – Joint classification
Method of global
analysis Classification of the joint
elastic nominally pinned rigid semi-rigid
elastic - plastic nominally pinned full-strength rigid and
Semi-rigid and partial-strength Semi-rigid and
full-strength rigid and partial-strength rigid - plastic nominally pinned full-strength partial-strength
Type of joint
model Simple Continuous Semi-continuous
1.1.2. Frame classification
The frames classification depends on the joints classification. In fact, the relationship between the bending moment and the joint rotation, that is related to the joints strength, stiffness and rotational capacity, influences the distribution of actions on the structures and also the structure ductility.
The fames, as provided by Eurocode 3 [2], can be classified as sway and non-sway, according to their susceptibility to second order effects. In particular, a frame is non-sway if the internal actions due to the lateral deformation of the frame are negligible, conversely, a fame is sway when the deformed shape of the frame increase the internal actions and modify the structural behaviour.
Another classification divides the frames in braced and unbraced. The braced frames are characterized by the presence of stiffeners that
Pseudo dynamic tests and numerical analysis of free from damage multistorey steel buildings with innovative connections
reduce the lateral displacement of at least the 80%, in all the other cases the frames are defined unbraced.
Depending on the joint characteristics, the Eurocode 3 [2] provides a further classification. In particular, the frame can be divided in:
simple: when the joints are not able to transmit the bending moment to the columns and they allow the free rotation of the connected beams, in other words the structural system can be consider pendular;
Continuous: when the joints resistance is greater than the one of the connected beams and the joints can be considered rigid;
semi-continuous: when the joints assume an intermediate behaviour and it is necessary to define a proper model to take into account the real moment-rotation curve of the joints.
A further classification of the MRFs is referred to the ductility of the structure (Table 1.2). It is possible to define two different parameters in order to describe the ductility properties of a structure: the global ductility, that is defined as the ratio between the ultimate sway displacement and the elastic sway displacement evaluated in correspondence of the top of the structure; and the local ductility, that concerns the rotational capacities of the plastic hinges located at the beam ends and/or in the joints.
Table 1.2 - Classification of structures with reference to their ductility supply
EUROCODE 8
Ductility Class LOW (DCL) Ductility Class MEDIUM (DCM)
Pseudo dynamic tests and numerical analysis of free from damage multistorey steel buildings with innovative connections
Actually, the codes provide some requirements regarding the ductility of the structures, in particular the formation of the plastic hinges is not permitted in the columns, while they require to locate the dissipative zones at the beam ends or in other zones. In Table 1.3 the required rotation capacity for the plastic hinges are shown.
Table 1.3 – Connection required ductility
EUROCODE 8
Ductility Class Rotational Capacity
[mrad]
Ductility Class LOW (DCL) 35 Ductility Class MEDIUM
(DCM) 25
Ductility Class HIGH (DCH) -
1.1.3. Seismic design of MRFs
In order to the increase the energy dissipation capacities of the structures when a seismic event occurs, a great number of the plastic hinges have to be developed in the structural elements. The Eurocodes, in line with others international codes, suggest to use the hierarchy criteria in such a way to assure that the plastic engagement to dissipate seismic energy. The plastic engagement has to be concentrated in the so-called “dissipative zones” (typically the beam ends), that are characterized by wide and stable hysteresis loops, while the “non-dissipative zones” have to resist to the maximum actions that dissipative zones can transfer, remaining in the elastic field to avoid a
![Fig. 1.2 – Spatial distribution: a) space frames; b) perimeter frames; c) MRFs in only a few rigid bays – Source: Astaneh-Asl [1]](https://thumb-eu.123doks.com/thumbv2/123dokorg/7212581.76594/41.892.195.715.555.769/spatial-distribution-space-frames-perimeter-frames-source-astaneh.webp)