16. Clark CE, Steele AM, Taylor RS et al. Interarm blood pressure difference in people with diabetes: measurement and vascular and mortality implica-tions: a cohort study. Diabetes Care 2014; 37: 1613–1620
17. White J, Mortensen LH, Kivimaki M et al. Interarm differences in systolic blood pressure and mortality among US army veterans: aetiological asso-ciations and risk prediction in the Vietnam experience study. Eur J Prev Cardiol 2014; 21: 1394–1400
18. Krause T, Lovibond K, Caulfield M et al. Management of hypertension: summary of NICE guidance. BMJ 2011; 343: d4891
19. Mancia G, Fagard R, Narkiewicz K et al. 2013 ESH/ESC Guidelines for the management of arterial hypertension: the Task Force for the management of arterial hypertension of the European Society of Hypertension (ESH) and of the European Society of Cardiology (ESC). J Hypertens 2013; 31: 1281–1357
20. Sun H, Li P, Su H et al. The detection rates of inter-arm systolic blood pressure difference vary with blood pressure levels in hypertensive patients under antihypertensive therapy. Int J Cardiol 2014; 172: e419–e420 21. Lane D, Beevers M, Barnes N et al. Inter-arm differences in blood
pres-sure: when are they clinically significant? J Hypertens 2002; 20: 1089–1095 22. Orme S, Ralph SG, Birchall A et al. The normal range for inter-arm
differ-ences in blood pressure. Age Ageing 1999; 28: 537–542
23. Clark CE, Taylor RS, Shore AC et al. The difference in blood pressure readings between arms and survival: primary care cohort study. BMJ 2012; 344: e1327 24. Su HM, Lin TH, Hsu PC et al. Association of interarm systolic blood
pres-sure difference with atherosclerosis and left ventricular hypertrophy. PLoS One 2012; 7: e41173
Received for publication: 3.12.2014; Accepted in revised form: 10.2.2015
Nephrol Dial Transplant (2015) 30: 806–814 doi: 10.1093/ndt/gfu383
Advance Access publication 18 December 2014
Prevalence and cardiovascular risk pro
file of chronic kidney
disease in Italy: results of the 2008
–12 National Health
Examination Survey
Luca De Nicola
1,2, Chiara Donfrancesco
3, Roberto Minutolo
1,2, Cinzia Lo Noce
3, Luigi Palmieri
3,
Amalia De Curtis
4, Licia Iacoviello
4, Carmine Zoccali
1,5, Loreto Gesualdo
1,6, Giuseppe Conte
1,2,
Diego Vanuzzo
7,8and Simona Giampaoli
3on behalf of the ANMCO-SIN Research Group*
1Italian Society of Nephrology, Italy,2Division of Nephrology, Second University of Naples, Naples, Italy,3Cardiovascular Epidemiology
Observatory, National Institute of Health, Roma, Italy,4Laboratory of Molecular and Nutritional Epidemiology, Department of Epidemiology
and Prevention, IRCCS Mediterranean Neurologic Institute Neuromed, Pozzilli, IS, Italy,5Nephrology Division, Center of National Research,
Institute of Biomedicine and Molecular Immunology Hospital, Reggio Calabria, Italy,6Division of Nephrology, University of Bari, Bari, Italy,
7National Association of Hospital Cardiologists, ANMCO (Associazione Nazionale Medici Cardiologi Ospedalieri) and Heart Care Foundation
(Fondazione per il Tuo Cuore) Onlus, Firenze, Italy and8Center for Cardiovascular Prevention, ASS 4‘Medio Friuli’, Udine, Italy
Correspondence and offprint requests to: Luca De Nicola; E-mail: [email protected]
*See Supplementary data for the complete list of participants.
A B S T R AC T
Background. National surveys in countries outside Europe have reported a high prevalence (11–13%) of chronic kidney disease (CKD). Studies in Europe have provided a variable prevalence likely due to differences in study design, including age and extent of geographic areas, equation used to evaluate estimated glomerular filtration rate (eGFR) and CKD stages examined.
Methods.The 2008–12 National Health Examination Survey in Italy randomly extracted samples from the general
population aged 35–79 years, stratified by age and gender, from the resident list of each Italian region (440 persons/1.5 million of residents). We estimated the prevalence of CKD by means of urinary albumin : creatinine ratio and eGFR (CKD-EPI equation–enzymatic assay of serum creatinine). Cardio-vascular (CV) risk profile was also evaluated.
Results. Three thousand eight hundred and forty-eight men and 3704 women were examined. In the whole population, mean age was 57 ± 12 and 56 ± 12 years in men and women, respectively; hypertension was prevalent in men and women, respectively (56 and 43%) and the same held true for
ORIGINAL
ARTICLE
overweight (48 and 33%), obesity (26 and 27%), diabetes (14 and 9%) and smoking (21 and 18%), whereas CV disease was less frequent (9 and 6%). Overall, the prevalence of CKD (95% confidence interval) was 7.05% (6.48–7.65). Early stages con-stituted 59% of the CKD population [Stage G1–2 A2–3: 4.16% (3.71–4.61) and Stage G3–5: 2.89% (2.51–3.26)]. At multivari-ate regression analysis, age, obesity, hypertension, diabetes, CV disease and smoking were all independent correlates of CKD.
Conclusions.CKD has a relatively lower prevalence in Italy, in particular for advanced stages, when compared with similar national surveys outside Europe. This occurs despite older age and unfavourable CV risk profile of the whole population. Keywords: albuminuria, chronic kidney disease, health survey, glomerularfiltration rate, risk profile
IN TRO DU CT IO N
Chronic kidney disease (CKD) is a prevalent condition and public health priority worldwide [1]. Aging, nutrition status, prevalence of infectious diseases and environmental and genetic factors, as well as access to health care, can profoundly modify CKD epidemiology [2–4]. Prevalence of end-stage renal disease (ESRD), in fact, differs substantially across countries [1, 3]. More important, mortality related to CKD has almost doubled in the past two decades worldwide, with the overall increase in years of life lost due to premature mortality being the third largest behind HIV–AIDS and diabetes mellitus [5]. Even mod-erate reductions in estimated glomerular filtration rate (eGFR) and/or increases in albuminuria worldwide enhance the risk of ESRD as well as all-cause and cardiovascular (CV) death inde-pendently of age, hypertension and diabetes [6–8]. Therefore, CKD is a public health priority characterized by poor prognosis worldwide and variable prevalence across countries.
Studies estimating at the national level the prevalence of CKD are urgently needed to properly inform health-care plan-ners and to increase awareness of this problem, which remains disturbingly low in the general population and in the medical community as well [1, 9, 10]. National, population-based surveys of CKD prevalence that incorporate both albuminuria and proper estimates of eGFR [i.e. based on the Chronic Kidney Disease Epidemiology Collaboration (CKD-EPI) equa-tion [2, 11] have been conducted in North America, China and Australia [12–15]. These studies reported a high preva-lence (11–13%) of CKD in the general adult population. In Europe, similar prevalence rates have been suggested [16–23]; however, these studies were mostly based on the MDRD equa-tion [16–19, 21, 22], were geographically circumscribed to regions [18, 21–23] or towns [16, 17, 19, 20], or did not examine the early (albuminuric) stages [19,21].
The first survey of the Cardiovascular Epidemiology Ob-servatory/Health Examination Survey (OEC/HES) in Italy, founded by the Italian Ministry of Health, was performed between 1998 and 2002 by the National Institute of Health (ISS) and the National Association of Hospital Cardiologists (ANMCO) to provide a complete picture of the Italian
population’s health and to facilitate implementation of pre-ventive programmes [24]. From 2008 to 2012, a second survey was conducted using the same methodologies and procedures used in thefirst survey. Here, we describe the results of CAr-diovascular risk profile in Renal patients of the Italian Health Examination Survey (CARHES), a project embedded into the OEC/HES 2008–12. CARHES aimed at estimating the preva-lence of a whole spectrum of CKDs and associated CV risk factors in a nationally representative sample from the general adult population in Italy.
M AT E R I A L S A N D M E T H O D S
Cardiovascular Epidemiology Observatory/Health Examination Survey
The survey lasted from April 2008 to December 2012. Pro-cedures were planned according to the recommendations of the European Health Risk Monitoring–Feasibility of European HES projects (available at www.ktl.fi/fehes/) and the WHO MONICA (Multinational MONItoring of trends and determi-nants in CArdiovascular disease) project [25]. Research was approved by the ethics committee of ISS and all recruited persons signed the informed consent.
According to the MONICA project methodology [25], sample size was planned to include 220 men and 220 women in the age range of 35–79 years per 1.5 million residents in each Italian region, randomly selected from the resident list. No additional restriction was applied to the list of residents; therefore, also subjects with any illness, even if severe, such as CKD treated with dialysis or kidney transplant, were eligible for screening. Subjects were stratified by age and gender (25 subjects for gender in each year of age in the range of 35– 74 years, and 20 subjects for gender in each year of age in the range of 75–79 years). This allowed at least 500 men and women in each 10-year age group to be obtained, according to the European recommendations (European HES) for conduct-ing a national HES [26]. The list of invited subjects in each of the 20 regions of Italy included the number of participants to be three times higher to ensure the achievement of the planned sample in the presence of potential refusals. All sub-jects were invited by letter and phone contacts. If the extracted subject refused the visit or he/she was not found after three at-tempts, he/she was substituted with the subsequent one on the list until the number of subjects, established for the specific age stratum and gender, was reached. The participation rate, defined as the percentage of acceptance of first candidates on the list, was 53%. The rate was higher in the north than in the Centre and south (59, 48 and 49%, respectively, P < 0.0001). Participants were invited to public hospitals, one in each of the 20 regions of Italy, to undergo interviews and medical ex-aminations conducted by health personnel specifically trained for HES. All procedures were standardized and centres were kept under quality control by the ISS staff during the fieldwork. Research personnel administered a questionnaire ( personal and medical history) and measured anthropometric features (height, weight, waist and hip cir-cumferences), blood pressure (BP), and collected blood and
ORIGINAL
ARTICLE
24-h urine samples. Complete haemochrome analysis was immediately obtained, while frozen aliquots of serum and urine were sent to the central laboratory (Genetic and Envir-onmental Epidemiology Deptartment of the Catholic Univer-sity of Campobasso) for biochemical testing.
CARHES
This analysis was aimed at estimating the prevalence of CKD and associated CV risk profile in the national popula-tion-based sample of the OEC/HES 2008–12. Persons identi-fied as having CKD were classiidenti-fied in the current six CKD stages [2]. Thefirst two stages were defined by the presence of albumin-to-creatinine ratio (ACR)≥30 mg/g and either eGFR ≥90 mL/min/1.73 m2 (Stage G1 A2–3) or eGFR 89–60 mL/
min/1.73 m2 (Stage G2 A2–3); more advanced stages were only defined on the basis of eGFR values: 59–45 mL/min/ 1.73 m2(Stage G3a), 44–30 mL/min/1.73 m2(Stage G3b), 29– 15 mL/min/1.73 m2 (Stage G4) and <15 mL/min/1.73 m2 (Stage G5). A2 identified subjects with ACR 30-299 mg/g and A3 those with ACR≥300 mg/g.
Questionnaires on personal and medical history, BP, body mass index (BMI), waist–hip ratio, lipids, glycaemia and haemoglobin (Hb) levels were used to assess CV risk profile. We recorded the following comorbidities: hypertension (BP ≥140/90 mmHg or any use of antihypertensive medication), diabetes (fasting glycaemia≥126 mg/dL or diagnosis or treat-ment), anaemia (Hb <13 g/dL in male and <12 g/dL in female), obesity (BMI ≥30 kg/m2), previous CV events (self-reported and/or documented by electrocardiography myocardial in-farction and self-reported angina pectoris, cerebrovascular events and revascularization or coronary artery bypass) and high cholesterol (>200 mg/dL or treatment). Information on smoking (current smoker), alcohol habit (alcoholic drink ≥1per day) and high education level (≥high school gradu-ation) were also collected.
Laboratory analyses
Isotope dilution mass spectrometry (IDMS)-traceable cre-atinine measurement (enzymatic assay) was used to allow proper estimates of GFR by means of the CKD-EPI equation [2,11]. Twenty-four urine samples, stored at−80°C, were used to calculate ACR; albuminuria was measured by immunotur-bidimetric tests and urine creatinine by the same method used for serum creatinine (enzymatic assay).
All tests were performed by using reagents and automatic analyser (MODULAR Analytic) by ROCHE Diagnostics (Monza, Italy). Interday coefficients of variation were 1.82 and 1.56% for serum creatinine, 1.31 and 1.17% for urinary cre-atinine and 1.92 and 2.31% for albuminuria, respectively, for normal and pathological controls.
Total and high-density lipoprotein (HDL) cholesterol, triglycerides and glucose were measured in serum samples using commercial enzyme colorimetric kits (Instrumentation Laboratory, Milan, Italy) and an automatic analyser (IL 350). Coefficients of variation for high-level external standards were 5.5% for cholesterol, 5.0% for triglycerides, 6.1% for HDL cholesterol and 5.0% for glucose. Corresponding coef fi-cients of variation for low-level external standards were 5.8,
7.9, 7.0 and 7.6%; corresponding coefficients of variation for an in-house plasma pool were 2.6, 3.5, 5.3 and 3.8%. Low-density lipoprotein (LDL) cholesterol was calculated by Friedewald formula.
Statistical analysis
Prevalence and 95% confidence intervals (95% CIs) of CKD are reported in total, by gender, age class and stage of disease. Owing to the small number of persons identified as having advanced stages of CKD, adequate estimates of age– gender standardized prevalence could only be estimated for CKD overall and combined CKD Stages G1–2 and G3–5. We calculated both crude and age-standardized means and preva-lence for continuous and categorical variables, respectively, stratified by gender. Since 2010 is the middle year of the screening, the Census 2010 Italian resident population 35–79 years old was used as the standard for the age standardization. Mean values were compared by Student’s t-test or Mann– Whitney test, as appropriate; prevalence rates were compared by theχ2test.
The association between indicators of kidney damage and relevant covariates was explored using multivariable logistic regression models and reported as odds ratios (ORs) with 95% CI. SAS software (version 9.2) was used for data management and statistical analyses. Two-sided P-values of <0.05 were stat-istically considered significant.
R E S U LTS
CKD prevalence
In the OEC/HES, 8693 persons out of the planned sample of 9020 underwent interviews and examinations (96.4%). In-formation on ACR or serum creatinine was lacking in 1141 in-dividuals. Thus, CARHES included 7552 Caucasian subjects (84% of the planned sample). In the sample, 28 persons with eGFR <60 mL/min/1.73 m2 did not have ACR measured; therefore, the evaluation of distribution of albuminuria by eGFR category was obtained in 7524. The general characteris-tics of the whole population are reported in Table1.
Table2describes unadjusted prevalence estimates of CKD. Overall, prevalence of CKD increased remarkably across age strata, from 2.7% at age 35–49 years to 17.0% at 70–79 years. Early stages of disease accounted for most of the estimated CKD population, the prevalence of the first two CKD stages (4.16%) being higher than that of CKD Stage G3a–5 (2.89%). In particular, persons with eGFR <45 mL/min/1.73 m2 (Stage G3b–5) represented only 0.78% of the whole population and the 11% of the CKD population. Prevalence of CKD was similar in North [7.0% (95% CI 6.1–7.9)], Centre [5.6% (95% CI 4.3–7.0)] and South [7.8% (95% CI 6.8–8.8)]. When con-sidering the prevalence rates of single stages of disease by gender, we observed a higher prevalence of early—albuminuric— stages in males, with the difference being not maintained in the more advanced stages of disease, G3a–5. Questionnaire-reported awareness of CKD was poor with 10.0% of person with CKD being aware of their condition; awareness increased to 18.4% in those with eGFR <60 mL/min/1.73 m2.
ORIGINAL
ARTICLE
CKD prevalence slightly decreased after age standardization to the resident population (overall: 6.29%, 95% CI 5.74–6.84, CKD Stage G1–2 A2–3: 3.78%, 95% CI 3.36–4.22; CKD Stage G3a–5: 2.50%, 95% CI 2.15–2.85), with men showing higher rates of Stage G1–2 A2–3 (4.2 versus 3.4% in females) and slightly lower rates of Stage G3a–5 (2.1 versus 2.8% in females). We can therefore estimate that, in Italy, there is a total number of 2 180 542 adult persons (age 35–79 years) with CKD (1 075 354 men and 1 105 187 women), most with early disease (60.4%) and older age (69.8%; Supplementary data, Table SA).
An ACR of≥30 mg/g was detected in 4.77% of subjects. In particular, ACR was moderate (ACR 30–299 mg/g, formerly defined as microalbuminuria) in 84.3% of albuminuric
persons, with the remaining 15.7% having severe albuminuria (ACR≥300 mg/g, formerly defined as macroalbuminuria).
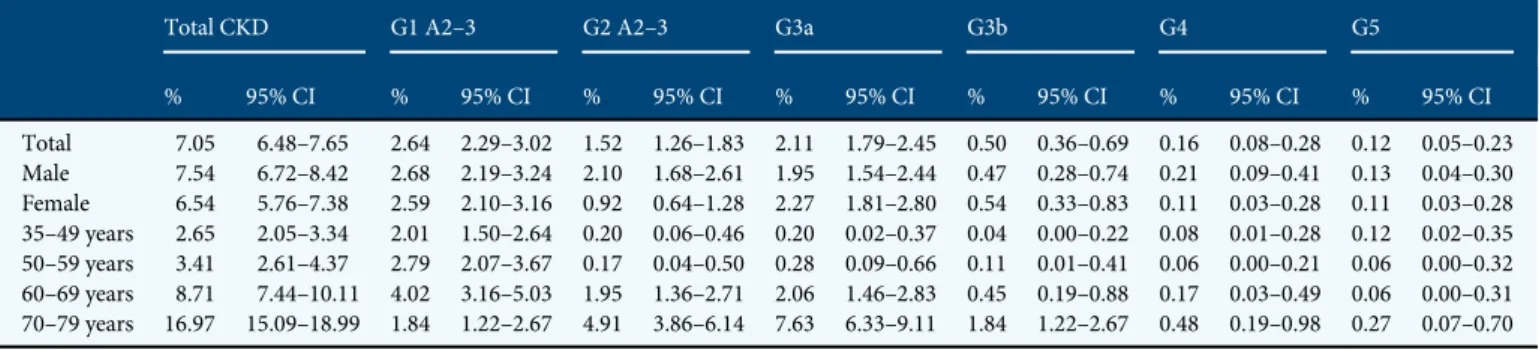
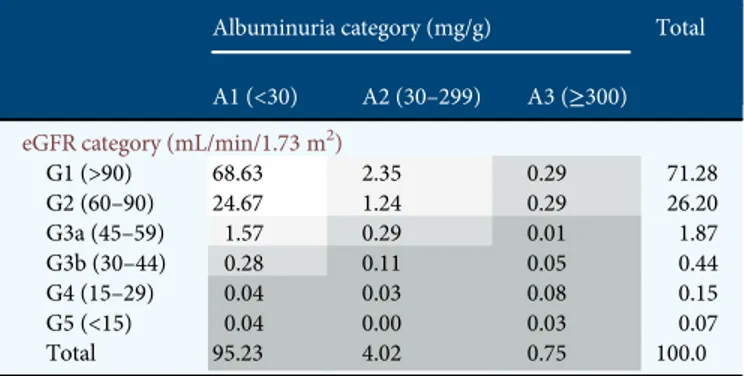
Table3provides estimates of the prevalence of subjects at cardio-renal risk based on the combined measure of eGFR and albuminuria level. Very few persons can be considered at high or very high risk considering the concomitant presence of reduced eGFR and high albuminuria. Specifically, among sub-jects with eGFR <60 mL/min/1.73 m2, albuminuria was present in 23.7%, that is 17.0% with moderate and 6.7% with severe albuminuria. The prevalence of moderate and severe al-buminuria in individuals with eGFR <60 was, however, sub-stantially higher than that found in the whole group (that is, with and without low eGFR) of hypertensive (5.7 and 1.3%, Table 2. Crude prevalence estimates of CKD in the adult Italian population overall and by disease stage and demographic characteristics
Total CKD G1 A2–3 G2 A2–3 G3a G3b G4 G5
% 95% CI % 95% CI % 95% CI % 95% CI % 95% CI % 95% CI % 95% CI Total 7.05 6.48–7.65 2.64 2.29–3.02 1.52 1.26–1.83 2.11 1.79–2.45 0.50 0.36–0.69 0.16 0.08–0.28 0.12 0.05–0.23 Male 7.54 6.72–8.42 2.68 2.19–3.24 2.10 1.68–2.61 1.95 1.54–2.44 0.47 0.28–0.74 0.21 0.09–0.41 0.13 0.04–0.30 Female 6.54 5.76–7.38 2.59 2.10–3.16 0.92 0.64–1.28 2.27 1.81–2.80 0.54 0.33–0.83 0.11 0.03–0.28 0.11 0.03–0.28 35–49 years 2.65 2.05–3.34 2.01 1.50–2.64 0.20 0.06–0.46 0.20 0.02–0.37 0.04 0.00–0.22 0.08 0.01–0.28 0.12 0.02–0.35 50–59 years 3.41 2.61–4.37 2.79 2.07–3.67 0.17 0.04–0.50 0.28 0.09–0.66 0.11 0.01–0.41 0.06 0.00–0.21 0.06 0.00–0.32 60–69 years 8.71 7.44–10.11 4.02 3.16–5.03 1.95 1.36–2.71 2.06 1.46–2.83 0.45 0.19–0.88 0.17 0.03–0.49 0.06 0.00–0.31 70–79 years 16.97 15.09–18.99 1.84 1.22–2.67 4.91 3.86–6.14 7.63 6.33–9.11 1.84 1.22–2.67 0.48 0.19–0.98 0.27 0.07–0.70
OEC/HES-CARHES 2008–12: 7552 subjects (3848 men and 3704 women) 35–79 years old.
Thefirst two stages, G1 A2–3 and G2 A2–3, were defined by the presence of ACR ≥30 mg/g (A2) and ≥300 mg/g (A3) and either eGFR ≥90 mL/min/1.73 m2(Stage G1 A2–3) or eGFR
89–60 mL/min/1.73 m2(Stage G2 A2–3). More advanced stages were only defined on the basis of eGFR values: 59–45 mL/min/1.73 m2(Stage G3a), 44–30 mL/min/1.73 m2
(Stage G3b), 29–15 mL/min/1.73 m2(Stage G4) and <15 mL/min/1.73 m2(Stage G5).
CI, confidence intervals.
Table 1. Characteristics of survey participants overall and stratified by gender and presence of CKD
All (n = 7552) Males Females
No CKD (n = 3558) CKD (n = 290) P-value No CKD (n = 3462) CKD (n = 242) P-value Age (years) 56.7 ± 12.4 56.3 ± 12.3 66.3 ± 10.7 <0.001 55.8 ± 12.0 64.8 ± 12.0 <0.001 ACR (mg/g) 15.0 [12.3–17.6] 3.8 [3.6–4.0] 213.5 [148.0–279.0] <0.001 5.7 [5.5–5.9] 91.3 [67.8–114.7] <0.001 eGFR (mL/min/1.73 m2) 95.9 ± 16.3 97.1 ± 13.9 74.3 ± 25.7 <0.001 97.9 ± 14.1 75.1 ± 27.6 <0.001 Systolic BP (mmHg) 132 ± 19 134 ± 17 143 ± 21 <0.001 129 ± 20 139 ± 21 <0.001 Diastolic BP (mmHg) 82 ± 10 84 ± 10 83 ± 11 0.08 79 ± 10 80 ± 11 0.4 Total cholesterol (mg/dL) 213 ± 44 209 ± 43 198 ± 47 0.001 218 ± 43 213 ± 46 0.07 HDL cholesterol (mg/dL) 56 ± 15 51 ± 13 47 ± 12 <0.001 62 ± 15 57 ± 15 <0.001 LDL cholesterol (mg/dL) 132 ± 38 131 ± 37 120 ± 41 <0.001 135 ± 37 130 ± 40 0.06 Triglycerides (mg/dL) 122 [120–124] 133 [131–136] 156 [146–167] <0.001 107 [105–109] 129 [122–136] <0.001 Haemoglobin (g/dL) 14.2 ± 1.4 15.0 ± 1.1 14.7 ± 1.6 <0.001 13.4 ± 1.1 13.3 ± 1.4 0.4 Glycaemia (mg/dL) 99 ± 24 102 ± 24 116 ± 39 <0.001 94 ± 20 107 ± 40 <0.001 BMI (kg/m2) 27.5 ± 4.9 27.6 ± 4.1 29.2 ± 4.9 <0.001 27.2 ± 5.5 29.1 ± 6.2 <0.001 Waist (cm) 92.3 ± 13.3 96.6 ± 11.3 101.4 ± 11.4 <0.001 87.2 ± 13.2 93.3 ± 15.6 <0.001 Waist–hip ratio 0.91 ± 0.10 0.96 ± 0.07 0.99 ± 0.07 <0.001 0.85 ± 0.09 0.87 ± 0.10 <0.001 Hypertension (%) 50.1 [48.9–51.2] 54.6 [53.0–56.2] 78.3 [73.5–83.0] <0.001 41.5 [39.9–43.2] 71.5 [65.8–77.2] <0.001 Diabetes (%) 11.8 [11.1–12.5] 12.9 [11.9–14.1] 33.1 [27.7–38.5] <0.001 7.9 [7.0–8.8] 24.4 [19.0–29.8] <0.001 Previous CV disease (%) 7.4 [6.8–8.0] 7.3 [6.4–8.1] 23.8 [18.9–28.7] <0.001 5.9 [5.1–6.7] 11.8 [7.5–15.6] <0.001 Anaemia (%) 6.9 [6.3–7.6] 4.1 [3.3–4.8] 13.1 [8.6–17.5] <0.001 9.0 [7.9–10.1] 12.6 [7.9–17.3] 0.1 Obesity (%) 26.4 [25.4–27.4] 24.6 [23.2–26.0] 38.3 [32.7–43.9] <0.001 26.2 [24.8–27.7] 40.5 [34.3–46.7] <0.001 Smoking (%) 19.9 [19.0–20.8] 21.4 [20.0–22.7] 19.0 [14.5–23.5] 0.3 18.7 [17.4–20.0] 15.3 [10.8–19.8] 0.2 Alcohol habit (%) 49.6 [48.4–50.7] 64.7 [63.2–66.3] 66.2 [60.8–71.7] 0.6 33.5 [31.9–35.1] 36.8 [30.7–42.9] 0.3 High education (%) 48.7 [47.6–49.8] 50.6 [49.0–52.3] 37.3 [31.7–42.9] <0.001 49.1 [47.4–50.7] 27.7 [21.9–33.5] <0.001
Data are mean ± SD or mean [95% CI].
OEC/HES-CARHES 2008–12: 3848 men and 3704 women 35–79 years of age.
ACR, albumin-to-creatinine ratio; eGFR, estimated glomerularfiltration rate; BMI, body mass index; CV, cardiovascular. See Materials and methods for definitions. ORIGINAL
ARTICLE
for moderate and severe albuminuria, respectively) and diabet-ic subjects (10.6 and 3.1%, respectively).
CV risk profile
In the whole sample, hypertension was prevalent in men and women (56.4 and 43.5%, respectively) and the same held true for overweight (48.4 and 33.2%), obesity (25.6 and 27.2%), diabetes (14.5 and 9.0%) and smoking (21.2 and 18.5%), whereas a positive history of CV disease was relatively less frequent (8.5 and 6.3%). Table1 compares CV risk pro-file in survey participants with and without CKD. When com-pared with non-CKD subjects, men and women with CKD had higher fasting glucose, triglycerides, systolic BP, BMI, waist circumference and waist–hip ratio, while HDL cholesterol was lower. CKD was also associated with higher prevalence of hypertension, diabetes, obesity, anaemia, CV disease and low education level. As persons with CKD were on average 10 years older than non-CKD subjects, we repeated the same analysis after age standardization (Supplementary data, Table SB). This analysis showed that age attenuated but did not substantially modify the differences in the CV risk profile.
Multivariate regression analysis (Table 4) identified age, hypertension and presence of CV disease as main independent
correlates of CKD. These results were in fact consistent when analysing separately low GFR and albuminuria. Diabetes and smoking also associated with CKD, but correlated more strict-ly with albuminuria than low GFR. Conversestrict-ly, obesity was an independent correlate of CKD, being associated with low eGFR. Males exclusively correlated with albuminuria. Waist– hip ratio or overweight did not correlate with CKD when replacing obesity in the analysis (data not shown).
D IS C U S S I O N
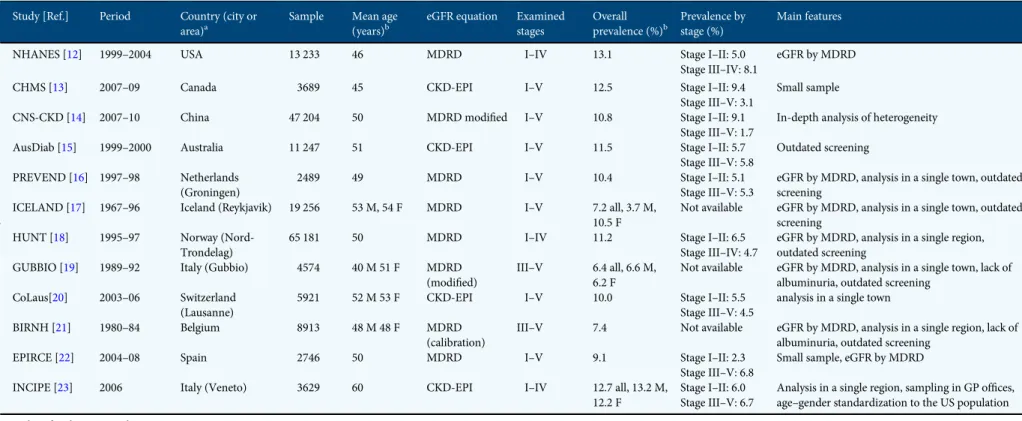
Early European studies have shown a variable CKD preva-lence, with significant differences in men and women in most cases [27]. Observed variability may be explained at least in part by heterogeneity of study design, such as differences in population sampling, including age and extent of geographic area, equation used to estimate eGFR and examined stages. The peculiarities of the main CKD surveys are summarized in Table5. CARHES is thefirst study estimating CKD prevalence in an European country at the national level and based on a large sample size (the number of screened subjects/resident population was greater when compared with the other four na-tional surveys outside Europe) and adequate measures (CKD stages were defined by ACR and CKD-EPI eGFR).
Unadjusted prevalence of CKD averaged 7% in men and women, with predominance of early stages (Table2). Similar figures were observed after age and gender adjustment; indeed, standardized rates were 6.3% for all stages of CKD, 3.8% for CKD Stage G1–2 and 2.5% for Stage G3–5. Accordingly, we can estimate 2.2 million adult persons with CKD in Italy, 60% with Stages I and II. Noteworthy, among those with CKD, only 1 of 10 was aware of the pathology, and the perception of disease was similarly scarce also in those with low eGFR (18%), thus confirming that low awareness of CKD is a global problem [1,9,10,27].
CARHESfindings differ from the results of the other four main surveys in nationally representative samples of the general population (Table5). In the National Health and Nu-trition Examination Survey (NHANES) 1999–2004 [12], CKD prevalence was 13.1% overall, and the dimension of overt phases (Stages G3–5) was remarkably higher versus Italy. In Canada, comparable estimates with those in the USA were re-ported; however, at variance with NHANES, there were higher rates for Stages G1–2 (9.4%) than for Stages G3–5 (3.1%) were found [13]. The survey in China yielded comparable results with US and Canadian surveys in terms of overall CKD preva-lence; however, prevalence of Stage G1–2 was higher than that reported in NHANES 1999–2004 and the overt stages of disease were poorly represented [14]. In Australia, CKD preva-lence has been recently recalculated according to the CKD-EPI equation in the original cohort representative of the adult population examined in 1999–2000 [15]; also in this country, the overall prevalence is high; however, at variance with the other national surveys, the prevalence rates of early and ad-vanced stages are remarkably similar. An additional peculiar-ity of CKD in Italy is the lower prevalence of albuminuria with decreasing eGFR. Indeed, a reverse association has been Table 3. Estimated prevalence (%) of subjects at risk of cardio-renal events
by estimated GFR and albuminuria
Albuminuria category (mg/g) Total
A1 (<30) A2 (30–299) A3 (≥300)
eGFR category (mL/min/1.73 m2)
G1 (>90) 68.63 2.35 0.29 71.28 G2 (60–90) 24.67 1.24 0.29 26.20 G3a (45–59) 1.57 0.29 0.01 1.87 G3b (30–44) 0.28 0.11 0.05 0.44 G4 (15–29) 0.04 0.03 0.08 0.15 G5 (<15) 0.04 0.00 0.03 0.07 Total 95.23 4.02 0.75 100.0
OEC/HES-CARHES 2008–12: 7524 subjects 35–79 years old.
Low risk (white), medium risk (light grey), high risk (medium grey) and very high risk (dark grey). Risk stratification made according to KDIGO (ref. [2]).
Table 4. Multivariate logistic regression analysis estimating clinical correlates of CKD, low eGFR and pathological albuminuria
CKD eGFR < 60 ACR≥ 30 OR 95% CI OR 95% CI OR 95% CI Age (year) 1.06 1.05–1.07 1.13 1.11–1.15 1.03 1.02–1.04 Males 1.07 0.87–1.31 0.75 0.55–1.03 1.42 1.11–1.82 High cholesterol 1.09 0.88–1.34 1.21 0.88–1.71 1.05 0.82–1.34 Obesity 1.42 1.17–1.73 1.46 1.08–1.96 1.24 0.98–1.58 Hypertension 1.55 1.23–1.94 1.53 1.05–2.22 1.71 1.30–2.25 Diabetes 1.98 1.59–2.46 1.23 0.88–1.73 2.68 2.08–3.46 High education 0.95 0.78–1.17 1.13 0.82–1.57 0.94 0.73–1.20 CV disease 1.90 1.47–2.42 2.43 1.72–3.44 1.65 1.21–2.25 Smoking 1.34 1.05–1.72 0.76 0.46–1.26 1.69 1.29–2.21 Alcohol habit 0.94 0.77–1.15 1.08 0.80–1.47 0.84 0.67–1.07
OEC/HES-CARHES 2008–12: 7552 subjects (3848 men and 3704 women) 35–79 years old. Bold values are statistically significant.
BMI, body mass index; CV, cardiovascular. See Materials and methods for definitions.
ORIGINAL
ARTICLE
Table 5. Summary of main studies estimating CKD prevalence in the general adult population
Study [Ref.] Period Country (city or
area)a
Sample Mean age
(years)b
eGFR equation Examined
stages Overall prevalence (%)b Prevalence by stage (%) Main features
NHANES [12] 1999–2004 USA 13 233 46 MDRD I–IV 13.1 Stage I–II: 5.0
Stage III–IV: 8.1
eGFR by MDRD
CHMS [13] 2007–09 Canada 3689 45 CKD-EPI I–V 12.5 Stage I–II: 9.4
Stage III–V: 3.1
Small sample
CNS-CKD [14] 2007–10 China 47 204 50 MDRD modified I–V 10.8 Stage I–II: 9.1
Stage III–V: 1.7
In-depth analysis of heterogeneity
AusDiab [15] 1999–2000 Australia 11 247 51 CKD-EPI I–V 11.5 Stage I–II: 5.7
Stage III–V: 5.8 Outdated screening PREVEND [16] 1997–98 Netherlands (Groningen) 2489 49 MDRD I–V 10.4 Stage I–II: 5.1 Stage III–V: 5.3
eGFR by MDRD, analysis in a single town, outdated screening
ICELAND [17] 1967–96 Iceland (Reykjavik) 19 256 53 M, 54 F MDRD I–V 7.2 all, 3.7 M, 10.5 F
Not available eGFR by MDRD, analysis in a single town, outdated screening
HUNT [18] 1995–97 Norway (Nord-Trondelag)
65 181 50 MDRD I–IV 11.2 Stage I–II: 6.5
Stage III–IV: 4.7
eGFR by MDRD, analysis in a single region, outdated screening
GUBBIO [19] 1989–92 Italy (Gubbio) 4574 40 M 51 F MDRD
(modified)
III–V 6.4 all, 6.6 M, 6.2 F
Not available eGFR by MDRD, analysis in a single town, lack of albuminuria, outdated screening
CoLaus[20] 2003–06 Switzerland (Lausanne)
5921 52 M 53 F CKD-EPI I–V 10.0 Stage I–II: 5.5
Stage III–V: 4.5
analysis in a single town
BIRNH [21] 1980–84 Belgium 8913 48 M 48 F MDRD
(calibration)
III–V 7.4 Not available eGFR by MDRD, analysis in a single region, lack of albuminuria, outdated screening
EPIRCE [22] 2004–08 Spain 2746 50 MDRD I–V 9.1 Stage I–II: 2.3
Stage III–V: 6.8 Small sample, eGFR by MDRD
INCIPE [23] 2006 Italy (Veneto) 3629 60 CKD-EPI I–IV 12.7 all, 13.2 M,
12.2 F
Stage I–II: 6.0 Stage III–V: 6.7
Analysis in a single region, sampling in GP offices, age–gender standardization to the US population
M, male; F, female; GP, general practitioner. aIf not specified, screening covers the whole country. bIf not specified, data by gender are not available.
Chr o nic k idne y d isease in Ita l y 811
shown in the USA, Canada and China [12–14], whereas a similar prevalence by CKD stages was found in Australia [15]. The Gubbio study specifically addressed the relationship between albuminuria and GFR in a sample of Italian adult subjects of the general population of a town in central Italy [28]. The authors did notfind any correlation, with high albu-minuria and low eGFR that provided complementary informa-tion in defining kidney dysfunction and predicting CV risk. In this regard, it is interesting that a recent large population-based study found a strong association between hyperhomo-cysteinaemia and higher prevalence of albuminuria that was independent of eGFR level [29]. Therefore, the association between renal function and albuminuria may not be as simple as expected and deserves further ad hoc studies.
Conversely, in agreement with other surveys [30, 31], we found that males were characterized by higher prevalence of early, albuminuric CKD stages versus females, but the differ-ence was not maintained for more advanced disease. It is pos-sible to hypothesize that also in Italy men are more prone to develop proteinuric CKD due to the higher rates of hyperten-sion, diabetes, smoking and overweight and, due in part to these differences, being exposed to faster progression to ESRD and premature death with respect to women [31].
The differentfindings reported by national surveys of the general population, including albuminuria distribution by eGFR, indicate that epidemiology of non-dialysis CKD is mainly influenced by features inherent to the population ex-amined; this hypothesis is supported by the different rates of ESRD reported by national registries of dialysis and trans-plantation. [1]. Of note, the comparison of CKD prevalence between our study and the surveys in USA and China may be affected by the different methods of eGFR estimation to define CKD; indeed, NHANES 1999–2004 used the MDRD equation and the survey in China used a modified MDRD equation. In this regard, in NHANES 1999–2006, prevalence of CKD was slightly lower (11.5%) when based on the CKD-EPI versus MDRD equation (13.1%) [32]. This difference has been con-sistently found in other surveys that reported similar overesti-mation of prevalence rate when GFR was calculated by means of MDRD versus CKD-EPI [15,20,30]. Nonetheless, the high prevalence of CKD in USA (14.0%) has been confirmed by the most recent report of NHANES (2005–10) publically available
(http://www.usrds.org/2013/pdf/v1_ch1_13.pdf), where the
CKD-EPI equation was used.
Knowledge on the early, albuminuric, stages of disease is critical. Pathological albuminuria acts as an independent pre-dictor of de novo development of renal function impairment, ESRD and mortality in the general population [1,6–8,33], and its remission heralds a better cardio-renal prognosis [1,2,33]. CARHES shows a lower prevalence of CKD Stages I–II in Italy when compared with the other main surveys in the rest of the world. Specifically, prevalence was 4.2%, and 3.8% after stand-ardization to the resident population, that corresponds to a con-comitance of albuminuria and eGFR ≥60 in ∼1.3 million of adult persons in Italy. In this regard, our data suggest that urine testing would be especially indicated in elderly, smokers, dia-betics, hypertensives and those with a history of CV disease, being that these factors are significantly associated with the risk
of pathological albuminuria (Table4). Noteworthy, we found albuminuria to be more prevalent in overt CKD than among in-dividuals with hypertension or diabetes, which are conditions where albuminuria testing is traditionally common. The knowl-edge that coexistence of albuminuria and low eGFR confers a substantial increase in the risk for ESRD and all-cause mortality should therefore stimulate physicians to routinely perform urine testing also in subjects with impaired eGFR [2,6–8].
The reason why the prevalence of CKD is lower in Italy is puzzling, and this holds particularly true when taking into account age and CV risk profile. In the whole population, the mean age was∼10 years higher with respect to surveys in North Europe (Table5), USA [12], Canada [13], China [14] and Aus-tralia [15]. Older age is expected to be a factor that predisposes to CKD development because aging is itself associated with reduced GFR and because older age associates with increased prevalence of obesity, hypertension and diabetes that are all well-known determinants of CKD [1, 2]. Noteworthy, in the whole sample, >50% of subjects had hypertension, one of the four was obese, 20% were smokers and over 10% subjects were affected by diabetes. This picture is not dissimilar when com-pared with data from the other countries of the Western world. In particular, in the USA, which is the country with the highest prevalence of CKD, hypertension is less frequent (33%) but obesity is more prevalent (35%), while similarities are observed for diabetes, smoking and lipid profile as well [12,34]. Interest-ingly, as observed for CKD, also the prevalence of persons with a positive history of CV, disease is significantly lower in Italy (Table1) than in the USA [34]. Therefore, it is possible that fea-tures inherent to the population living in Italy may be protective not only for CV events, but also for CKD development, even in the presence of unfavourable risk profile. Whether this is a ‘renal’ aspect of the genetic low background risk [35–37], and/ or dependent on the still high adherence to the Mediterranean diet [38–40], deserves further studies.
CARHES has three limitations that are shared with the other main surveys on CKD prevalence. First, it is limited by the single measurement of serum creatinine and ACR, while correct identification of CKD requires confirmation of abnor-malities in eGFR and/or albuminuria over at least a 3-month period. Secondly, the 53% response rate of thefirst ones on the list may introduce a bias because these subjects may be health-ier or sicker than the rest of population. Thirdly, the dimen-sion of CV disease may not be accurately quantified being mostly based on questionnaires. Finally, as a further potential confounder, we observed a different rate of response to survey, higher in the north versus the rest of Italy, which is compatible with the higher educational and economic level of this region.
In conclusion, in Italy, when compared with other countries, CKD prevalence is relatively low, being ∼7.0% in men and women, with predominance of the early stages (59%). The preva-lence of CKD appears to be unexpectedly lower when consider-ing the older age and the unfavourable CV risk profile of the whole population. Low background risk (genetic factors) and/or dietary habits (Mediterranean diet) may play a protective role.
The consequences of CKD, in terms of life years lost and ESRD incidence, vary significantly worldwide and even within Europe [1,3,5,41]. Comparison of CARHES data with those
ORIGINAL
ARTICLE
obtained in the other national surveys outside Europe suggests that CKD may be considered as a‘geographic pathology’ also in terms of disease prevalence. Country-level studies on epi-demiology of CKD are therefore needed to attain proper esti-mates of the burden of this high-risk condition.
S U P P L E M E N TA RY D ATA
Supplementary data are available online at http://ndt.oxford journals.org.
AC K N OW L E D G E M E N T S
We are grateful to Prof. A. Maseri, president of the Heart Care Foundation Onlus, for his thoughtful and incessant support to the project. We also thank Franco Celiberti and all personnel of the General Hospital of Atessa for their collaboration in labora-tory assays. The study is endorsed by the Italian Ministry of Health, the Italian Association of Cardiogists-ANMCO, Heart Care Foundation Onlus (Associazione Nazionale Medici Cardio-logi Ospedalieri e Fondazione per il Tuo Cuore, Firenze) and the Italian Society of Nephrology; it has been financed by Italian National Health funding and partially supported by unrestricted grants of ROCHE, ABBOTT-ABBVIE, SANOFI-GENZYME and LABORATORI GUIDOTTI. Study sponsors had no role in study design, collection, analysis, interpretation of data, writing the report and the decision to publish the report.
CON F L I C T O F I N T E R E S T S TATE M E N T
None declared.
R E F E R E N C E S
1. Jha V, Garcia-Garcia G, Iseki K et al. Chronic kidney disease: global di-mension and perspectives. Lancet 2013; 382: 260–272
2. Kidney Disease Improving Global Outcomes (KDIGO) CKD Work Group. KDIGO 2012 clinical practice guideline for the evaluation and management of chronic kidney disease. Kidney Int Suppl 2013; 3: 1–150 3. Zoccali C, Kramer A, Jager KJ. Epidemiology of CKD in Europe: an
uncer-tain scenario. Nephrol Dial Transplant 2010; 25: 1731–1733
4. McCullough K, Sharma P, Ali T et al. Measuring the population burden of chronic kidney disease: a systematic literature review of the estimated prevalence of impaired kidney function. Nephrol Dial Transplant 2012; 27: 1812–1821
5. Lozano R, Naghavi M, Foreman K et al. Global and regional mortality from 235 causes of death for 20 age groups in 1990 and 2010: a systematic analysis for the Global Burden of Disease Study 2010. Lancet 2013; 380: 2095–2128
6. Hallan SI, Matsushita K, Sang Y et al. Age and association of kidney mea-sures with mortality and end-stage renal disease. JAMA 2012; 308: 2349–2360
7. Mahmoodi BK, Matsushita K, Woodward M et al. Associations of kidney disease measures with mortality and end-stage renal disease in individuals with and without hypertension: a meta-analysis. Lancet 2012; 380: 1649–1661
8. Fox CS, Matsushita K, Woodward M et al. Associations of kidney disease measures with mortality and end-stage renal disease in individuals with and without diabetes: a meta-analysis. Lancet 2012; 380: 1662–1673 9. Minutolo R, De Nicola L, Mazzaglia G et al. Detection and awareness of
moderate to advanced CKD by primary care practitioners: a cross-section-al study from Itcross-section-aly. Am J Kidney Dis 2008; 52: 444–453
10. Tuot DS, Platinga LC, Hsu CY et al. Chronic kidney disease awareness among individuals with clinical markers of kidney dysfunction. Clin J Am Soc Nephrol 2011; 6: 1838–1844
11. Matsushita K, Mahmoodi BK, Woodward M et al. Comparison of risk pre-diction using the CKD-EPI equation and the MDRD study equation for estimated glomerularfiltration rate. JAMA 2012; 307: 1941–1951 12. Coresh J, Selvin E, Stevens LA et al. Prevalence of chronic kidney disease
in the United States. JAMA 2007; 298: 2038–2047
13. Arora P, Vasa P, Brenner D et al. Prevalence estimates of chronic kidney disease in Canada: results of a nationally representative survey. CMAJ 2013; 185: E417–E423
14. Zhang L, Wang F, Wang L et al. Prevalence of chronic kidney disease in China: a cross-sectional survey. Lancet 2012; 379: 815–822
15. White SL, Polkinghorne KR, Atkins RC et al. Comparison of the preva-lence and mortality risk of CKD in Australia using the CKD Epidemiology Collaboration (CKD-EPI) and Modification of Diet in Renal Disease (MDRD) Study GFR estimating equations: the AusDiab (Austra-lian Diabetes, Obesity and Lifestyle) Study. Am J Kidney Dis 2010; 55: 660–670.
16. De Zeeuw D, Hillege HL, de Jong PE. The kidney, a cardiovascular risk marker and a new target for therapy. Kidney Int 2005; 68(Suppl 98): S25–S29 17. Viktorsdottir O, Palsson R, Andresdottir MB et al. Prevalence of chronic kidney disease based on estimated glomerularfiltration rate and protein-uria in Icelandic adults. Nephrol Dial Transplant 2005; 20: 1799–1807 18. Hallan SI, Coresh J, Astor BC et al. International comparison of the
rela-tionship of chronic kidney disease prevalence and ESRD risk. J Am Soc Nephrol 2006; 17: 2275–2284
19. Cirillo M, Laurenzi M, Mancini M et al. Low glomerularfiltration in the population: prevalence, associated disorders, and awareness. Kidney Int 2006; 70: 800–806
20. Ponte B, Pruijm M, Marques-Vidal P et al. Determinants and burden of chronic kidney disease in the population-based CoLaus study: a cross-sectional analysis. Nephrol Dial Transplant 2013; 28: 2329–2339 21. Van Biesen W, De Bacquer D, Verbeke F et al. The glomerularfiltration
rate in an apparently healthy population and its relation with cardiovascu-lar mortality during 10 years. Eur Heart J 2007; 28: 478–483
22. Otero A, de Francisco A, Gayoso P et al. Prevalence of chronic renal disease in Spain: results of the EPIRCE study. Nefrologia 2010; 30: 78–86 23. Gambaro G, Yabarek T, Graziani MS et al. Prevalence of CKD in
north-eastern Italy: results of the INCIPE study and comparison with NHANES. Clin J Am Soc Nephrol 2010; 5: 1946–1953
24. Giampaoli S, Palmieri L, Chiodini P et al. The global cardiovascular risk chart. Ital Heart J Suppl 2004; 5: 177–185
25. Tunstall-Pedoe H. Prepared by Tunstall-Pedoe H, Kuulasmaa K, Tolonen H, Davidson M, Mendis S with 64 other contributors for The WHO MONICA Project. MONICA Monograph and Multimedia Sourcebook. Geneva: World Health Organization, 2003. ISBN 92 4 156223 4
26. Heldal J, Jentoft S. Target population and sample size. In: H Tolonen (ed). EHES Manual: Part A: Planning and Preparation of the Survey. Helsinki: National Institute for Health and Welfare, 2013.http://urn.fi/URN:ISBN:
978-952-245-842-1
27. Radhakrishnan J, Remuzzi G, Saran R et al. Taming the chronic kidney disease epidemic: a global view of surveillance efforts. Kidney Int 2014; 86: 246–250
28. Cirillo M, Lanti MP, Menotti A et al. Definition of kidney dysfunction as a cardiovascular risk factor: use of urinary albumin excretion and estimated glomerularfiltration rate. Arch Intern Med 2008; 168: 617–624
29. Marti F, Vollenweider P, Marques-Vidal PM et al. Hyperhomocysteinemia is independently associated with albuminuria in the population-based CoLaus study. BMC Public Health 2011; 11: 733
30. Stengel B, Metzger M, Froissart M et al. Epidemiology and prognostic sig-nificance of chronic kidney disease in the elderly—the Three-City pro-spective cohort study. Nephrol Dial Transplant 2011; 26: 3286–3295
ORIGINAL
ARTICLE
31. Grams ME, Chow EK, Segev DL et al. Lifetime incidence of CKD stages 3–5 in the United States. Am J Kidney Dis 2013; 62: 245–252
32. Levey AS, Stevens LA, Schmid CH et al. A new equation to estimate glom-erularfiltration rate. Ann Intern Med 2009; 150: 604–612
33. Remuzzi G, Benigni A, Finkelstein FO et al. Kidney failure: aims for the next 10 years and barriers to success. Lancet 2013; 382: 353–362 34. Go AS, Mozaffarian D, Roger VL et al. Executive summary: heart disease
and stroke statistics—2013 update: a report from the American Heart As-sociation. Circulation 2013; 127: 143–152
35. Menotti A, Lanti M, Puddu PE et al. Coronary heart disease incidence in northern and southern European populations: a reanalysis of the seven countries study for a European coronary risk chart. Heart 2000; 84: 238–244 36. Yoshino M, Kuhlmann MK, Kotanko P et al. International differences in dialysis mortality reflect background general population atherosclerotic cardiovascular mortality. J Am Soc Nephrol 2006; 17: 3510–3519
37. van Dijk PC, Zwinderman AH, Dekker FW et al. Effect of general popula-tion mortality on the north-south mortality gradient in patients on re-placement therapy in Europe. Kidney Int 2007; 71: 53–59
38. Estruch R, Ros E, Salas-Salvadó J et al. Primary prevention of cardiovascu-lar disease with a Mediterranean diet. N Engl J Med 2013; 368: 1279–1290 39. Huang X, Jiménez-Moleón JJ, Lindholm B et al. Mediterranean diet, kidney function, and mortality in men with CKD. Clin J Am Soc Nephrol 2013; 8: 1548–1555
40. da Silva R, Bach-Faig A, Raidó Quintana B et al. Worldwide variation of adherence to the Mediterranean diet, in 1961–1965 and 2000–2003. Public Health Nutr 2009; 12: 1676–1684
41. Murray CJL, Richards MA, Newton JN et al. UK health performance: find-ings of the Global Burden of Disease Study 2010. Lancet 2013; 381: 997–1020
Received for publication: 26.4.2014; Accepted in revised form: 19.11.2014
Nephrol Dial Transplant (2015) 30: 814–821 doi: 10.1093/ndt/gfu399
Advance Access publication 20 January 2015
Predictors of renal and patient outcomes in anti-GBM
disease: clinicopathologic analysis of a two-centre cohort
Bassam Alchi
1, Meryl Grif
fiths
2, Murugan Sivalingam
3, David Jayne
4and Ken Farrington
3,51Renal Unit, Royal Berkshire Hospital, Reading, Berkshire, UK,2Department of Histopathology, Addenbrooke’s Hospital, Cambridge, UK,
3Renal Unit, Lister Hospital, Stevenage, Hertfordshire, UK,4Lupus and Vasculitis Clinic, Addenbrooke’s Hospital, Cambridge University
Hospitals, Cambridge, UK and5Postgraduate Medical School, University of Hertfordshire, Hatfield, Hertfordshire, UK
Correspondence and offprint requests to: Bassam Alchi; E-mail: [email protected]
A B S T R AC T
Background. Patients with anti-glomerular basement mem-brane (GBM) disease are at increased risk of morbidity and mortality from renal failure, pulmonary haemorrhage or com-plications of treatment. One-third also have circulating anti-neutrophil cytoplasmic antibodies (ANCA). The aim of this study was to determine the clinicopathologic predictors of patient and renal outcomes in anti-GBM disease with or without ANCA.
Methods.Retrospective review of 43 patients diagnosed with anti-GBM disease over 20 years in two centres, including nine with dual anti-GBM and ANCA positivity. Renal biopsies from 27 patients were scored for the presence of active and chronic lesions.
Results. Dual-positive patients were almost 20 years older than those with anti-GBM positivity alone (P = 0.003). The overall 1-year patient and renal survivals were 88 and 16%,
respectively. Oligoanuria at diagnosis was the strongest pre-dictor of mortality; none of the 16 patients without oligoanuria died. In a Cox regression model excluding oligoanuria, age was the only other independent predictor of survival. Pulmonary haemorrhage and dialysis dependence did not influence mor-tality. Thirty-five of the forty-three (81%) patients required dialysis at presentation, including all nine dual-positive pa-tients. Of them, only two (5.7%) regained renal function at 1 year. By logistic regression, oligoanuria at diagnosis and per-centage of crescents were independent predictors of dialysis independence at 3 months. However, in biopsied patients, the presence of crescents (>75%) added little to the presence of oligoanuria in predicting dialysis independence. Histological activity and chronicity indices did not predict renal outcome. Two of the nine (22%) dual-positive patients relapsed com-pared with none of the anti-GBM alone patients. Seven pa-tients received kidney transplants without disease recurrence. Conclusions. Oligoanuria is the strongest predictor of patient and renal survival while percentage of glomerular crescents
ORIGINAL
ARTICLE