1
Environmental audits and process flow mapping to assess management of solid waste and wastewater from a healthcare facility: an Italian case study
Mentore Vaccaria,1, Waleed Montasserb, Terry Tudorb, Luigi Leonec
a Department of Civil Engineering, Architecture, Land, Environment and Mathematics. University of
Brescia. Italy
b Faculty of Arts, Science and Technology. University of Northampton. Northampton: UK. NN2 6JD c Gardone val Trompia Hospital, Italy
Abstract
In Europe, there are an increasing number of policy and legislative drivers for a more sustainable approach to the management of natural resources as well as for the mitigation of environmental health risks. However, despite significant progress in recent years, there is still some way to go to achieve circularity of process, as well as risk mitigation within organisations. Using a case study of the Gardone Val Trompia hospital in northern Italy, this manuscript offers a novel holistic examination of strategies to enhance resource efficiency and environmental health within a key sector, i.e. the healthcare sector. Through the use of environmental audits and process flow mapping, trends in waste and waste water arisings, and the associated financial and environmental costs, and risks were identified. Recommendations for developing more resource efficient approaches, as well as mitigating the environmental and public health risks are suggested. These include strategies for
1 Correspondence address: Department of Civil Engineering, Architecture, Land, Environment and
Mathematics. University of Brescia. Brescia. Italy. Mentore Vaccari; Email: [email protected]
2
improved resource efficiency (including reduction in the hazardous waste), and reduced environmental impacts during the containment, transport and treatment of the waste.
Key words:
3
1. Introduction
Globally, there is an increasing need for governance strategies that enable a more sustainable management of resources (World Bank, 2016; UNEP, 2014). Organisations play a key role in the development of such governance strategies (Tudor, 2009; Jones et al., 2012; Wallace and Raingold, 2012). Specifically within the healthcare sector there is a growing realisation of the need for the development and effective implementation of such approaches, in order to not only ensure environmental compliance but also costs savings (Appleby, 2013; SDU, 2014; Unger and Landis, 2016; Mutters et al., 2016).
Sustainability within the healthcare sector exists on two levels (HPOE, 2014): operational sustainability and environmental sustainability. Operational sustainability focuses on redesigning facility operations to consume the fewest resources and services. Environmental sustainability aims to reduce the volume of materials discarded as waste, leading to economic benefits. A key aspect in attaining a more sustainable approach within the sector relates to the evaluation of the consumption of resources and the management of the resulting waste. While there have been a number of previous studies evaluating factors such as waste generation rates, these have generally tended to focus solely on solid waste and on the environmental sustainability (e.g. Moreira and Gunter, 2013; Maamari et al., 2015; Caniato et al., 2015; Ren et al., 2016; He et al., 2016), with limited research on operational sustainability and the combined evaluation of solid and liquid wastes.
Using the Gardone Val Trompia (GVT) Hospital, in Brescia, Italy, as a case study, this project examined approaches for the more sustainable management of waste and water at a healthcare facility (HCF).
4
2. Managing water and waste from healthcare activities
2.1 Water
2.1.1 Healthcare water consumption
HCFs are significant users of water and produce equally large quantities of waste water which requires treatment (Wyasu and Okerele, 2012; Carraro et al., 2016; Patwary et al., 2011). Water consumption depends heavily on factors such as the kind of healthcare services provided, number of beds, facility type, geographical location, climatic conditions and local water-use practices (WHO, 2011).
Hospitals that have conducted successful water use reduction programs have been able to reduce usage by approximately 20 to 30%, with a return on investment (ROI) in the range of approximately 25 - 40% (HERC, 2016). For large HCFs, this can translate to over €100,000 per year savings in water, sewer and energy costs.
2.1.2 Healthcare wastewater treatment
A proportion of the wastewater produced will pose a higher risk than domestic wastewater, as depending on the services provided, the wastewater may contain chemicals, pharmaceuticals and contagious biological agents, and might even contain radioisotopes (WHO, 2013). In high-income countries, wastewater generation in secondary- and tertiary-level hospitals is mainly measured on an inpatient ratio (litre of generated wastewater per patient treatment day), with the following typical generation rates (WHO, 2013):
- Small-medium sized hospitals: 300–500 l per inpatient per day - Large hospitals: 400–700 l per inpatient per day
5
In primary healthcare clinics, the rate of wastewater generation is often measured as the sum of the number of inpatients and outpatients. Minimum water quantities required in the healthcare setting are:
- 40–60 l per inpatient per day - 5 l per outpatient
- 100 l per surgical procedure
The monitoring of the wastewater system includes two key aspects: monitoring the sewerage system and the effluent quality (WHO, 2013).
2.2 Healthcare solid waste management
2.2.1 Waste generation rates
On average between 75% and 90% of the waste produced by HCFs is comparable to domestic waste and usually called “non-hazardous” or “general health-care waste” (WHO, 2013). The remaining 10– 25% is regarded as “hazardous” and may pose a variety of environmental and health risks.
Healthcare waste generation is based on two key factors (Tudor, 2007; Eker and Bilgili, 2011):
- Level of activity (often measured in terms of the number of occupied beds, number of patients per day, and/or number of staff)
- Type of department (e.g. general ward, surgical theatre, office).
Various studies have reported different quantities of per capita waste arisings. For example, Serafimidou et al. (1992) reported a value of 4.50 kg/occupied bed/day; Tsakona et al. (2007) recorded values of 0.5-7 kg/occupied bed/day; Caniato et al. (2016) indicated 1.3 kg/occupied
6
bed/day. Eker and Bilgili (2011) reported the value 0.23±0.62 kg/outpatient/day. The Italian Institute for Environmental Protection and Research (ISPRA, 2008), stated an average value from 1.17 to 1.28 kg/occupied bed/day.
2.2.2 Waste management
The principal Italian law regarding the management of healthcare waste is the D.P.R. 254/2003 (Decreto del Presidente della Repubblica, 2003). Under the Waste Directive 2008/98/EC (EC, 2008), hazardous waste is defined on the basis of the European Waste Catalogue (EWC).
3. The case study hospital: The Gardone Val Trompia Hospital
As shown in Fig. 1, the GVT Hospital is located in the North of the Brescia Province, some 18 km from the provincial capital, Brescia, in the valley called Val Trompia. It is considered to be a ‘basic unit hospital’ as the catchment area of the hospital is about 110,000 inhabitants. It covers a surface of 7,502 m2. It was designed to contain 260 beds, but at the time of the study had only about 130 beds.
FIG 1 HERE
At the time of the study, the GVT Hospital was comprised of a range of departments delivering various services. Between 2011-2013, the number of patients fell from 6,003, to 4,251, while staff decreased from 455 to 420. In 2013, the number of beds was 131, while some 125,321 procedures were performed.
Services and the non-patient departments were active from Monday to Friday. The dialysis service was active also on Saturday mornings. Some 2% of the patients were hospitalised in the day hospital, while some 82% of the patients spent from 1 - 15 days in the hospital.
7
4. Methods
Data were collected during the period January - May 2014. The procedure consisted of two phases, namely assessment of: (1) water consumption and the efficiency of the wastewater treatment plant and (2) the solid waste generation rates from selected departments.
4.1 Water consumption
First the supply of freshwater to the hospital and then within the distribution system inside the facility was examined, in order to evaluate the flow of water from withdrawal from the municipal aqueduct, to the discharge into the surface water body. Some of the input and output of the balance were excluded from the analysis because they were considered negligible, for example, bottled water consumed by patients and hospital staff, which was considered to be captured in the waste water.
Data about the yearly total consumption of water were analysed and then compared to the number of patients, beds and days of hospitalization to estimate per capita arisings. All of the possible uses of water were evaluated and, with the help of the technicians, the uses with the highest consumption of water were identified. As a result, four departments were selected for more detailed analyses:
- Canteen - Dialysis
- Orthopaedics and traumatology ward - Sterilization
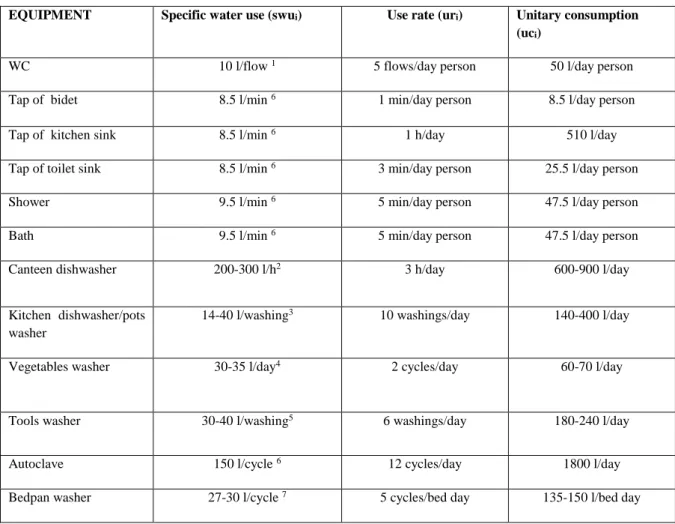
Using literature data about water consumption of devices (Table 1), the daily consumption (dc) and yearly consumption (yc) for each department selected was estimated. The aim was to identify where it would have been most effective to intervene to reduce the consumption of water.
8
TABLE 1 HERE
The water consumption rates were estimated according to the following equations:
𝑢𝑐𝑖 = 𝑠𝑤𝑢𝑖 ∗ 𝑢𝑟𝑖 (3.1)
𝑡𝑐𝑖 = 𝑢𝑐𝑖 ∗ 𝑛𝑢𝑚𝑏𝑒𝑟 𝑜𝑓 𝑑𝑒𝑣𝑖𝑐𝑒𝑠 (3.2)
𝑑𝑐 = ∑ 𝑡𝑐𝑖 (3.3)
𝑦𝑐 = 𝑑𝑐 ∗ 365 𝑑𝑎𝑦𝑠 (3.4)
Note: uci = unitary consumption; swui = specific water use; uri = use rate; tci = total consumption for
each type of device; dc = total daily consumption; yc = annual consumption. The annual consumption of dialysis department, which was closed on Saturday afternoon and Sunday, was estimated by multiplying total daily consumption by 287 days.
The consumption of the air conditioning system was not taken into account due to lack of data.
4.2 Waste water treatment
Data about the composition and the dimension of the plant were acquired from the site, and then, every step of the treatment was examined. Using flow-meters, daily and monthly waste water discharge rates were also determined. Starting from data about the flow-rates and monthly input and output pollutant concentration, the removal efficiency of different standard parameters (e.g. BOD5,
COD, total suspended solids, etc.), were calculated to assess the efficiency of the plant, according to the relevant Italian law (Decreto Legislativo, 2006).
9
The trends of the input and output yearly pollutant masses and the yearly removal efficiency of the plant were determined according to the following equations:
𝑀𝑖𝑛 = ∑ (𝐶𝑖 𝑖𝑛 𝑖∗ 𝑄𝑖) (3.1) 𝑀𝑜𝑢𝑡 = ∑ (𝐶𝑖 𝑜𝑢𝑡 𝑖𝑥𝑄𝑖) (3.2) 𝜂 = 𝑀𝑟𝑒𝑚𝑜𝑣𝑒𝑑 𝑀𝑖𝑛 = 𝑀𝑖𝑛 −𝑀𝑜𝑢𝑡 𝑀𝑖𝑛 (3.3) Notes:
- Min. yearly mass input
- Mout: yearly mass output
- Cin i: monthly concentration input
- Cout i: monthly concentration output
- Qi: monthly flow rate
- η: yearly removal efficiency
4.3 Solid waste management
4.3.1 Assessment of waste arisings
The procedure to assess the unitary value of kg/person/month of waste produced by the hospital was subdivided into two main phases: First, to understand the flows of the waste inside the hospital, from their generation to their disposal before their offsite transport. Second, to evaluate the daily production of waste for a specific period of time to obtain an average value for each type of waste. The weighing campaign took place during 08 - 21 May, 2014 (excluded the 11th May), between 8:30 - 10:30am. Some 1,564 bags and 610 waste bins were weighed. Weighing was done in the waste storage area of the hospital, using a digital balance (maximum 150 kg; accuracy 0.01 kg). The bags
10
were brought by an employee and all of them were weighed. Since the canteen disposed of its waste three times a day: morning, afternoon and evening, the same canteen staff was in charge at recording of the quantities of the afternoon for the first week. The types of waste surveyed were:
- Unsorted - Organic - Paper
- Cardboard and wood - Plastic
- Glass and tin
- Potentially infectious
Data were recorded in a Word table during sorting, and later transferred to an Excel spread sheet. The data collected were analysed to assess the total weight and the weight for each department for each type of waste. Based on previous studies (e.g. Tudor, 2007; Eker and Bilgili, 2011), kg/person/month was the unit chosen as it gives more appropriate results than other evaluation methods. The relation between the daily variation of waste production and the daily variation of staff and patients or performance number of each department was analysed using the formula in 3.4.
𝑢𝑣𝑚 =𝑡𝑤
𝑁𝑝∗ 30 𝑑𝑎𝑦𝑠 (3.4) Notes:
- uvm: monthly unitary value [kg/person/month]
- tw: total waste produced [kg]
11
*For the potentially infectious waste the staff number was not considered because that type of waste was produced by the care of patients. To allow comparison with literature data the production per occupied bed per day was assessed using the formula 3.5. Another parameter evaluated was the production per outpatient per day (see formula 3.6).
𝑢𝑣𝑏 =𝑡𝑤
𝑁𝑏 (3.5) Notes:
- uvb: daily unitary value [kg/occupied bed/day]
- tw: total waste produced [kg]
- Nb: number of occupied bed [occupied bed]
𝑢𝑣𝑜 =𝑡𝑤
𝑁𝑜 (3.6) Notes:
- uvo: daily unitary value [kg/outpatient/day]
- tw: total waste produced [kg]
- No: number of outpatients [outpatients]
4.3.2 Analysis of the unsorted waste
The general composition of the unsorted waste and contamination levels were also determined. The bags analysed as a part of the total unsorted waste were subdivided according to their origin and then samples were selected at random. They were opened and emptied onto a ground cloth, having around some empty pre-labelled bags. The content was divided manually and placed into the appropriate pre-labelled bags, which were then weighed and recorded.
12 5.1 Water consumption
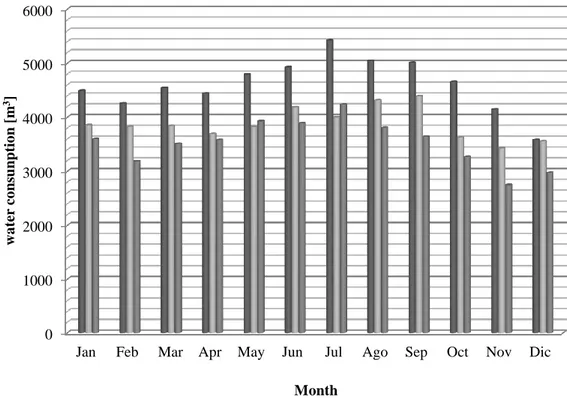
The survey considered only freshwater, grey and black water, not rain water because it was discharged in the municipal sewage without treatment. Figure 2 shows a greater use of water in summer, generally from May - September. The highest value was 5,422 m3, while the lowest was 2,748 m3,
and the specific value in 2013 was 886 l/bed day. On average, generation of waste water was 1m3/day, or 2,165m3/month. The overall quantity of water consumed between 2011 – 2013 decreased from 55,318 m3 to 42,367 m3.
FIG 2 HERE
To evaluate consumption levels a formula was used, where the value “number of user” is expressed:
𝑇𝑜𝑡𝑎𝑙 𝑐𝑜𝑛𝑠𝑢𝑚𝑝𝑡𝑖𝑜𝑛 = 𝑈𝑛𝑖𝑡𝑎𝑟𝑦 𝑐𝑜𝑛𝑠𝑢𝑚𝑝𝑡𝑖𝑜𝑛 𝑥 𝑛𝑢𝑚𝑏𝑒𝑟 𝑜𝑓 𝑢𝑠𝑒𝑟𝑠 (4.1)
The two highest areas of water consumption were found to be the Orthopaedics and Traumatology ward and the canteen.
The Orthopaedics and Traumatology ward was composed of 17 rooms, 33 beds and every room had a bathroom with a WC, a hand basin and a bidet. There was one small kitchen with a dishwasher, one toilet for public use, two washing rooms with three taps (but only one was used), one bath and a bedpan washer. There were approximately 33 users of the patient rooms, four of the doctors’ rooms and five of the washing rooms. The main areas of water consumption were the wash rooms and patient rooms.
The daily consumption was found to be 8.4 – 9.2m3, with a yearly consumption of 3,070 – 3,350m3. The highest usage of water was caused by the bedpan washer and personal uses of the patients.
13
The canteen cooked about 500 meals per day for patients and hospital staff. The pieces of equipment having the highest water usage were the sinks, taps and dishwasher. The daily consumption was found to be 5.0 – 5.6m3, with a yearly consumption of 1,830 – 2,050m3. Electricity usage was 4.7kWh/day.
5.2 Waste water management
The treatment plant treated the wastewater before its discharge into the surface water body (the Mella river), that is 200 metres away from the hospital. As illustrated in figure 3, the plant occupied an area of 154.2 m2 and was comprised of a primary screen, two lift pumps, an oxidation tank, a sedimentation tank, three recirculation pumps and a storage tank for the sludge. The monthly average flow rate was 3,230 m3 and the daily average flow rate was 106 m3/d.
FIG 3 HERE
Figure 4 illustrates that the monthly waste water flow rates were generally higher in the first half of the year. In January 2014, data were not available.
FIG 4 HERE
Table 2 shows the quality of the wastewater entering the treatment plant, as well as the output. All of the monitored inputs parameters increased from July.
The removal efficiencies of the treatment plant were high (BOD5 = 86%; COD = 86%; NH4+ = 96%;
P = 72%). The output concentrations were within the legal Italian limits, thus indicating that it was working effectively.
14 5.3 Solid waste management
5.3.1 Non-hazardous waste
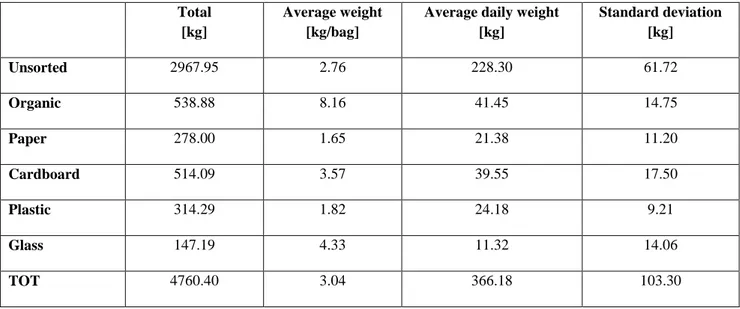
The average weight of the non-hazardous waste was 3.04 kg per bag or 366.18 kg per day. The unsorted fraction represented on average 62% of the total daily non-hazardous waste (Table 3). Paper, plastic and cardboard together represented 30-40% of the total non-hazardous waste.
TABLE 3 HERE
5.3.1.2 Waste production from selected departments
The entire hospital produced 10.58 kg/person/month of non-hazardous waste. The non-patient departments produced the highest quantity of non-hazardous waste per person per month, especially unsorted and paper waste. Services were the smallest producer of waste per person. ‘Other’ comprised the non-patient departments and it produced mainly unsorted and paper waste. The unsorted fraction was produced mainly by the wards and the services. ‘Other’, the operating theatres and wards produced the highest per capita quantity of waste (Table 4). Overall, waste arisings were 2.29 kg/occupied bed/day.
TABLE 4 HERE
5.3.2 Analysis of the unsorted waste
On 15th May 2014, the composition of the unsorted waste for each clinical department was analysed. The overall weight was 277.37 kg and the sample analysed was 78.45 kg (some 28% of the total). Paper was the main type of waste, followed by textiles and plastic. However, different departments had different compositions (Table 5). For Medicine, Surgery, Orthopaedics and the Sub-acute care unit the composition of unsorted waste was similar. Textile materials were the main type of waste,
15
then there were plastic and paper. The Cardiology ward had a different composition of unsorted waste. The main fraction was organic, then paper and plastic. The unsorted waste produced by the outpatient services contained especially paper, then plastic and metals. For the services of analysis laboratory and dialysis, the composition was different from the other outpatient services. The unsorted waste of the analysis laboratory contained paper and some fractions of plastic and cardboard. For the dialysis, the main fraction consisted of plastic bags containing residues for the therapy. The unsorted bags of the operating theatre contained mainly paper and composite paper/plastic.
TABLE 5 HERE
5.3.3 Overall waste production
The site produced 5.26 kg/person/month of potentially infectious waste, with an average weight of 2.91 kg/bin. Wards, operating theatres and the dialysis were the main producers of potentially infectious waste with 31%, 23% and 22% of the total respectively.
Considering together non-hazardous and potentially infectious waste, the amount was 6,537 kg and the unitary waste production was 11.52 kg/person/month. Figure 5 illustrates that the operating theatre was the main overall per capita producer of waste.
FIG. 5 HERE
In the wards, there was a ratio 3:1 of between non-hazardous and potentially infectious waste production per person per month. The services produced about the same quantity of both the wastes. The canteen and the other departments produced only non-hazardous waste with the former producing half of the waste produced by the latter.
16
6. Discussion
6.1 Water management
The water consumption for the hospital decreased in the three year period 2011-2013. The average water consumption for American hospitals is 315 gallons/bed day (1,192 litres/bed day) (USEPA, 2012), while in Italy the consumption is 500-1,000 litres/bed day (Paoletti, 2010). Thus, for the Gardone V.T. Hospital, the value found is in line with the national range, higher than the typical WHO (2011) small-medium sized facility, but lower than in the USA.
Water consumption was due to ‘domestic uses’ (e.g. WCs, sinks, hand basins, bidets) and ‘Non-domestic uses’ (e.g. food preparation, autoclaves, bedpan washer, osmotic treatment). The highest portion of water (85%) was consumed by non-domestic uses, while 15% was consumed for domestic uses. These values are roughly in line with international averages (WHO, 2011).
The greater consumption of water between May – September was probably because consumption also included the watering of green areas and, especially, the use of cooling water for the conditioning system. The Orthopaedics and Traumatology ward and the canteen were the highest consumers of water due to the bathrooms and bedpan washer, and food preparation, respectively.
The wastewater produced by the hospital was about 810 l/inpatient/day, which is higher than that for a small-medium sized hospital reported by WHO (2013). However, the output concentrations of the waste water treatment plant were below the legal limits imposed by the Italian law (Decreto Legislativo, 2006).
17
Evidently, the conservation of water should be focused around specific departments (e.g. wards and the canteen), and potentially be aimed towards the initial months of the year. The achievement of the targets of water saving depends on the development and application of two different, but complementary, factors:
Technological practices: based on modification of plants or of supply procedures (e.g. checking for leaks, installation of flow restrictors, reclaiming or recycling water, use of dual flush or a three pipe system - cold, hot water and non-potable water reticulation)
Behavioural practices: based on change of the staff habits of use.
It would be important to first conduct a detailed water audit to identify uses, usage patterns, and quantify potential water-saving opportunities. This should include the installation of data-logging water meters at the input and output of the utilities (wards and services) to know the total consumption of different areas of the network. This would enable identification of areas where there might be high consumption.
Given the link to the use of bathrooms and preparation of food, there should probably be the use of a combination of both technological measures (e.g. use of flow restrictors and dual flushing), as well as behaviour change measures (e.g. awareness raising for staff and patients, as well as training for staff in the canteen). Another strategy that could be employed to save money could be to use the fresh water instead of bottled water for the meals of the canteen. The cost of bottled water for the meals of the canteen is about €14,000. A micro-filtration treatment for 200 people costs €2,600. The volume of water used is about 100 m3. The cost of 1 m3 was €1.78, so the total cost would be €178.00 +
€2,600 = €2,778, down from €14,000. The money saved would be about €11,200.
18
The entire hospital produced 10.58 kg/person/month of non-hazardous waste and 5.26 kg/month of potentially infectious waste. The production during the working days was quite regular (400 kg/day for the non-hazardous waste and 160 kg/day for the potentially infectious waste). During the weekend the production decreased (190 kg/day for the non-hazardous waste and 70 kg/day for the potentially infectious waste). The fall in the quantity of waste at the weekend was because the outpatient services, the dialysis, the radiology and the analysis laboratory were not active.
There was a high fraction of unsorted waste (62%) that was primarily comprised of textiles (40%), paper (20%) and plastics (17%). Given the high fractions of paper and plastics, there is good potential for recovery of value, provide that these fractions could be segregated out. Putting in place separate waste collection in the common areas, such as near the food and drink distributors and into the waiting rooms, could reduce the quantity of paper and plastic and increase the recycling of these materials. For the analysis laboratory and the outpatient services, better segregation of the paper fraction could reduce the quantity of the unsorted waste and could improve the recycling, as well as for the operating theatre. For the Cardiology ward there is the potential to improve the segregation of organic fraction. At a wider level, there should be efforts made to work with medical staff to change clinical practices to use less materials including use of environmentally preferable purchasing and green procurement (WHO, 2013). For example, it was found that changing the supply of the needles to avoid the composite packaging could remove 3% of the unsorted waste.
Concerning the production of different departments, the non-patient departments produced the highest quantity of non-hazardous waste per person per month (32.50 kg/person/month), especially unsorted (60%) and paper (28%). The values found (2.29 kg/occupied bed/day and 0.57 kg/outpatient/day) were in line with those reported by others (e.g. Serafimidou et al, 1992 Tsakona et al., 2006; Eker and Bilgili, 2011).
19
The daily production of potentially infectious waste per outpatient was 0.17 kg/outpatient/day. This rate is in line with Eker and Bilgili (2011). The value 0.80 kg/occupied bed/day was slightly lower than the value reported by ISPRA (2008), but between those reported by Serafimidou et al. (1992) and Tsakona et al. (2006) and lower than the Italian Institute for Environmental Protection and Research (ISPRA, 2008).
7. Conclusions
The activities within HCFs can lead to significant impacts on the environment. There is a need therefore for the development and implementation of systems that enable evaluation and enhanced practice within the sector. As the study examined waste in its totality (i.e. solid and liquid waste), it was better able to suggest key departments and processes for targeting to improve the sustainability of practice. The recommendations also take account of a more holistic approach encompassing technological and behavioural factors. It is only in this targeted, yet holistic manner, that more sustainable approaches can most effectively be developed and implemented.
Acknowledgments
The authors wish to thank Simone Baronio and Francesco Vitali for their fundamental support in data collection and analysis.
Authoring
Mentore Vaccari set up the research and with Terry Tudor carried out the literature survey, data analysis, results discussion and paper drafting. Waleed Montasser contributed to data analysis. Luigi Leone provided data and revised their analysis.
20
Appleby, J. (2013). Spending on health and social care over the next 50 years. Why think long term? The Kings Fund, London.
http://www.kingsfund.org.uk/sites/files/kf/field/field_publication_file/Spending%20on%20health% 20...%2050%20years%20low%20res%20for%20web.pdf (accessed 15.06.16)
Caniato, M., Tudor T and Vaccari M. (2015). International governance structures for healthcare waste management: a systematic review of the scientific literature. Journal of Environmental Management 153: 93 – 107
Caniato, M., Tudor T and Vaccari M. (2016). Assessment of health-care waste management in a humanitarian crisis: A case study of the Gaza Strip. Waste Management, in press, available online 20 September 2016. DOI: 10.1016/j.wasman.2016.09.017
Carraro, E., Bonetta, Si., Bertino, C., Lorenzi, E., Bonetta, Sa., Gilli, G. (2016). Hospital effluents management: chemical, physical, microbiological risks and legislation in different countries. Journal of Environmental Management. 168: 185 – 199.
Decreto del Presidente della Repubblica (2003) 15 luglio 2003, n. 254. Regolamento recante disciplina della gestione dei rifiuti sanitari a norma dell'articolo 24 della legge 31 luglio 2002, n. 179. Gazzetta Ufficiale 211/2003
Decreto Legislativo (2006) 3 aprile 2006, n. 152. Norme in materia ambientale. Gazzetta Ufficiale 88/2006
EC (2008) European Community. Directive 2008/98/EC of the European Parliament and of the Council of 19 November 2008 on waste and repealing certain Directives. Official Journal of the European Union, L 312/3
Eker, HH., Bilgili, MS. (2011). Statistical analysis of waste generation in healthcare services: a case study. Waste Management & Research, 29(8), 791 - 796
21
He, Z-g., Li, Q., Fang, J. (2016). The solutions and recommendations for logistics problems in the collection of medical waste in China. Procedia Environmental Sciences, 31, 447-456
HERC (Healthcare Environmental Resource Centre) (2016). Facilities management: water
conservation. http://www.hercenter.org/facilitiesandgrounds/waterconserve.cfm (accessed 29.07.16)
HPOE (2014). Environmental sustainability in hospitals: the value of efficiency.
http://www.hpoe.org/Reports-HPOE/ashe-sustainability-report-FINAL.pdf (accessed 02.08.16)
ISPRA (Istituto Superiore per la Protezione e la Ricerca Ambientale) (2008). Valutazioni quali-quantitative sulla produzione e gestione dei rifiuti speciali sanitari. Technical report. Rome, Italy.
Jones, J., Jackson, JI., Tudor, TL., Bates, MP. (2012). Strategies to enhance resource efficiency within organisations: a case study of the UK construction sector. Waste Management & Research, 30 (9),981- 990
Maamari, O., Brandam C, Lteif R., Salameh D. (2015). Health care waste generation rates and patterns: the case of Lebanon. Waste Management, 43, 550-554
Moreira, AMM., Gunter, WMR. (2013). An assessment of medical waste management at a primary health-care center in Sao Paulo, Brazil. Waste Management, 33, 162 – 167.
Mutters, NT., Günther, F., Frank, U., Mischnik A. (2016). Costs and possible benefits of a two-tier infection control management strategy consisting of active screening for multidrug-resistant organisms and tailored control measures. Journal of Hospital Infection, 93 (2), 191-196
Paoletti, A. (2010). Reti di distribuzione, In: Guadagni, A. (Ed.) Prontuario dell’ingegnere. Hoepli Ed., Milano, Italy
22
Patwary, MA., Hare WTO., Sarker, MH. (2011) Assessment of occupational and environmental safety associated with medical waste disposal in developing countries: a qualitative approach. Safety Science, 49 (8-9), 1200 – 1207.
Ren, Y., Li, Q., Ge Y., Jiang C., Ren Z. (2016). Use incentive approach to promote BAT/BEP for centralized incineration facilities of medical waste in China. Procedia Environmental Sciences, 31, 457-464
SDU (Sustainable Development Unit) (2014) Sustainable, resilient, healthy people and places: a sustainable development strategy for the NHS, public health and social care system.
http://www.sduhealth.org.uk/documents/publications/2014%20strategy%20and%20modulesNewFo lder/Strategy_FINAL_Jan2014.pdf (accessed 16.06.16)
Serafimidou, Ch., Tatsi, A., Tsirpanis, A. (1992). Hospital waste treatment for the region of Thessaloniki. Thessaloniki, Greece, 21–24.
Tsakona. M, Anagnostopoulou, E., Gidarakos E. (2007) Hospital waste management and toxicity evaluation: a case study. Waste Management, 27(7), 912 – 920.
Tudor, TL. (2007) Towards the development of a standardised measurement unit for healthcare waste generation. Resources, Conservation and Recycling, 50(3), 319 - 333
Tudor, TL. (2009) Sustainable waste management and climatic change. In Conservation of Natural Resources. Environmental Science, Engineering and Technology. Kudrow N.J. (Ed.). Nova
Publishers. 237 – 247. ISBN 978-1-60741-178-9.
UNEP (2014). Moving towards a climate neutral UN: the UN system’s footprint and efforts to reduce it. http://www.greeningtheblue.org/sites/default/files/brochure_sequential_0.pdf (accessed 06.09.16)
23
USEPA (2012). Water use tracking. Energy star: portfolio manager.
http://www.energystar.gov/buildings/facility-owners-and-managers/existing-buildings/use-portfolio-manager (accessed 27.09.16)
Unger S., Landis A. (2016). Assessing the environmental, human health, and economic impacts of reprocessed medical devices in a Phoenix hospital's supply chain. Journal of Cleaner Production. 112(3): 1995-2003
Wallace, S., Raingold, A. (2012). Resilience in the round: seizing the growth opportunities of a circular economy. The Aldersgate Group. London. UK
WHO (World Health Organization) (2011). Guidelines for drinking-water quality, fourth edition. http://www.who.int/water_sanitation_health/publications/2011/dwq_guidelines/en/ (accessed 28.09.16)
WHO (World Health Organization) (2013). Safe management of wastes from healthcare activities (2nd ed.). http://www.who.int/water_sanitation_health/publications/wastemanag/en/ (accessed 28.09.16)
World Bank (2016). Commodity markets outlook, April 2016 : resource development in an era of cheap commodities. https://openknowledge.worldbank.org/handle/10986/24171
Wyasuh, G., Okerele, NZJ. (2011). The influence of hospital waste water samples grown within Ahmadu Bello University Teaching Hospital. Advanced Applied Scientific Research, 3 (1), 1686 – 1690.
Figure 2: Volume of freshwater input between 2011-2013 at GVT Hospital 0 1000 2000 3000 4000 5000 6000
Jan Feb Mar Apr May Jun Jul Ago Sep Oct Nov Dic
w a ter co ns un ptio n [m 3] Month 2011 2012 2013
Legend:
: wastewater : treated water : sludge
Figure 3: Schematic of the GVT Hospital wastewater treatment plant. Numbers refer to daily average flowrate expressed as cubic meter per day.
100 110 6 106 106 Sludge tank Mella river Sedimentation Biological oxidation Screening External recovery plant Pure Oxygen
H
Municipal sewageFigure 4: Monthly wastewater flow rates at the GVT Hospital 0 20 40 60 80 100 120 140 160 180
Feb Mar Apr Jun Jul Aug Sep Oct Nov Dec
flo w ra te [m 3/d]
Figure 5: Overall per capita waste production at GVT Hospital 0 20 40 60 80 100 120 140 160
Wards Services Operating theatre Canteen Other [k g /perso n/m o nth] Urban Potentially infectious
Table 1: Water consumption of selected equipment
EQUIPMENT Specific water use (swui) Use rate (uri) Unitary consumption
(uci)
WC 10 l/flow 1 5 flows/day person 50 l/day person
Tap of bidet 8.5 l/min 6 1 min/day person 8.5 l/day person
Tap of kitchen sink 8.5 l/min 6 1 h/day 510 l/day
Tap of toilet sink 8.5 l/min 6 3 min/day person 25.5 l/day person
Shower 9.5 l/min 6 5 min/day person 47.5 l/day person
Bath 9.5 l/min 6 5 min/day person 47.5 l/day person
Canteen dishwasher 200-300 l/h2 3 h/day 600-900 l/day
Kitchen dishwasher/pots washer
14-40 l/washing3 10 washings/day 140-400 l/day
Vegetables washer 30-35 l/day4 2 cycles/day 60-70 l/day
Tools washer 30-40 l/washing5 6 washings/day 180-240 l/day
Autoclave 150 l/cycle 6 12 cycles/day 1800 l/day
Bedpan washer 27-30 l/cycle 7 5 cycles/bed day 135-150 l/bed day
1http://www.gbcitalia.org/uploads/3066_Sistema_di_verifica_agg._ottobre_2011.pdf 2http://www.asaspa.it/asasi/risparmiare/dati.html 3 http://www.fortecnoservice.com/ 4http://www.glgsistemi.it/component/virtuemart/ 5 http://webapi.steris.com/api/salesconnection 6 http://italian.alibaba.com/product-gs/fbcg-series-pure-steam-sterilizer-autoclave-for-hospitals 7http://www.metalarredinox.it
Table 2: Input and output wastewater concentrations [mg/l], for GVT Hospital
TSS BOD5 COD Ammonia
nitrogen Nitrous nitrogen Nitrate nitrogen Total phosphorus
In Out In Out In Out In Out In Out In Out In Out
Feb 45 11 44 18 112 40 15.1 2.0 <0.02 0.16 <0.5 1.0 2.2 0.7 Mar 54 9 62 14 145 30 16.8 1.2 <0.02 <0.02 <0.5 <0.5 2.4 0.6 Apr 62 7 90 12 200 27 16.7 <0.4 <0.02 <0.02 <0.5 <0.5 2.6 0.8 May 66 8 105 14 245 32 19.2 0.6 <0.02 0.06 <0.5 2.4 3.1 0.9 June 96 12 155 17 356 38 26.6 0.6 <0.02 0.06 <0.5 2.8 3.8 0.6 Jul 109 14 160 17 403 42 39.4 <0.4 <0.02 0.05 <0.5 <0.5 3.3 0.8 Aug 115 12 180 20 412 45 39.7 <0.4 <0.02 0.06 <0.5 2.9 3.9 0.9 Sept 95 18 145 25 334 62 28.6 2.4 <0.02 0.05 <0.5 2.8 3.5 1.3 Oct 106 9 160 14 366 33 35.3 <0.4 <0.02 <0.02 <0.5 1.1 3.2 1.1 Nov 84 11 130 17 309 37 25.2 0.8 <0.02 0.06 <0.5 <0.5 3.7 1.3 Legal limit 80 40 160 11.6 0.60 20.0 20
Table 3: Total and average daily waste production rates at GVT Hospital
Total [kg]
Average weight [kg/bag]
Average daily weight [kg] Standard deviation [kg] Unsorted 2967.95 2.76 228.30 61.72 Organic 538.88 8.16 41.45 14.75 Paper 278.00 1.65 21.38 11.20 Cardboard 514.09 3.57 39.55 17.50 Plastic 314.29 1.82 24.18 9.21 Glass 147.19 4.33 11.32 14.06 TOT 4760.40 3.04 366.18 103.30
Table 4: Unitary non-hazardous waste production for the GVT hospital
kg/study period Person kg/person/day kg/person/month
Wards 2399.1 2987 0.80 24.09
Services 776.9 8193 0.09 2.84
Operating theatre 187.7 210 0.89 26.82
Canteen 781.4 1545 0.51 15.17
Table 5: Composition of the unsorted waste for each department Medicine ward Surgery recovery Cardiology ward Orthopaedics ward Sub-acute
care unit Dialysis
Analysis lab. Outpatient services Operating theatre Paper 6% 10% 12% 15% 14% 10% 86% 64% 62% Plastic 20% 23% 16% 38% 12% 6% 6% 19% 4% Composite paper/plastic 3% 4% 0% 0% 0% 2% 0% 0% 31% Organic 0% 5% 60% 12% 2% 1% 0% 0% 0% Glass 0% 0% 0% 0% 4% 0% 0% 0% 0% Cardboard 0% 0% 0% 0% 0% 0% 8% 0% 0% Textile materials 60% 44% 0% 29% 67% 0% 0% 5% 0% Metals 1% 1% 8% 2% 0% 0% 0% 10% 2% Latex 10% 13% 4% 4% 1% 0% 0% 2% 1% Other 0% 0% 0% 0% 0% 81% 0% 0% 0%


![Table 2: Input and output wastewater concentrations [mg/l], for GVT Hospital](https://thumb-eu.123doks.com/thumbv2/123dokorg/5586496.67156/30.892.59.860.144.401/table-input-output-wastewater-concentrations-mg-gvt-hospital.webp)