UNIVERSITA’ DEGLI STUDI DI PISA
FACOLTA’ DI INGEGNERIA
CORSO DI LAUREA SPECIALISTICA IN INGEGNERIA
BIOMEDICA
&
EUROPEAN PATENT OFFICE
Tesi di Laurea
"STATE OF THE ART INVESTIGATION IN MEDICAL ULTRASOUND
DIAGNOSTICS USING PATENT PUBLICATIONS DATABASE"
Relatori:
Prof. : Luigi Landini Ing. :Francesco Zaccà Ing. : Igor Dydenko
CANDIDATO:
Angelo Zoppo
INDEX
Introduction
………..
Chapter 1: The European Patent office and the Patent System
1.1 Introduction……….
1.2 Structure of an European Patent………..
1.3 IPC, the International Patent Classification………..
1.4 ECLA, the EPO classification………
1.5 State of the art or prior art definition……….
1.6 First to file vs. first to invent patent system………..
1.7 How to search a patent into the database………….
Chapter 2: Ultrasound overview
2.1 Ultrasound transducers and their configuration……
2.2 Ultrasonic imaging modalities………
2.3 The Doppler effect……….
2.4 Statistics in A61B8/00……….
Chapter 3: Ultrasound Contrast Agents (USCA)
3.1 Introduction to USCA……….
3.2 USCAs applications in low mechanical index imaging….
3.3 USCAs application in high mechanical index imaging….
3.4 Statistics about USCA………
Chapter 4: Three Dimensional Imaging with ultrasound
4.1 Introduction to 3D imaging with ultrasound………..
4.2 3D acquisition protocols, scanning technique and
reconstruction……….
4.3 Mechanical scanners………
4.4 Free hand scanners………
4.5 2D arrays………
4.6 3D ultrasound catheters………
4.7 Statistics about 3D imaging with ultrasound……….
Chapter 5: Elastography
5.1 Introduction………...
5.2 Signal Processing………...
5.3 Elastography with mechanical stimulation………..
5.4 Elastography with wave stimulation……….
5.5 Elastography with physiologic stimulation………
5.6 Statistics about elastography……….
Chapter 6: Blood Flow Measurement
6.1 Introduction……...
6.2 Detection of blood flow………
6.3 Blood flow measurement in the heart………..
6.4 Doppler effect in pregnancy………
6.5 Transcranial Doppler Ultrasound……….
6.6 Statistics about blood flow Doppler………...
Chapter 7: Ultrasound Catheters
7.1 Introduction………
7.2 Ultrasound catheters with mechanical rotation of the whole
body……….
7.3 Ultrasound catheters with mechanical rotation of the array
7.4 Other solutions………..
7.5 Minimal invasive catheters………
7.6 Statistics about ultrasound catheters……….
Conclusions
………
Annex
Annex 1: USCA……….
Annex 2: 3D imaging……….
Annex 3: Elastography……….
Annex 4: Blood Flow………
Annex 5: Statistics………
Annex 6: ECLA main group A61B8……….
Bibliography……….
Patent Bibliography……….
Glossary
……….
Patent Glossary………
Acknowledgments………
INTRODUCTION
Patents are now an integral part of global economy. The creation of the world trade system has also redefined the value of intellectual property protection and generated an unprecedented demand for patent protection that is no longer limited o the traditionally patent-oriented economies of Europe, Japan and the USA.
Countries like China, India and Korea, and Singapore and Israel too, are just some of the new players heavily involved in patent-driven innovative competition.
Patents protect technical inventions. An invention can, for example, be a product, process or apparatus. Inventions are only patentable if they are novel, industrially applicable and involve an inventive step, but even then patent protection is not ranted automatically. The application must be accompanied by a full technical description of the invention, which the Office then examines for compliance with the European Patent Convention. Patents give their owners the right to prevent others from using their invention, and are thus of major economic importance. They also help to recoup research costs, allowing the inventor to reinvest in research and development.
The publication requirement allows competitors to build on patented inventions and come up with even better technical solutions. In doing so, patents boost the innovation which Europe badly needs to keep up with other economies, and contribute to the further development of a knowledge
society. The 56 million or so patent documents contained in the public EPO database constitute a vast trove of technical information.
The field of medical device, IPC class A61, according to European Patent Office Annual Report of 2005, is one of the technical fields with the most filings.
This state of the art investigation, performed using the patent publications database, is focused on the field of diagnostic ultrasound, a field that thanks to its non ionizing nature and low cost is a very high growing area and a lot of scientific research is made.
Scope of this work is to provide an useful tool that allows to check the level of the ultrasound technology and to indicate the future direction of this technique.
Scope of this work is also to provide information to all the researchers and inventors who want to set out a patent procedure of an invention. As known, the patent procedure, from the filing day until the decision of granting the patent is quite expensive, this work could be used as a primary consultation tool before to present a patent application. All chapters of this work contains an introduction that explain the technical problematic of a field and in the subsequent sections the solutions are described.
In the first chapter of this work the European Patent Office and the world of patents is introduced. A special attention is revolted to several articles of the EPC (European Patent Convention) and to the classification system adopted by the EPO. Some statistics about European patent application filed in 2005 are illustrated and the difference between the first to invent system adopted by EPO (and by the majority of countries) and the first to invent system (adopted by U.S.A.) will be treated at the end of this chapter. In the second chapter the basics of ultrasound are illustrated with particular attention to the physics principles that are at the base of ultrasound devices described in this state of the art investigation.
The state of the art is divided in 5 chapters, from 3 to 7, each chapter is about a specific technique. In the third chapter the ultrasound contrast agents are introduced and their main diagnostic application are disclosed. The fourth chapter is about three dimensional imaging, this field is divided in 4 section: mechanical, free-hand, 2D arrays and catheters.
In the fifth chapter the technique of elastography and its application is described focusing on the stimulation protocols and methods.
ultrasound catheters and their characteristics. At the end of each chapter statistics about the trends in European patent application in the last 25 years will be illustrated.
In the conclusion of this work the future developments field of ultrasound technique will be illustrated.
CHAPTER I
THE EUROPEAN PATENT OFFICE
& THE STATE OF THE ART
The mission of the EPO – the patent granting authority for Europe – is to support competitiveness and
economic growth for the benefit of the citizens
of Europe
1.1 INTRODUCTION
The European Patent Office (EPO) grants European patents for the contracting states to the European Patent Convention (EPC), which was signed in Munich on 5 October 1973 and entered into force on 7 October 1977. It is one of the big three patent offices (with USA and Japan) and it is the executive arm of the European Patent Organisation, an intergovernmental body set up under the EPC, whose members are the EPC contracting states. The contracting states are 31, in the course of the year 2005, Latvia became the European Patent Organisation’s 31st member state. The contracting states of EPO are (Fig. 1.1):
Figure 1.1 The contracting states to the EPC
The EPO is not an EU organization, and is wholly self financing. The activities of the EPO are supervised by the Organisation’s Administrative Council, composed of delegates from the contracting states
In view of the increasing interest in obtaining patent protection in central and eastern European countries, the European Patent Organisation has concluded bilateral agreements with Albania, Croatia, Lithuania and the former Yugoslav Republic of Macedonia, allowing the protection conferred by a European patent to be extended to these countries at the applicant’s request. In October 1999 the EPO began negotiations to introduce a similar system for validating European patents outside Europe.
Figura 1.2: European Patent Office organigram
The location of the European Patent Office and the staff are: • MUNICH DG 3 Boards of Appeal DG 4 Administration DG 5
Legal and Int. Affairs • THE HAGUE
DG 1
Operations
• BERLIN DG 1 Operations DG 2 Operational Support • VIENNA DG 4 Patent information DG 2 Operational Support
1.2 STRUCTURE OF AN EUROPEAN PATENT
A patent is an exclusive entitlement to an invention and allows to forbid other people from using it for commercial purposes within a certain area of jurisdiction.
A patents protect the inventor against others taking advantage of the invention without payment.
The European Patent is divided in 3 parts • Description
• Figures • Claims
The first page of a patent contains some FIELDS of a patent like the publication date, the inventor name, the title etc. The layout of the first page is shown in figure 1.3
The DESCRIPTION and the FIGURE are useful to understand the technical problem and the solution provided by the inventor.
The most important part of a patent are the CLAIMS. The claims are in the last part of the patent after the description.
Figure 1.4 Claims
The protection of the patent is guaranteed ONLY on what is written on the claims.
1.3 IPC, THE INTERNATIONAL PATENT CLASSIFICATION
The IPC is a worldwide patent classification system, which is elaborated and published under the responsibility of WIPO (Geneva).
The IPC was established initially on request of the Council of Europe, The first edition was in force from September 1, 1968, to June 30, 1974. The second edition was in force from July 1, 1974 till December 31, 1979. Since then there is a new edition every 5 years. The actual edition (the 8th) is in force since January 1, 2005.
The IPC has a hierarchical structure: SECTION e.g. A
CLASS A01 SUBCLASS A01B MAIN GROUP A01B1/00 SUBGROUP A01B1/02
The IPC is divided into eight sections, The section titles are to be considered as a very broad indication of the content: they do not define the exact scope:
A: HUMAN NECESSITIES
B: PERFORMING OPERATIONS; TRANSPORTING C: CHEMISTRY; METALLURGY
D: TEXTILES; PAPER
E: FIXED CONSTRUCTIONS
F: MECHANICAL ENGINEERING; LIGHTING; HEATING; WEAPONS; BLASTING
G: PHYSICS H: ELECTRICITY
As described above each section is divided into classes, A class symbol consists of the section symbol, followed by a two-digit number, as for example:
Classes comprise one or more subclasses. The subclass symbols consist of
the class symbols followed by a capital letter.
A61B DIAGNOSIS; SURGERY; IDENTIFICATION
Subclasses are broken down into main groups. Each main group symbol
consists of the subclass symbol followed by a one- to three-digit number, an oblige stroke and the number 00.
A61B8/00 Diagnosis using ultrasonic, sonic or infrasonic waves
Subgroups form subdivisions under the main groups. Each subgroup
symbol consists of the subclass symbol followed by the one- to three-digit number of its main group, the oblique stroke and a number of at least two digits other than 00.
The subgroup title is often a complete expression, in which case it begins with a capital letter. A subgroup title begins with a lower case letter if it reads as a continuation of the title of the hierarchically higher group. The hierarchy among subgroups is determined solely by the number of dots
1.4 ECLA, THE EPO CLASSIFICATION
Before 1968, the former “Institut International de Brevets” (IIB) used a classification system called “Indeling der Techniek” (IdT), developed by the Dutch Patent Office, and largely based on the “Deutsche Patentklassifikation” (DPK).
After the first edition of the International Patent Classification (IPC) had entered into force, the IIB decided to convert its search documentation from IdT to a system based on IPC. This classification system would later become the ECLA classification system.
In view of the big differences between both systems, and in order to guarantee the quality of the system, it was decided to transfer the documents gradually, by “closing” the IdT at a certain date (different per technical field), and “opening” ECLA at the same time. New documents were from then on classified according to ECLA, the “backlog” being reclassified systematically or “ad hoc”, e.g. during searches. More than 95% of the classified documentation is now classified according to ECLA. Since 1991 all the new documents are only classified according to ECLA.
The structure of ECLA is similar to that of the IPC described in section x.2, IPC Guidance Headings are only used to identify parts of subclasses relating to the same subject matter. They do not define the scope of groups as such. Internal subgroups have the same symbol as an IPC group, the text of these internal subgroups is put between [N: ].
A61B8/00 Diagnosis using ultrasonic, sonic or infrasonic waves, (imaging of
objects using sonar G01S15/00)
A61B8/08
.
Detecting organic movements or changes, e.g. tumours, cystsA61B8/08F
. .
[N: using mammography (mammography by transillumination,X-ray mammography; detection of breast cancer)]
A61B8/08F2
. . .
[N: with suspended breasts, e.g. patient in prone position]1.5 THE STATE OF THE ART
The state of the art is the highest level of development, as of a device, technique, or scientific field, achieved at a particular time.
First used in 1910 and in the context of the European Patent Convention, the term "state of the art" is a very important concept in the process of assessing and asserting novelty and inventive step, and is a synonym of the expression "prior art".
Before to define the term "state of the art", the terms novelty and inventive steps should be defined. The ART 54 of the European patent convention establish that:
Novelty, Art 54 of EPC
(1)An invention shall be considered to be new if it does not form part of the state of the art.
(2)The state of the art shall be held to comprise everything made available to the public by means of a written or oral description, by use, or in any other way, before the date of filing of the European patent application.
(3) Additionally, the content of European patent applications as filed, of which the dates of filing are prior to the date referred to in paragraph 2 and which were published under Article 93 on or after that date, shall be considered as comprised in the state of the art.
(4) Paragraph 3 shall be applied only in so far as a Contracting State designated in respect of the later application, was also designated in respect of the earlier application as published.
(5) The provisions of paragraphs 1 to 4 shall not exclude the patentability of any substance or composition, comprised in the state of the art, for use in a method referred to in Article 52, paragraph 4, provided that its use for any method referred to in that paragraph is not comprised in the state of the art.
Inventive step, Article 56 of EPC
An invention shall be considered as involving an inventive step if, having regard to the state of the art, it is not obvious to a person skilled in the art. If the state of the art also includes documents within the meaning of Article 54, paragraph 3, these documents are not to be considered in deciding whether there has been an inventive step.
"The state of the art shall be held to comprise everything made available to the public by means of a written or oral description, by use, or in any other way, before the date of filing of the European patent application" according to Art 54(2) EPC. Due account should be taken of Art. 54(3) as well, but merely for the examination of novelty.
The expression "background art" is also used in certain legal provisions, has the same meaning. The expression "internal state of the art" is used to describe the state of the art merely on possession of the (patent) applicant, but not in the public domain.
One of the most important articles of the Convention, Article 52(1) EPC, entitled "Patentable inventions", states:
"European patents shall be granted for any inventions
• which are susceptible of industrial application
• which are new, and which involve an inventive step
This article constitutes the basic, central patentability provision under the EPC.
However, the EPC provides further indications on what is patentable, by introducing exceptions. There are exceptions by virtue of the nature of the patent system (Article 52(2) and (3)) and exceptions by virtue of policy(Articles 52(4) and 53).
First, discoveries, scientific theories, mathematical methods, aesthetic creations, schemes, rules and methods for performing mental acts, playing games or doing business, programs for computers and presentations of information are not regarded as inventions and are excluded from patentability only to the extent that the invention relates to those areas as such. These exceptions, by virtue of the nature of the patent system, have been introduced as a way to illustrate what cannot be patentable due to the nature of the patent system, i.e. a patentable subject-matter should usually be directed to some physical product or process. The European Patent Office interprets this as requiring that the features providing the inventive step must be outside those areas.
• methods for treatment of the human or animal body by surgery or therapy, and diagnostic methods practiced on the human or animal body.
• inventions contrary to "order public" or morality
• plant or animal varieties and essentially biological processes for the production of plants an animals.
In patent law, industrial applicability or industrial application is a patentability requirement according to which a patent can only be granted for an invention which is susceptible of industrial application, i.e. for an invention which can be made or used in some kind of industry. In this context, the concept of "industry" is far-reaching: it includes indeed agriculture for instance.
The industrial application requirement is closely related to the requirement of sufficiency of disclosure, in fact a patent application must disclose the invention in a manner sufficiently clear and complete for it to be carried out by a person skilled in the art.
The utility in patent law, is a patentability requirement. Today, the utility requirement is the lowest bar and is easily met. Largely utility is used to prevent the patenting of inoperative devices such as perpetual motion machines.
European patent law does not test utility. Instead, it requires that to be patentable an invention must have industrial applicability.
In most patent laws, prior art or state of the art is all information that has been made available to the public in any form before a given date. If an invention has been described in prior art, a patent on that invention is not valid.
Information kept secret, for instance as a trade secret, is not usually prior art. Generally, this means that a patent will be granted on the invention despite the fact that someone else knew of the invention. A person who used an invention in secret may in some jurisdictions be able to claim "prior user rights" and thereby gain the right to continue using the invention. As a special exception, earlier filed and unpublished patent applications do qualify as prior art in certain circumstances.
The term "state of the art" is mainly used in the patent field. Patents disclose to society how an invention is practiced, in return for the right (during a limited term) to exclude others from manufacturing, selling, offering for sale or using the patented invention without the patentee's permission. Patent offices deal with prior art searches in the context of the patent granting procedure. To assess the validity of a patent application, patent offices explore the prior art that was disclosed before the invention occurred (in the United States and all first-to-invent patent systems) or before the filing date (in Europe and all first-to-file patent systems).
1.6 FIRST TO FILE V.S FIRST TO INVENT PATENT SYSTEM
First to file and first to invent are legal concepts that define who has the
right to the grant of a patent for an invention. The first to file system is used in the majority of countries, with the notable exception of the United States, which operates a first to invent system.
In a first to file system, the right to the grant of a patent for a given invention lies with the first person to file a patent application for protection of that invention, regardless of the date of actual invention.
The United States uses a first-to-invent system, unlike most other countries in the world. Invention is the U.S. generally defined to comprise two steps: (1) conception of the invention and (2) reduction to practice of the invention. When an inventor conceives of an invention and diligently reduces the invention to practice (by filing a patent application, by practicing the invention, etc), the inventor's date of invention will be the date of conception. Thus, provided an inventor is diligent in reducing an application to practice, he or she will be the first inventor and the inventor entitled to a patent, even if another files a patent application (reduces the invention to practice) before the inventor.
However, the first applicant to file has the prima facie right to the grant of a patent. Should a second patent application be filed for the same invention, the second applicant can institute interference proceedings to determine who was the first inventor and thereby who is entitled to the grant of a patent. This can be an expensive and time-consuming process.
The debate as to which system is better is long-running and unlikely to reach a single conclusion. There are arguments for and against both systems.
The first to file system leads to procedural certainty as the filing date of an application can very rarely be challenged. In contrast, the first to invent system leads to uncertainty as the right to grant of a patent can be challenged by a second party and can only be finally determined by extensive consideration of the making of the invention.
It is said, however, that the first to file system favors large companies who can afford to rapidly file patent applications, thereby gaining an advantage over smaller companies who are slower to file due to cost restraints. The first to invent system is therefore said to be beneficial in encouraging the growth of smaller companies. A potential problem with this argument is that a smaller company, filing second, would have to rely on interference proceedings to claim their patent, which may be beyond their economic reach and they are therefore no better off.
Concluding this section we can cite the change made in 1989 by Canada, in fact they change from a first to invent system to a first to file invention priority system leaving U.S.A and Philippines as the only countries that continue to grant patents on the basis of a first to invent system.
1.7: HOW TO SEARCH A PATENT INTO DATABASE
At EPO to perform the research of a patent it is possible to use the SEA (Search Examiners Application).
Three tools in particular are particularly useful: • Internal
• X-Full • Viewer
Internal is a tool that allows to search in all the fields of a patent, in the title and in the abstract.
Figure 1.5 Snapshots from Internal
X-Full is a tool that allows to search in the whole text of a patent. The desired word (or words) is written in the QUERY field as shown in figure 1.6
Figure 1.6 Snapshots from XFull
White X-Full it is possible to combine the results from internal with the desired query.
When the research is finished and the desired patent or patents are individuated it is possible to visualize them whit the VIEWER.
After saving the results of the research in a working list is possible to visualize the results.
Figure 1.7: Snapshot from VIEWER (Working List Selection)
The patents are then displayed and it is possible to highlight some words in different colors that helps the user to individuate the most interest part of the patent and visualize all the images.
CHAPTER II
ULTRASOUND OVERVIEW
Introduction
A typical medical ultrasound device sends ultrasound waves into the tissue and analyze the reflecting waves in order to obtain images of the region of interest or mechanical parameters of the tissue.
2.1 TRANSDUCERS AND THEIR CONFIGURATIONS
An ultrasound transducer generates acoustic waves by converting magnetic, thermal, and electrical energy into mechanical energy. The most efficient technique for medical ultrasound uses the piezoelectric effect, which was first demonstrated in 1880 by Jacques and Pierre Curie [Curie and Curie, 1880]. They applied a stress to a quartz crystal and detected an electrical potential across opposite faces of the material. The Curies also discovered the inverse piezoelectric effect by applying an electric field across the crystal to induce a mechanical deformation. In this manner, a piezoelectric
transducer converts an oscillating electric signal into an acoustic wave, and vice versa.
• Material
Ferroelectric materials strongly exhibit the piezoelectric effect, and they are ideal materials for medical ultrasound. For many years, the ferroelectric ceramic lead-zirconate-titanate (PZT) has been the standard transducer material for medical ultrasound.
Recent evolution in material technology allows to combinine the PZT and epoxy in different ratios and spatial distributions to create Polyvinylidene difluoride (PVDF).
PVDF is a ferroelectric polymer that has been used effectively in high-frequency transducers.
• Scanning with array transducers
The arrangement of the transducers is a very important aspect of ultrasound devices. An important step for ultrasound technology was the development of linear-array transducers. Previously, ultrasound systems had made an image by manually moving the transducer across the region of interest.
Linear array transducers were designed to electronically steer and focus the beam in a region of interest.
First developed for radar, sonar, and radio astronomy after world war II, in the first part of ’70 they were is formed by a large number of piezoelectric elements arranged like in figure 2.1. They can be activated at different times in order to obtain different wave-forms.
The possible piezoelectric elements configurations in linear array are: • Linear Sequential Arrays;
• Curvilinear or convex Arrays; • Phased Arrays;
• 2D Phased Arrays.
In sequential liner arrays the scanning lines are directed perpendicular to the face of the transducer; the acoustic beam is focused but not steered as shown in figure 2.2
F i g u r e 2 . 2 L i n e a r S e q u e n t i a l A r r a y
Curvilinear or convex arrays have a different shape than sequential linear arrays, but they operate in the same manner. The scan lines are directed perpendicular to the transducer face, the field of view is wider because of the convex shape
F i g u r e 2 . 3 : C u r vi l i n e a r A r r a y C o n f i g u r a t i o n
In a phased array all the elements are used to transmit and receive each line of data. As shown in figure 2.4 the scanner steers the ultrasound beam through a sector-shaped region in the azimuth plane.
F i g u r e 2 . 4 : P h a s e d a r r a y C o n f i g u r a t i o n
A 2D phased-array has a large number of elements in both the azimuth and elevation dimensions. Therefore, 2D arrays can focus and steer the acoustic beam in both dimensions. A 2D array can scan a pyramidal region in real time to produce a volumetric image.
2.2 ULTRASONIC IMAGING MODALITIES
There are 3 different imaging modalities in ultrasound • A-Mode;
• M-Mode; • B-Mode.
In A-Mode an ultrasound signal is send into the body and the backscattered signal is shown usually on oscilloscopes. This modality is now obsolete.
F i g u r e 2 . 5 A - M o d e vi ew w w w .u l t r a s o u n d . n e t
A single beam in an ultrasound scan can be used to produce an M-mode picture where movement of a structure such as a heart valve can be depicted in a wave-like manner.
F i g u r e 2 . 6 M - M o d e vi ew w w w .u l t r a s o u n d . n e t
In B-Mode the transducer is swept either mechanically or electronically over many directions to build up two-dimensional views (B-mode or 2D).
F i g u r e 2 . 7 B - M o d e vi ew w w w .u l t r a s o u n d . n e t
2.3 DOPPLER EFFECT
The Doppler effect is a change in the frequency of a wave, resulting from motion of the wave source or receiver or in the case of a reflected wave, motion of the reflector. In medicine, Doppler US is used to detect and measure blood flow, and the major reflector is the red blood cell. The Doppler shift is dependent on the insonating frequency, the velocity of moving blood, and the angle between the sound beam and direction of moving blood, as expressed in the Doppler equation:
The angle of incidence between the ultrasound beam and the estimated flow direction (parallel to the long axis of the vessel) is the Doppler angle.
F i g u r e 2 . 8 D o p p l e r A n g l e
Df is the Doppler shift frequency (the difference between transmitted and received frequencies), f is the transmitted frequency, v is the blood velocity, c is the speed of sound, and q is the angle between the sound beam and the direction of moving blood. The equation can be rearranged to solve for blood velocity, and this is the value calculated by the Doppler US device:
Current ultrasonic imaging systems operate in a pulse-echo (PE) or continuous-wave (CW) intensity mapping mode.
In continuous wave the ultrasound signal is continuously transmitted into the body, and the reflected energy is analyzed. The main limitation of CW is that it is not possible to separate Doppler signals arising from different points along the transmitted ultrasound beam. With PE it is possible to overcome this limitation.
Range resolution in pulsed Doppler is achieved by transmitting a short burst of ultrasound. The backpropagation signal reaches the transducer after a delay (2t), where t is the time that the ultrasound wave needs to reach the sampling volume. Thus the sampling volume can be moved to different positions along the beam by altering this delay.
Right now there are 2 different imaging modalities called Color Doppler and Power Doppler. In Color Doppler the shift of frequency is used for calculate the velocity, the direction of flow information extracted by the electronics from the sequence of returning echoes is included in the velocity images, normally red denote flow toward the transducer and blue away from the transducer (see figure 2.9a).
In power Doppler the amplitude of the signal is analyzed in order to calculate the number of moving cells in the sample volume. Power Doppler images are relatively straightforward to interpret: the power level at each pixel is presented as
a level of brightness. Since the power at each pixel is fairly similar (see figure 2.9 b), the images have a uniform brightness except perhaps at vessel walls or in turbulent areas. The main attraction of Power Doppler Imaging is that it is a sensitive technique which is good for depicting flow in small vessels, it therefore gives more complete images of vascularity than Doppler Velocity Imaging [Mc Dicken et al 2002].
F i g u r e 2 . 9 ( a ) C o l o u r V e l o c i t y D o p p l e r i m a g e o f b l o o d f l ow
i n t h e l e f t ve n t r i c l e , ( b ) a P ow er D o p p l e r i m a g e o f b l o o d f l ow i n t h e l e f t ve n t r i c l e .
2.4 STATISTICS
As cited in the introduction, the field of medical device, IPC class A61, is one of the technical fields with the most filings. In the top filers with the EPO we find companies that are involved in medical field e.g. Philips, Siemens, and General Electric etc.
The majority of patents and patent applications consulted in this work can be found in the main group A61B8/00, Diagnosis using ultrasonic, sonic or infrasonic waves.
The statistics of this chapter (and also of the other chapters) are directed only to EUROPEAN PATENT APPLICATION and the research is based on the publication date. The publication date of the patents is assumed to be the date that reflects best the time that a technology is available to the
public. The figures of 2006 maybe are underestimated because of the backlog in classification.
CHAPTER III
PERFUSION WITH ULTRASOUND CONTRAST
AGENTS (USCA)
3.1 INTRODUCTION TO USCA
Ultrasonic diagnostic imaging techniques enable imaging and measuring the anatomy and physiology within the body in a non-invasive manner. With the use of ultrasound contrast agents (USCA) it is possible to obtain additional information about perfusion in a minimally invasive way.
These substances are introduced into the body to enhance ultrasonic diagnosis quality [Harvey et al. 2004]. They strongly interact with ultrasonic waves and are bio-compatible, so they have no or little side-effects for the patient [Wei et al. 1997].
The first European patent application in this field was filed in 1984, but, as it is discussed in the statistics section, only in the last 6 years there has been a significant increase of patent applications.
An USCA is composed of tiny bubbles (called microbubbles) filled with air or other gas [Wei et al. 1997]. During a typical USCA investigation a suspension of microbubbles is infused into the patient body in a continuous manner or as a bolus. The microbubbles are 1-7 microns in diameter and they are capable of surviving the passage through the capillaries.
The physics of the interaction between the USCA and the acoustic wave is very complex and it depends on a great number of parameters, including the type of gas inside the shell, the material of the shell and the acoustic pressure of the ultrasonic wave. The following properties of USCAs are of particular interest in the context of ultrasound diagnosis:
• The high difference in acoustic impedance of the gas/fluid interface results in a strong response to the ultrasonic signal (High Echogenity);
• High intensity sound impulses destroy the bubbles with the result of a high-intensity broadband signal produced by their collapse [Harvey et al. 2004];
• Air bubbles in the sound field reverberate and return sound with harmonic frequencies. This phenomenon can be used in "harmonic imaging" [L.Dalla Palma et al. 1999].
Figure 3.1 interaction between US wave and microbubbles, http://www.mecheng.ucl.ac.uk
Today a variety of contrast agents is available on the market. They differ by the type of gas and shell (stabilization), table 3.2 summarises the most current ones.
Table 3.2: Most current ultrasound microbubbles [ H a r v e y e t a l . 2 0 0 4 ]
Blood is not very echogenic and perfusion images with good resolution and penetration are difficult to obtain. This problem is overcome thanks to the high echogenity of the USCA that allows tracking blood flow through vessels and organs with ultrasound transducers.
• SPECIAL WAVEFORM STIMULATION
It is possible to further enhance the quality of the image by coupling the USCA with special waveform stimulation like pulse inversion, codec excitation or chirp waveform.
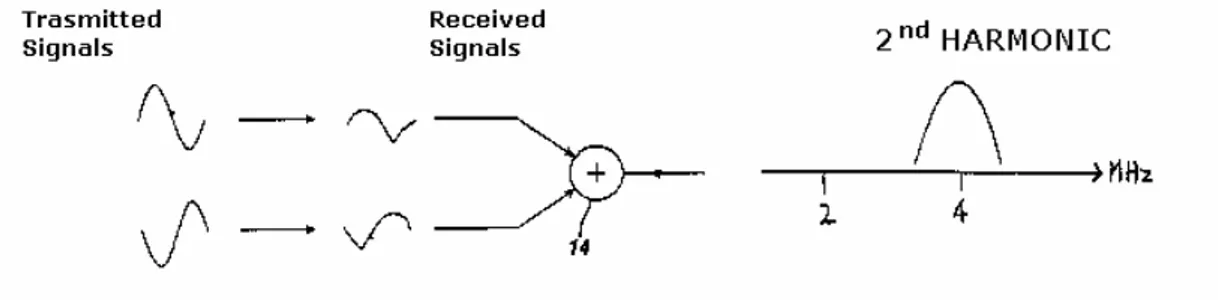
In pulse inversion two signal 180° out of phase are sent to the tissue as shown in figure x.3
Figure 3.3: Pulse Inversion Stimulation (EP0913704)
Due to the non linearity of the tissue and microbubbles response the two received signals are not symmetric as the emitted pulses are.
In fact odd-ordered harmonics (fundamental, 3rd, 5th etc.) remain 180° out of phase, whereas even-ordered harmonics (2nd, 4th, etc.) are in phase.
Figure 3.4: Odd-ordered harmonics and even-ordered harmonics (EP0913704)
However, it must be remembered that ultrasonic imaging transducers have finite pass bands, so the array will typically reproduce only the fundamental and the second harmonic; higher order harmonics will be eliminated by the upper cut-off of the transducer.
The two received echoes are processed by an adder:
Figure 3.5: Elimination of the fundamental frequency components
As a result of this combination, the fundamental frequency components, being of opposing phases or polarity will cancel out. The second harmonic frequency components, being in phase, will reinforce each other; so a second harmonic signal is produced. If a subtractor is used instead of the adder, the harmonic components will cancel and the fundamental (linear) components will reinforce each other to produce separated fundamental frequency components.
Codec excitation has gained increasing attention in medical ultrasound
increasing the observation depth and/or axial resolution (Chiao and Mao,2005).
The physics and formation of codec excitation is relatively complex and is beyond the scope of the present study, only the basic principle will be described.
Codec excitation relies on transmitting, instead of a short Gaussian pulse as in the case of conventional ultrasound, a longer pulse train of higher energy, having a particular ("coded") modulation of frequency and/or phase. At reception this particular modulation is identified (i.e. decoded or compressed) with a (matched) filter which enables to recover the system response of the tissue.
The codec excitation technique can also be combined with second harmonic imaging, thereby effectively cancelling out the acoustic response of media having linear response (Chiao and Mao,2005); and it has also been investigated for imaging with USCA (Boobson et al. 2005).
Another way to enhance the bubble nonlinear response is to stimulate the microbubble with chirp waveform. The chirp waveform is a combination of :
1. Low frequency wave that compress the bubble and initiate its dynamic (see figure x.6,first wave component);
2. High frequency wave (see figure x.6,second wave component) to produce an enhanced bubble nonlinear response
Figure 3.6: Chirp Waveform (E P 1 4 0 6 0 9 6 )
By adjusting the centre frequency, amplitude, and bandwidth for the two wave components of the stepped-chirp waveform and their relative phase, frequency, switch time (the time point where the waveform changes from one frequency to another) and the time delays in between, the nonlinear response of the bubble is enhanced.
3.2 USCA TECHNOLOGY AND APPLICATION IN LOW MECHANICAL INDEX IMAGING
This part addresses patents and patent applications directed to Low Mechanical Index (MI) imaging with USCA. The previously addressed characteristics of USCA, harmonic effect, high echogenity, can be exploited without breaking the microbubbles.
• BLOOD DYNAMICS INVESTIGATIONS
As already observed Blood without USCA has a very low echogenity so it is very difficult to obtain information about blood flow with ultrasound. USCAs are very useful for this purpose, since their high echogenity allows to obtain a stronger signal from the blood vessels.
As shown in several patent applications as for example US2004087858 the contrast-to-tissue ratio (see glossary for the definition) is improved while the contrast agent is continuously infused.
To distinguish the blood flow from the surrounding tissue it is possible to perform subtraction imaging as shown in patent application US2002028994 where two images of the same region of interest are acquired before and during USCA infusion and then subtracted raster by raster (A Raster defines values for pixels occupying a particular rectangular area of the plane) to discriminate the blood flow from the surrounding tissue.
USCA can be used to perform Power Colour Doppler imaging (US2001009977). The microbubbles are used to improve the distance resolution, sensitivity, and increase the frame rate in power Doppler.
Similar imaging protocol, i.e. injection of a bolus (or continuously) of USCA and imaging how it flows through the vessels, can be implemented with special waveforms such as chirp wave-form as explained in patent application EP1406096.
• TISSUE ABLATION VISUALIZATION
Cardiac arrhythmia is a group of conditions in which the contraction of the heart is irregular or is faster or slower than normal. This pathology is
caused by electrical impulses that do not correctly spread trough myocardium causing the irregular contraction.
A therapy provide to locate the source of an abnormal electrical activity and isolate this source from the coronary vessels (Ablation).
Successful treatment of cardiac arrhythmia requires that the ablation lesion have a sufficient extent and depth in the myocardium to effectively eliminate the source of the abnormal electrical activity associated with the arrhythmia. A contrast agent is injected into an artery that feeds blood to tissue surrounding an ablation lesion (US2003208123). During and after contrast agent injection, the ablation lesion and surrounding tissue is imaged.
Figure 3.7 Echocardiogram A: ground level, B: after inj. of 1 ml of Levovist (350 mg/ml)
The open capillaries in the living tissue allow the contrast agent to perfuse therein, while the closed capillaries in the nonviable tissue of the ablated lesion prevent the contrast agent from perfusing therein therefore it is possible to discriminate the living tissue from the ablated one and visualize the extent and depth of ablation lesions and decide whether the treatment is successful or not.
Blood flow to the liver comes from two sources: the hepatic artery and the portal vein. The liver receives 20% of its total supply of blood from the aorta and hepatic artery and 80% of its blood supply from the inferior vena cava and the portal vein. So is possible from literature and medical investigation to establish a curve that describes liver perfusion for normal patients.
It has been found that the vasculature developed by a tumour like hepatocellular carcinoma (HCC) is supplied primarily from the hepatic artery. Because the contrast agent first appears in the liver by way of the hepatic artery, this means that one of the initial sites of contrast agent detection in the liver after a bolus injection is the locus of an HCC lesion. If no lesion is present, only the usual hepatic artery and normal vessels supplied by it will appear with contrast present.
Figure 3.8: Normal and pathologic curve ( W O 2 0 0 6 0 9 0 3 0 9 )
As explained above most of the flow of blood with contrast agent in the normal liver is delayed because its passage through the kidneys. If a bolus of USCA is injected at t0, it reaches the liver at a time t2 (see figure 3.8). However the flow of blood with contrast agent in the hepatic artery and into the vasculature developed around an HCC lesion will appear earlier (t1<t2 as shown in figure 3.8). It is therefore the function of a pixel classifier to identify pixel or voxel data which is characteristic of the cross-hatched area between curves registered with the USCA and the normal statistical curve (WO2006090309)
Tumours develop a complex vascularisation. Treatment of tumours involve destruction of their vascularisation, e.g. radiotherapy or chemotherapy. Successful treatment requires that the whole area affected by the tumour is isolated. A contrast agent is injected into the region of interest before and after treatment and its flow is observed with an ultrasound scanner (US2005187475). If the treatment is successful the contrast agent is prevented from flowing into the tumour through the vessels like shown in figure 3.9
3.3 USCA TECHNOLOGY AND APPLICATION IN HIGH MECHANICAL INDEX IMAGING
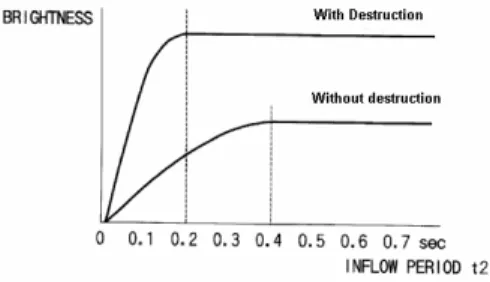
This part addresses patents and patent applications directed to High Mechanical Index (MI) imaging with USCA, i.e. involving the destruction of bubbles with a high intensity ultrasound wave. The destruction of USCA can be exploited in order to obtain a stronger backward signal and higher brightness in the image (figure 3.10) as explained in patent US6245019.
Figure 3.10: Comparison between High MI imaging and Low MI imaging ( U S 6 2 4 5 0 1 9 )
The basic principle of perfusion studies with USCA is to have a continuous
injection of USCA, destroy the agent in the area of interest (ROI) with an
high mechanical index wave and see how it refills.
The refilling rate can be used to quantify the blood flow and this rate can be obtained by computing the intensity of the backscatter signal through time from the moment of transmitting the High MI pulse(EP1514516). The blood flow is obtained by calculating the parameter (see figure x.11)
Figure 3.11: Time Intensity curve ( E P 1 5 1 4 5 1 6 )
A similar protocol, i.e. transmitting an High MI pulse and subsequently imaging the refilling at regular intervals can be implemented with specific imaging approaches, such as pulse inversion (EP0913704 & US6454714) or codec excitation (US2001044278).
• METHOD FOR MEASURING REAL TIME PRESSURE & FLUID DYNAMIC INSIDE MICROVESSELS
When insonifying a population of microbubbles with a pulse of a given power a certain amount of them is disrupted depending on the acoustic pressure of the pulse and their size.
It is possible to exploit the mechanical characteristics of USCA for real time measurement of the pressure in a region of interest (WO0057792). The first step for this procedure is to introduce into a cavity a composition of microbubbles with a variety of diameters corresponding to predetermined fragility thresholds. Bigger microbubbles are more instable than the smaller ones.
After a pulse of a given pressure some microbubbles collapse and from the ultrasound backscatter response we can determinate the population of intact and failing microbubbles in the region of interest and the intensity of this signal is inversely proportional to the internal pressure.
By selectively destructing of microbubbles of a particular size range it is also possible to investigate the dynamic in small vessels (EP1354555).
In fact with sequentially transmitting pulses of increasing intensity it is possible to destroy selectively a fraction of bubbles (first the bigger, than the smaller) and observe how the smaller microbubbles flow into small cavity that bigger microbubbles can not reach.
3.4 STATISTICS
In the field of USCA about 110 European patent application have been found (see annex for the search procedure). The majority of these patent applications are classified as A61B8/00D:
"Diagnosis using ultrasonic, sonic or infrasonic waves by tracers, e.g. microbubbles introduced into the bloodstream"
As mentioned in the introduction, the first European patent application in this field was from 1984 (EP0072330, FUJITSU LTD, filing date 06.08.1984,addressing pressure measuring with ultrasonic waves,). Since then this technique has been used in several other applications. In the successive years, especially from the beginning of nineties, an increase of patent applications in this field it's observed.
CHAPTER IV
THREE DIMENSIONAL ULTRASOUND
4.1 INTRODUCTION
In the last 10 years of research, investigators and commercial companies have advanced ultrasound imaging with the development of 3D ultrasound. The major reason for the increase in the use of 3D ultrasound is related to the limitation of 2D viewing of 3D anatomy using conventional ultrasound. As observed in [Fenster et al. 2000] mentally combine 2D images by the operator to form an impression of 3D volume is a sub-optimal approach because:
• This approach is variable and subjective, it may lead to incorrect decisions in diagnosis and in the planning of the therapy;
• Diagnostic and therapeutic decisions often require an accurate estimation of organ or tumour volume, in conventional 2D ultrasound the volume is calculated by measuring height width and length in 2 views and assuming an idealized (e.g. ellipsoidal) shape. This method is variable and operator dependent;
• It is difficult to adjust the transducer in the same position of a previous examination for monitoring therapeutic procedures;
• Some 2D slices of an organ are impossible to achieve because of the restriction imposed by the patient anatomy, but they can be reconstructed from a volume of data.
In 3D ultrasound examination, 2D ultrasound images are combined by a computer to form an objective 3D image of the anatomy or pathology. This image can be manipulated and viewed by the physician to obtain views of the organ at any angle.
Moreover, unlike CT and MR imaging, in which 2D images are usually acquired at a slow rate as a stack of parallel slices, in a fixed orientation, ultrasound provides tomographic 2D images at a high rate (15–60 images/Sec), and in arbitrary orientations [Gee et al.2003].
In 1974, Greenleaf et al. first published a technique called "Ultrasound Computed Tomography" (UCT) describing an acquisition and reconstruction technique for volumetric echography. Success with this modality was limited due to the limited availability of computational power in the 1970s.
Progress has been slow due to the enormous computational requirements which must be met in order to acquire, reconstruct and view 3D information in near real time on low-cost systems. Advances in computer technology and visualization techniques in the past few years have made 3D ultrasound imaging viable.
4.2 3D ACQUISITION PROTOCOLS, SCANNIG TECHNIQUE AND IMAGE RECONSTRUCTION
Most 3D ultrasound imaging systems make use of conventional 1D ultrasound transducers to acquire a series of 2D ultrasound images, and differ only in the method used to determine the position and orientation of these 2D images within the 3D image volume being examined. The production of 3D images without distortions requires that three factors be optimized [Gee et al.2003]:
• 2D images position must be known
• The apparatus must be simple and convenient to use
In the majority of systems, 3D ultrasound is acquired by sweeping a 2D imaging plane over the area of interest and stacking up the resulting B-scans to form a 3D volume. Figure x.1 shows the complete spectrum of possible approaches and the applications where the advantages of 3D ultrasound may be useful exploited.
Four different 3D ultrasound imaging approaches have been pursued (fig 4.2):
• mechanical scanners;
• free-hand techniques with position sensing;
• free-hand techniques without position sensing (only in chatters); • 2D array.
Figure 4.2: Summary of 3D scanning methods (Fenster et al. 2000)
Image reconstruction refers to the process of generating a 3D representation of the anatomy by placing the acquired 2D images in their correct relative positions and orientations in the 3D image volume, and then using their pixel values to determine the voxel values in the 3D image.
Two methods have been implemented [Fenster et al. 2000]:
• Feature based reconstruction: The anatomical structures are determined in the 2D slices and then reconstructed in 3D images
• Volume based reconstruction: Each pixel of a 2D slice is placed in its correct 3D coordinates, first two coordinates based on the 2D coordinates and the third coordinate based on the position and orientation of the slice.
As observed in the introduction of this work, discussion of the reconstruction of techniques is beyond the scope of the present study.
4.3 MECHANICAL SCANNERS
In this approach the anatomy is scanned by using a motorized mechanical apparatus to translate, tilt or rotate a conventional transducer as it rapidly acquires a series of 2D ultrasound images spanning the volume of interest. Because the scanning protocol is predefined, the relative motion and orientation of each 2D image can be known accurately. The 2D images acquired during the scan are send to the computer and used to reconstruct 3D volume.
An application of this technique is breast tomography because the breast is immobile (so the time to translate or rotate the transducer is not a restriction), easy to access and homogenous.
Good acoustic coupling between the transducer and the body must be ensured at any time during the rapid, cyclic movement of the probe. This issue is conventionally solved by using a coupling fluid (e.g. gel). To perform ultrasound breast tomography the female subject has to suspend one of her breasts into a container filled with acoustical coupling.
The scanner placed into the housing rotates and translates while it acquires tomographic images (US200464046, US2004068180 US20060173307, WO2005087110, US200609693, US 200468180).
Figure 4.3 Mechanical Scanner for breast 3D imaging (US20060173307 and US200609693)
In figure x.3 two methods are shown, the device in the left side (US20060173307) The transducers array is mounted in a housing that can
be mechanically rotated in several direction(see fig. 4.3,letter a,b,c and number 40)in order to acquire 2D scans of the entire volume.
The device in the right side of figure 4.3 (US200609693) comprises a chamber filled with coupling fluid with the transducer mounted inside. Also in this device a system allows transducers to rotate and translate around the breast. The patient in this case has to lie in the prone position in a special bed.
The rotation of the ultrasonic transducer around the breast can cause turbulences in the coupling fluid and this can cause distortion in the tomographic image. This problem is solved using 2 chambers, one stationary in which the breast is immersed and one movable containing the transducers (US2004064046)
Figure 4.4: Double Chamber Device (US2004064046)
The fluid during the scan has the possibility to flow from the movable to the stationary chamber. The communication between the 2 chambers reduces turbulences during the scanning process. To perform a tomographic scan of the breast the rotating chamber (in which the transducers are mounted) is rotated and a first 2D slice is created then the rotating chamber is incrementally lowered and another slice is acquired (Fig. 4.5)
Figure 4.5 Acquisition of a volume (US2004064046)
When all the region of interest is scanned the 2D slices are processed by the computer and the 3D volume is created.
Some of these devices can also be coupled with an invasive therapeutic or diagnostic procedure (WO200607423) involving a needle localized with ultrasound which can be used for injecting drug (e.g. chemotherapeutic agent) into a tumour or used for biopsy (US200609693).
Figure 4.6: Mechanical Scanner coupled with needle ( U S 2 0 0 6 0 9 6 9 3 )
The time necessary for the mechanical movements required for the scan are a physical limitation for this kind of devices, hence only static tissue without cyclic artefacts can be scanned with the scanners described above. To avoid this limitation and obtain 3D image sets of moving organs the image can be acquired with an ECG gated device (DE19723053 and US5871019).
As is well known the ECG is a record of the electrical activity of the heart. the so callad "R-Peak" correspond to the maximum of the electrical activity during the contraction of the ventricles and is easily discernible on the ECG( see figure 4.7) Each 2D slice is acquired at the same period of the cardiac cycle and then reconstructed to create the 3D volume of the heart
Figure 4.7: ECG - gated scanning procedure
Mechanical scanners have also several applications in the IVUS (intra-vascular ultrasound) and are described in the section 4.6.
4.4 FREE HAND SCANNERS
The mechanical scanning allows to obtain relatively short imaging times, high-quality 3D images and fast reconstruction times. However, the bulkiness and weight of the scanning
apparatus sometimes make it inconvenient to use, and large structures are difficult to scan. To overcome this problem, free-hand scanning techniques that do not require a motorized fixture have been developed by many investigators [Fenster et al. 2000].
In these approaches, a sensor is attached to the transducer to measure its position and orientation. While the transducer is being manipulated, the acquired 2D images are stored by a computer together with their positions and orientations. This information is then used to reconstruct the 3D image. However the operator must ensure that the sets of 2D images have no significant gaps.
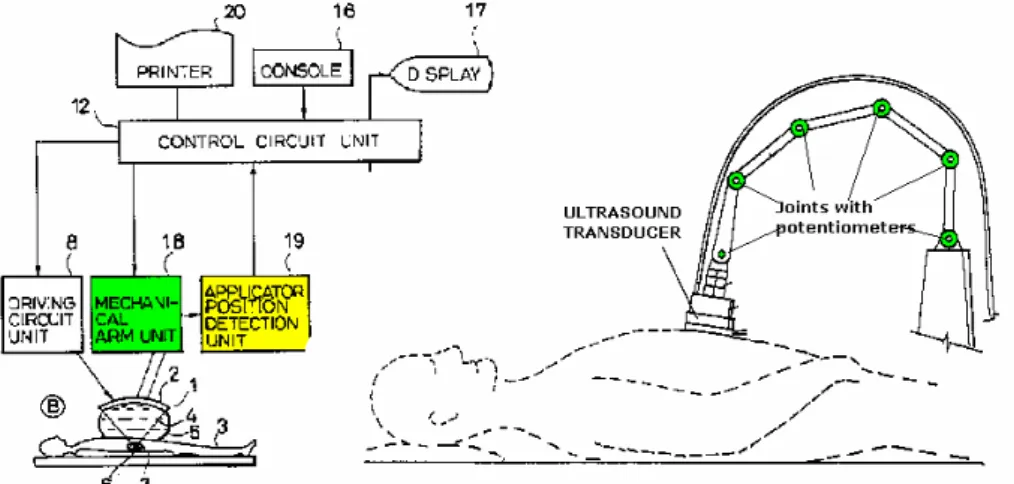
• Free hand with articulated arm
Position and orientation sensing can be achieved by mounting the ultrasound transducer on a multiple-jointed mechanical arm system. Potentiometers located at the joints of the arm provide the information necessary to calculate the relative position and orientation of the acquired 2D images (US5806521).
• Free hand with magnetic field sensors
Magnetic field sensor can be used do determine the position of the
transducer. The transmitter is placed beside the patient and the receiver is mounted on the hand-held transducer (US6775404, EP0487339). The
position is calculated based on the received magnetic field
The main problem with magnetic field sensors are interference from sources such as CRT monitors, ac power cables and electrical signals from the transducer itself which can compromise the tracking accuracy.
• Free hand with optical sensors
To prevent artefacts induced by the environment optical sensor can be used as shown in patent application US2004167402. The basic principle is the same as in an optical mouse of the computer.
Figure 4.9: Free Hand Transducer with optical sensors (U S 2 0 0 4 1 6 7 4 0 2 )
The optical sensor allows to measure relative movement of the transducer over the skin and the signals from the sensor are used to determine the relative position of each image.
• Free Hand with optical fibre
A new technology that shows promising results in the area of 3D imaging is an optical system where optical fibres are run through the machine [Pagulatos et al. 2005]
The spatial localizer consists of a flexible tape with optical fibre sensors along its length. The curvature along the cable is measured using the optical fibres and integrated to give the location and orientation of the probe.
Figure 4.10 Free Hand system with optical fibre [ P a g u l a t o s e t a l . 2 0 0 5 ]
The position tracking is insensitive to the scanning environment, the main limitation of this technique is that the location and orientation of the probe with practically long cable is not yet sufficiently accurate.
• Free hand with speckle decorrelation
An alternative technique, not requiring any device, uses the acquired images themselves to extract their relative positions. This can be accomplished using the phenomenon of speckle decorrelation. If two images are acquired from the same location, then the speckle pattern will be the same, so that there will be no decorrelation. However, if one of the images is moved with respect to the first, then the degree of decorrelation will be proportional to the distance moved, the exact relationship depending on the beam width in the direction of the motion (US20030114755)
This technique is used in obstetrics imaging to quantify volume and weight of the foetal and have some images of the foetal aspect. The accuracy of this technique is not very high and the effort required to obtain high quality 3D ultrasound images often overweight the potential benefits [Fenster et al. 2000].
4.5 2D ARRAYS
The mechanical and free-hand scanning approaches for 3D ultrasound images described in the paragraph 4.3 and 4.4 all involve acquiring 2D ultrasound images with a conventional transducer (1D array).
The limitations of the 1D array described above are:
• Low acquisition speed (e.g. mechanical movement);
• Low accuracy (e.g. free hand with speckle decorrelation); • Relative movement between probe and patient.
To overcome these limitations 2D array have been developed in the recent years. A 2D phased array is formed by a large number of ultrasound piezoelectric transducers steered electronically in order to insonify a pyramidal volume of interest.
With 2D array there are no moving parts and the acquisition of a pyramidal volume is almost instantaneous [Fenster et al. 2000]. There is no relative movement between the probe and the patient and the image accuracy is high.
Figure 4.12 2D arrays (EP1242991)
The main problem of 2D arrays is the large number of piezoelectric elements that has to be steered at the same time in order to create the pyramidal beam. All the information from each piezoelectric element has to be send to the analyzing processor so there is also the problem of cables for connecting the array to the computer. These problems are reflected in high costs and so their commercial availability is yet limited [Fenster et al 2006]. A 2D array is showed in patent application EP1242991. The array described is formed by more than 3000 transducers arranged in a dodecahedral shape as shown in figure 4.13
Figure 4.13: 2D array EP1242991
The transducers in the central part of the array (about 750) create the pyramidal beam, the others are used only for the received echo.
Since a cable with more than three thousand conductors is not currently practical,
(Such a cable would be impractically large, bulky and inflexible) the array is arranged in groups of 12 transducers. This reduces the number of conductors to 256.
For every transducer a complex microelectronics is dedicated as shown in figure 4.14
Figure 4.14: Microelectronics under each transducer EP1242991
This microelectronics allows to rapidly elaborate the signal for each group of 12 transducer and send the resulting signal to the analysing processor.
Other sub-array arrangement and division aiming at the reduction of the bulkiness of the device are shown in patent US6013032 and patent application, US20060106307 and US2003220569.
4.6 3D ULTRASOUND CATHETERS
Due to the miniaturization of ultrasound transducer, the harmless character of an echographic acquisition as well as a very good resolution obtained at high frequencies, ultrasound has become a technique of choice in endovascular imaging or intra-vascular ultrasound (IVUS).
This field has benefited from the advances in 3D ultrasound imaging, and catheters offering 3D ultrasound acquisition have been developed since the middle of the 90's.
The techniques used in the field of 3D IVUS follow a similar pattern as in conventional 3D echography addressed in the previous section with some particularities related to the specific application. Catheters for 3D imaging can be classified in 3 categories:
• Mechanical; • Free-Hand; • 2D array.
The mechanical approach involves sweeping or rotating the 1D array with a motorized system (e.g. an electrical motor). An example of 1D phased array rotated in order to cover a 3D volume is described in patent application WO9856296
Figure 4.15 Catheter with mechanical rotating phased array W O 9 8 5 6 2 9 6
The rotating array showed in figure 4.15 produces a sets of 2D images from which a 3D volume is reconstructed (fig 4.16). The guide-wire guides the catheter to the desired destination.
Figure 4.16 2D slices W O 9 8 5 6 2 9 6
Patent application WO9856296 describes in addiction a channel for delivering USCA (see figure 4.16). As indicated in Forsberg et al 2002 delivering USCAs into the field of view of the ultrasound transducer allows to obtain flow information from smaller vessels associated with tumours.
Another possible arrangement for the array is described in patent application US2003229286. The transducers are disposed on the entire circumference of the catheter as shown in figure 4.17
Figure 4.17: Cross section of the catheter (U S 2 0 0 3 2 2 9 2 8 6 )
1D array transducers are arranged in cluster, during imaging each cluster is tilted (over 60° or 90°) to cover a pyramidal volume.
The integration of all the contributions of each cluster allows to have a whole volume image as shown in figure x.19
Figure 4.19: Scanning volume obtained from integration of all cluster with 60° tilt (right) and 90° (left) (U S 2 0 0 3 2 2 9 2 8 6 )
As described in section 4.3, also in catheters with mechanical scanners the images are hampered by cyclic artefacts. A solution is proposed in patent application WO9811823 where ECG-Gated 3D IVUS Image Acquisition is described. In the present application 360° IVUS images are acquired immediately after consecutive R-peaks. however in order to avoid distortions caused by abnormal cardiac cycles, an image is rejected if the R-R interval does not meet a predefined range. After each accepted 360° acquisition the catheter is pulled to its next position for the acquisition of the next image.
Figure 4.20 ECG-Gated IVUS acquisition [Van Bingelen et al. 1997]
With this catheter it is possible to image the coronary arteries without imaging artefacts produced by cyclic changes in vascular dimension.


![Figure 4.1: Ultrasound acquisition protocoles [Gee et al. 2003]](https://thumb-eu.123doks.com/thumbv2/123dokorg/7302870.87393/50.892.131.739.339.649/figure-ultrasound-acquisition-protocoles-gee-et-al.webp)

![Figure 4.10 Free Hand system with optical fibre [ P a g u l a t o s e t a l . 2 0 0 5 ]](https://thumb-eu.123doks.com/thumbv2/123dokorg/7302870.87393/58.892.202.698.231.470/figure-free-hand-optical-fibre-p-g-u.webp)
