ORIGINAL RESEARCH
Does Social Capital Affect Voter Turnout? Evidence from Italy
Nadia Fiorino1 · Emma Galli2 · Nicola Pontarollo3Accepted: 8 February 2021 © The Author(s) 2021
Abstract
In this paper we develop a new composite indicator, named Social Catalyst, able to account for the complex and multifaceted nature of the social capital in a unitary measure. We use our indicator, as well as its components, to explore the relation between social capital and electoral participation in the parliamentary elections in Italy from 1994 to 2008, addressing the potential endogeneity bias. Our findings show that (i) the Social Catalyst positively and significantly affects voter turnout in both Chambers; (ii) among the different dimensions of social capital, social norms and associational networks play a prominent role in the Italian regional context.
Keywords Voter turnout · National parliamentary elections · Social capital · Social
catalyst · Italy
JEL codes D72 · C23
1 Introduction
Does community activity lead to collectively virtuous behavior and improve the quality of democracy? Since the second half of the last century social capital has attracted increas-ing attention as a relevant factor underlyincreas-ing votincreas-ing in democracies. A bulk of literature has recognized that civic involvement, social connections, sharing common goals may play a crucial role in explaining differences in political participation. People who socially inter-act represent an important channel to transmit norms of civic and political participation and recruit other people in these activities (see, among others, Almond and Verba 1963; Putnam 1993; Verba et al. 1995). Integration into formal and informal organizations helps members of the organizations to develop communication and cooperation skills; it also increases trust in people as well as in the political system. Trust, and in particular political
* Emma Galli
1 Department of Industrial and Information Engineering and Economics, University of L’Aquila,
L’Aquila, Italy
2 Department of Social and Economic Sciences, Sapienza University of Rome, Rome, Italy 3 Department of Economics and Management, University of Brescia, Brescia, Italy
trust, is considered an important prerequisite for an active and vigilant citizenry (Almond and Verba 1963; Easton 1965; Gronlund and Setala 2007).1
Empirical evidence, mainly based on individual data or experiments performed on sur-vey data in different countries, is mixed. Some papers find that social capital positively affects voter mobilization by strengthening co-operative behavior or increasing the flow of information (e.g. Putnam 1993; Henn et al 2007; Putnam 2000; Gerber et al. 2008). Others show that it discourages electoral participation by exposing citizens to conflicting views or providing them with an alternative channel to achieve personal goals and satisfaction (e.g. Mutz 2002; Aktinson and Fowler 2014). Overall, these mixed findings are the result of several issues: the difficulty to adequately and unanimously define a phenomenon which encompasses different dimensions ranging from social networks to trust and civic norms; the subsequent complexity of translating these multifaceted definitions into a ‘good’ meas-ure2; the methodological problems of omitted variables and endogeneity that may affect the electoral participation-social capital nexus. For all these motives, the empirical evi-dence on such a nexus is ambivalent. Moreover, if we consider that several governments and international organizations have undertaken policies increasing community activity as a way to promote (in developing countries) and strengthen (in advanced countries) democ-racy (see, on this point, Krishna 2007), further investigations are useful.
This paper focuses on Italy, an exemplary case study in the literature on social capital (among others, Putnam 1993; Guiso et al. 2004; de Blasio and Nuzzo 2010; Crescenzi et al.
2013; Guiso et al. 2016). Using aggregate data, we aim at verifying whether the regional endowment of social capital is a good predictor of the electoral participation in 5 national parliamentary elections from 1994 to 2008.
Our contribution to the literature is twofold. As we mentioned before, a key issue in the empirical analyses on social capital is its measurement. In this respect, we develop a new composite indicator, named Social Catalyst, able to account for the complex and multifac-eted nature of the social capital in a unitary measure that captures the ‘compositional effect power’ of the different dimensions recognized by the literature. The methodology, which we test using Italian data, is not country-specific, and can be generalized and applied to other countries. Then, we use our new measure of social capital, as well as of its compo-nents, to verify its impact on electoral participation.
One problem with testing whether social capital affects voter turnout is possible reverse causation. Several works on social capital have stressed the relation between trust and civic engagement arguing that people who do not trust others will be less likely to participate in public life. These works are based on a generalized worldview optimism, which for the most part does not depend on experiences of participation in civil and political life; they rather reflect a conception of trust as a sentiment linking people who do not know each other (Uslaner 2002; Uslaner and Brown 2005). Other contributions, instead, link civic engagement to trust and trust to participation (Brehm and Rahn 1997; Stolle 1998). According to this view, the experiences of political and civic engagement may shape trust; social activity over time may affects voter turnout and, in turn, participating in politics may
1 The impact of political trust on electoral turnout is contested. Indeed, also dis-trust is considered positive
for democracy as it helps to mobilize critical citizens who hold the decision-makers accountable (Norris
1999).
2 For a recent and exhaustive review of the definitions and measures of social capital see de Blasio et al.
increase social capital.3 Another concern is that social capital might be related to other unobservable factors that contribute to explain the variation in turnout across regions.
We take into account all these problems and handle them through a robust identification strategy based on an historical instrument, the number of free city-state in each region. Our results show that the nexus between social capital and turnout is positive and strongly significant in both Chambers and in all the specifications. Besides the ‘bundle effect’ iden-tified by the Social Catalyst, we also focus on the channels through which social capital affects voting participation in Italy and find that social norms and civicness play a relevant and positive role, although with a different intensity.
The paper is organized as follows: Section 2 analyzes the dynamics of the national parliamentary elections in our sample and discusses the methodology we use to build the
Social Catalyst. Section 3 presents the model and discusses the results. An additional
anal-ysis is provided in Sect. 4. Section 5 concludes.
2 Empirical Strategy
2.1 Why Italy?
As mentioned above, our analysis verifies the voter turnout-social capital nexus focusing on 18 Italian regions from 1994 to 2008. We capture various aspects of civic capital in a unitary measure and disentangle the weight of each variable entering the indicator, so that we are able to separately discuss both the effects of the measure and of its individual components.
Since the pioneering research by Almond and Verba (1963), which focuses on voluntary organizations as “the most important foundations” of stable democracies4, Italy has been considered an interesting case-study. Almond and Verba’s results indeed portray the Italian political culture as characterized by alienation, social isolation and horizontal and vertical dis-trust. In other words, Italian citizens are depicted as uninformed and less interested in politics and civic affairs compared to the counterparts of other countries like Germany, Great Britain, Mexico and USA. The subsequent Putnam’s seminal work (1993) relates the variation of social capital in the Italian regions, rooted in different historical experiences, to their different institutional performance. More recently Tabellini (2010) and Guiso et al. (2016) focus on the long-term effects of social capital in the Italian municipalities.
Italy still deserves attention today. The Eurobarometer and World Value Surveys report that the country is characterized by a low level of trust among people and towards politics and institutions (Cartocci 2011). Moreover, the divide between the Northern and the Southern Italian regions continues to embody a paradigm of within-country differences. Indeed, as shown in Figs. 1 and 2 (and also highlighted in previ-ous research by Buonanno et al. 2009; Barone and de Blasio 2010), turnout as well as
3 However, not all forms of civic engagement are alike, and trust should not work the same way across
all of them. While generalized trust does not specifically shape political participation but leads people to participate to a variety of collective actions, particularized trust mostly leads them away from civic life (Uslaner 2000).
4 Almond and Verba (1963) consider voluntary organizations as socialization’ environments and “schools
social capital are heterogeneously distributed throughout the regions despite common institutions, school systems and religious and ethnic identities.
We concentrate our analysis on the period 1994–2008. In the mid-nineties indeed a decentralization process started in Italy and ended up in 2001 with the creation of a federalist architecture which gave autonomy to the regions and greater importance in terms of political decisions and public policies’ provision (Ambrosiano et al. 2010). Moreover, until the end of the 2000s, political participation has followed traditional channels of expression, which only later have radically changed with the rapid diffu-sion of the Internet (Istat 2018). Also, the traditional form of social capital has been weakened by the recent phenomenon of social networks which have acted as a sub-stitute for the time people devote to voluntary activities (Prior 2005; Campante et al.
2018).
Fig. 1 Dynamics of regional turnout at the Chamber elections
2.2 Voter Turnout in Italy
Our dependent variable is regional voter turnout in national parliamentary elections. According to the Italian Constitution the Parliament consists of two Houses – the Chamber of Deputies and the Senate - which share the legislative power. The Chamber represents national interests, while the Senate the regional ones. Citizens who are 18 and older have the right to vote for the Chamber of Deputies; citizens who are 25 and older for Senate.
It is worth clarifying that voter turnout in referenda is excluded from the dependent vari-able because it has been largely used to proxy social capital (among others, Putnam 1993; Guiso et al. 2004, 2008). Indeed, while turnout in referenda is itself a civic value and is unlikely to be driven by pure individual interests, voting at the political elections could be subject to rent-seeking or patronage, resulting in the erosion of social capital.
Economic literature has employed different measures of voter turnout depending on the statistics available (Geys 2006).5 We employ the share of population which cast its vote (Turnout) calculated in each region as the ratio between the number of voters and the popu-lation of voting age (i.e., the ‘age eligible’ popupopu-lation) in parliamentary elections. Data come from the Historical Archive of Italian Ministry of Interior.
Figures 1 and 2 show the dynamics of the regional turnout at the Chamber and Senate elections, respectively. The turnout varies between 65% and 95%. Its trend is decreasing in all the regions of our sample except in four Southern ones (Basilicata, Calabria, Molise and Sicily). The latter are characterized by a very low electoral participation, which has grown between 1996 and 2006 and has decreased again in 2008. Overall, the figures display a general stability of turnout along the time and space dimensions and a higher turnout in the Northern regions. These stylized facts point out a persistent phenomenon of spatial polarization.
2.3 The Social Catalyst
One of the main challenges of the paper is to build a new indicator of social capital, named
Social Catalyst, which has two major characteristics: (1) it is able to capture the multiple
facets of social capital identified in the literature into a unitary measure; (2) it can be easily generalized to different contexts.
As already highlighted, social capital is a complex phenomenon encompassing vari-ous dimensions: social norms, shared community values, trust among people and towards institutions, social networks, memberships in associations, civic engagement, which fos-ter cooperation and collective actions for mutual benefits. Some scholars have mainly focused on trust (see, among others, Fukuyama 1995; Bowles and Gintis 2002). Others have emphasized the civicness dimension of social capital intended as common interests and shared values of a community (like Coleman 1988; Putnam 1993) or the benefits that the access to networks and social connections generate for the individuals (like in Bourdieu
1986; Burt 2000; Glaeser et al. 2002). Several contributions have highlighted the general relevance of culture and social norms (see, among others, Putnam 1993; Bertrand et al.
2000).
5 Most of the empirical studies have used either the ratio between the number of voters and voting age
population and/or the number of voters over the number registered to vote. Some papers use the absolute number of votes cast and the number of voters over the number of eligible voters. Nevertheless, it is difficult to state which operationalization of the turnout rate is the ‘best’.
Empirical studies on social capital suffer from lack of uniformity with respect to the approaches and the related indicators. In this paper we share the conceptualization offered by Putnam (1993) and subsequently revisited by Guiso et al. (2016). Indeed Putnam (1993) describes social capital as a collective resource referring to social networks, norms of reciprocity and trust that result from connections among individuals. Guiso et al. (2016) which define social capital as a ‘civic capital’, i.e. a set of collective values and beliefs that facilitate cooperation among the members of a community. In this regard, social capital is closely related to ‘civic virtue’.
Therefore, our indicator points towards a measure of social capital generated by a com-bination of networks/cooperation, social norms and trust as interlinked dimensions which all together depict the heritage of a community, consequently contributing to form a uni-tary concept. These dimensions are captured individually through several variables that are not mutually exclusive, although each of them has its own characteristics and may have a single impact on the dynamics of voter turnout.
Under this perspective, the individual components of our social capital indicator are important not only per se but because they contribute to form a bundle that can affect voter turnout differently from each component, once separately considered. We name this effect the ‘compositional effect power’ and measure it employing our composite synthetic indicator.
Following Goletsis and Chletsos (2011) and Pontarollo and Serpieri (2020), we con-struct the Social Catalyst through a normalization and weight elicitation which is based on Principal Component Analysis (PCA). This procedure allows to transform multiple dimen-sions into a set of uncorrelated dimendimen-sions and to reduce dimensionality.
Our approach consists of two stages: (a) normalization of data and (b) weight elicita-tion. Through normalization6 we remove the different scale of each variable and identify indicators that may be positively correlated with the phenomenon of interest. This stage is necessary to ensure that an increase in the normalized indicators corresponds to an increase in the composite indicator. Considering the hth indicator I for region i, I
hi is transformed to
Ihistd , taking values within the interval [0,1] according to the following equation:
We employ the Principal Component Analysis for weight elicitation. This methodology aggregates sub-indicators that are collinear into new ones named ‘components’ and deter-mines the set of weights, which explains the largest variation in the original data. The PCA has also the advantage that the largest factor loadings are attributed to the sub-indicators that show the greater variation across units.
In order to retain the maximum of information, we keep the first two components that cumulatively explain more than 70% of the overall variance of the original data and use the other components selected for the aggregating procedure to guarantee that our variables are not correlated. (1) Istd hi = Ihi− mini(Ihi) maxi(Ihi) − mini(Ihi)
6 There are different methods of normalization: ranking, re-scaling or min-max transformation,
standardi-zation or z-scores. Following Goletsis and Chletsos (2011), we employ the min-max transformation. How-ever, the min max transformation may be sensitive to outliers, modifying the range of the distribution and consequently the distance between transformed observations different from the max (or min). We checked for the presence of outliers by comparing each original and transformed variable through a scatter plot with marginal density plots and did not observed extreme values.
We estimate weights as normalized squared loadings, which implies that each compo-nent’s share of variance is explained by each variable, and use the highest loading per vari-able weighted according to the relative explanatory power of the overall variance by each component.
We aggregate the indicator through the following weighted additive function:
where i is the region, wh is the weight of indicator h and Ihiadi is the adjusted value of indica-tor Ih for region i.
Table 1 illustrates the individual components of our Social Catalyst. The choice of these components is in line with the literature, which distinguishes forms of generalized and par-ticularistic trust captured by several proxies (see, among others, Uslaner and Brown 2005; de Blasio et al. 2014).
The dimension of generalized trust signals the degree of honesty and integrity of a whole community and captures the relevance of general rules and values which dominate the entitlements of personal relationships7. We proxy it with the variable Corruption
expo-sure (Istat various years).
We proxy associational networks as a dimension of particularistic trust using Blood
donors (AVIS various years) and Associations (Istat various years). These variables depict,
in slightly different ways, cooperation and social interactions. While Associations relates to networks often motivated by expectations about the behavior of other individuals which create trust mostly among the members, Blood donors captures the humanitarian people’s propensity to volunteering in favor of others.
We measure the dimension of social norms (civicness) using two variables: Newspapers
diffusion (ADS Cronos various years) and TV license taxpayers (RAI-Radio—Televisione
Italiana various years).
The variable Newspapers diffusion8 works as a channel that facilitates the transmission and sharing of information among citizens, strengthening their sense of membership to a community and their social participation. It is worth noting that during our time span most of the news in Italy are still diffused by means of printed newspapers9. The circulation of the newspapers in fact is quite stable from 1995 to 2006, while it has been steadily decreas-ing since 2007 (ASIG 2011). TV license taxpayers captures citizens’ tax morale and civic behavior with respect to a tax payment which is very weakly enforced.10
(2)
Social Catalysti=
∑
h
whIhistd
7 It is worth noting that when people trust governments and institutions it is easier to build trust and
coop-eration among them. There are several examples of untrustworthy and corrupt governments and institutions that have spread distrust throughout society (Paldam 2000).
8 Newspapers are both national and local. We assume that each copy is read by two individuals and
there-fore consider the variable over two times population, as in Gentzkow et al. (2011).
9 World Bank data indicate that Internet use in Italy began to take hold around 1998, reaching almost 41
percent of the population in 2007. See https ://data.world bank.org/indic ator/IT.NET.USER.ZS?locat ions=IT
(last accessed October 1, 2018). It is also worth noting that from 2001 to 2010 newspaper readership has been growing increasingly reaching almost 45% of the adult population in 2010. This is also explained by the growing diffusion of access to sites web of newspapers (ASIG 2011).
10 During our sample period the television license tax was easy to evade and the fines for a household are
low relative to cost (up to 516 Euros plus a mandatory 5-year license purchase) (Bracco et al. 2015). We consider the variable over three times population since a representative family in Italy includes three peo-ple.
Table
1
The individual com
ponents of t he Social Cat al ys t All t he v ar iables ar e defined o ver t he per iod 1992–2008
a Social activities include par
ticipation in mee
tings of associations (cultur
al/r
ecr
eational, ecological, civil r
ights, peace, spor
t), tr
ade union or
ganizations, pr
of
essional or
trade associations and political par
ties Var iable N Sour ce Definition Mean Std. De v. Min. Max. Associations 90 IS TA T Persons ag
ed 14 and older who ha
ve v olunteer ed in social activities o ver t ot al popula -tion ag ed 14 and older a (%) 10.122 3.600 5.118 17.621 Blood donors 90 AVIS Blood donors o ver population (%) 1.582 0.912 0.280 3.727 Ne wspapers diffusion 90 ADSCr onos
Number of national and local ne
wspapers o ver tw o times population 4.064 1.920 1.367 8.494 Cor rup tion e xposur e 90 IS TA T Number of pr osecutions f or cr imes ag ains t public adminis tration o ver population (%) 0.085 0.052 0.025 0.355 TV t axpa yers 90 RAI R adio Tele visioneIt -aliana TV t ax pa yers o ver t hr ee times population (%) 27.921 4.508 17.276 36.162
The choice of the proxies we employ in this paper is driven by the specificity of the Italian case especially with respect to variables like Corruption and TV license taxpayers, which are suited to capture phenomena of social and tax morality. Indeed, corruption and tax morale are fundamental problems in Italy and have been – and still are - at the forefront of the political and economic debate (Barone et al. 2012; Filippin et al. 2013; Fiorino and Galli 2013). However, it is worth noting that such a choice does not undermine the poten-tiality of generalization of our methodology, which can be tested with alternative measures of the Social Catalyst components.
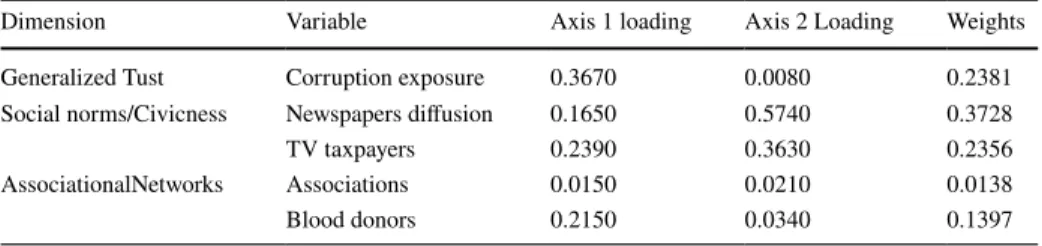
The identified components account for approximately 82.5% of total variance. Variable loadings and weights are in Table 2. The weight associated with Newspapers diffusion is 0.37, and the weight associated to Corruption exposure and TV taxpayers are around 0.23. The weight of Blood donors is equal to 0.14, and of Associations to 0.01. This means that, in construction of the indicator, newspapers diffusion is the most significant component, followed by corruption exposure and TV taxpayers with equal significance (see Freuden-berg 2003: 10).11
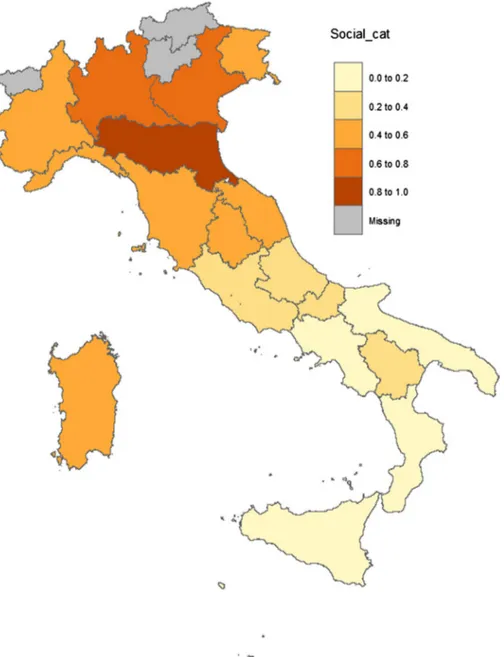
Figure 3 illustrates the distribution of the average values of the Social Catalyst by quin-tile. A clear geographical pattern appears. The Northern regions show a higher social capi-tal than the Southern ones, confirming previous research on the Icapi-talian North-South divide (Bigoni et al. 2016; Cartocci and Vanelli, 2015).
Finally, Figures 4 and 5 graphically show the correlation between Social Catalyst and turnout in the Chamber of Deputies and in the Senate, respectively. In both cases we observe a clear-cut positive correlation: in areas of the country where social capital is higher, turnout also is higher. Moreover, no outliers and leverage points are detectable in the graphs.
3 The Empirical Model and Results
Our empirical model is the following:(3)
Turnouti,t= 𝛼 + 𝛽Social Catalysti,t−1+ 𝛿𝐗i,t−1+T + 𝜀i,t
Table 2 PCA variable loadings and weights
Dimension Variable Axis 1 loading Axis 2 Loading Weights
Generalized Tust Corruption exposure 0.3670 0.0080 0.2381
Social norms/Civicness Newspapers diffusion 0.1650 0.5740 0.3728
TV taxpayers 0.2390 0.3630 0.2356
AssociationalNetworks Associations 0.0150 0.0210 0.0138
Blood donors 0.2150 0.0340 0.1397
11 The weights are related to the significance of each component and not to the relative importance in the
indicator (Becker et al., 2015) According to Nardo et al. (2008) in additive aggregations weights the mean-ing of substitution rates. For an interestmean-ing overview see Decancq and Lugo (2013).
Where i is the number of regions, of which there are 18, t is the electoral year, namely 1994, 1998, 2001, 2004, 2008. T is a time dummy, α, β and δ are parameters to be estimated and the εi i.i.d error term. Turnout is alternatively Senate of Chamber turn-out. Social capital is proxied by the Social Catalyst which is our variable of interest, and
X is a vector accounting for the following demographic, economic and institutional con-trol variables (descriptive statistics are in Table A1 and correlation matrix in Table A2):
– Population density, measured as the log of population over regional area in squared kilometers. Data come from Istat. The literature is not unanimous about the effect of population density on turnout. On the one hand, urbanization may generate a weak-ening of interpersonal relations and social norms, hereby reducing social pressure to vote (see, among others, Geys 2006). On the other, the neighborhood context may play a role in shaping voters’ participation to elections as living in close proximity, belonging to the same social networks and interacting frequently can affect people’s patterns of political behavior (see, among others, Fieldhouse and Cutts 2012). – Income inequality, measured by the Gini index (based on data on the Survey of
Household Income and Wealth conducted by the Bank of Italy). With respect to this issue, the literature is ambivalent. Some studies argue that greater income gap intensifies social conflict for redistribution, increasing expected gains and losses and therefore voter turnout (Meltzer and Richard 1981). Others highlight that poor
0.7 0.75 0.8 0.85 0.9 0.95 1 0 0.1 0.2 0.3 0.4 0.5 0.6 0.7 0.8 0.9 1 Turnout Chamber Social Catalyst
Turnout Chamber = 0.2206 Social Catalyst + 0.727 (p-val.<0.01)
R² = 0.5738
Fig. 4 Correlation between Social Catalyst and turnout in the Chamber of Deputies
0.7 0.75 0.8 0.85 0.9 0.95 1 0 0.1 0.2 0.3 0.4 0.5 0.6 0.7 0.8 0.9 1 Turnout Senate Social Catalyst
Turnout Senate = 0.2249 Social Catalyst + 0.721 (p-val.<0.01)
R² = 0.5738
respond to unequal redistribution by withdrawing from the political process (see, for example, Goodin and Dryzek 1980).
– School attainment, measured as the share of population enrolled in high school, is asso-ciated to greater electoral participation (Blais 2000). Data come from CRENOS and Istat.
– Winning margin, computed as the percentage vote gap between the largest party and its closest competitor at the district level, captures the positive effect of political parties’ competitiveness on turnout (Matsusaka and Palda 1993; Geys 2006). The source of data is Italian Ministry of Interior.
All the independent variables have been lagged by one year in order to avoid reverse causality issues. As we show in the Results section, we employ a pooled and a random effect model, which is the most suitable model according to the Hausman Test. Although our results are based on covariates lagged of one year, we also provide IV pooled and IV random effects, which allow to address simultaneity bias as well as errors in measurement of the Social Catalyst. The IV approach requires the identification of a valid instrument - i.e. an instrument that should satisfy the relevance and exclusion restrictions conditions. According to these conditions, the instrument should correlate with the key explanatory variable but not with the error term. We instrument the Social Catalyst with the number of free city-state per region as in Guiso et al. (2016).
The choice of this instrument rests on the following. Investigating the factors behind social-capital accumulation, several studies have stressed the role of the long-term evo-lution of culture and social norms in Italy (Putnam 1993; Bracco et al. 2015; Albanese and de Blasio 2016; Guiso et al 2016). As matter of fact, the medieval experience of self-government (Comuni) stimulated social and political institutions that built mutual trust and cooperative norms over the long run, persisting to the present day. Based on this argument, we hypothesize that the number of free city-state in each region correlates with our Social
Catalyst.
Furthermore, several reasons suggest that the free city-state does not exert a direct effect on our dependent variable. Firstly, the long-standing determinants of social capital remove any simultaneity bias caused by local shocks that occurred in more recent history. Indeed, it is hard to believe that these shocks could have influenced both the medieval experience of self-government and the current levels voter turnout. Therefore, we can exclude the exist-ence of any source of simultaneity. Secondly, the exclusion restriction might be violated if some missing permanent characteristics related to people agglomeration or economic conditions of a region drove both the history of the free city-state and the current levels of turnout. However, we directly control in our regressions for the most relevant economic characteristics, and for population density. In light of these motivations, we consider the free city-state a good candidate to instrument our Social Catalyst.
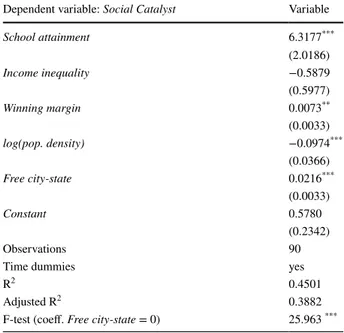
Finally, given that the free city-state is a time invariant variable, we estimate a random effect IV model and a pooled IV model including time fixed effects in both cases. The Kleibergen-Paap F statistic rejects the null hypothesis, meaning that our instrument is strong. The first stage regression on Table A3 confirms the relevance of the instrument. However, the Wu-Hausman test on endogeneity shows that the null hypothesis cannot be rejected, raising doubts about the potential endogeneity of the Social Catalyst.
The results are reported in Table 3. The signs and significance of the coefficients are confirmed in all models. The positive nexus between social capital and turnout is strongly significant in all the specifications, corroborating Henn et al. (2007) and Gerber et al. (2008) findings, although with aggregate rather than individual level or survey data. No
Table
3
Es
timates f
or t
he Chamber of Deputies and Senate
*p <0.1; ** p<0.05; *** p<0.01. Es timates ar e based on r
andom effects models. R
egionall y clus ter r obus t s tandar d er rors in br ac ke ts Chamber Senate Pooled Random eff. IV P ooled IV R andom eff. Pooled Random eff. IV P ooled IV R andom eff. (1) (2) (3) (4) (5) (6) (7) (8) Sc hool att ainment -1 0.6398 0.2172 0.7003 * 0.2171 0.5159 * 0.2255 0.6387 * 0.2255 (0.4862) (0.5035) (0.4755) (0.5034) (0.3064) (0.4391) (0.5351) (0.4394) Income ineq uality -1 −0.3339 ** −0.2353 ** −0.3115 ** −0.2353 ** −0.3589 ** −0.2615 ** −0.3060 ** −0.2615 ** (0.1355) (0.1134) (0.1479) (0.1137) (0.1136) (0.1120) (0.1545) (0.1121) W inning mar gin-1 0.00004 −0.0003 0.0004 −0.0003 0.0004 −0.0001 0.0006 −0.0005 (0.0004) (0.0004) (0.0005) (0.0004) (0.0004) (0.0004) (0.0006) (0.0004) log(pop. density) -1 0.0188 *** 0.0195 *** 0.0180 *** 0.0195 *** 0.0250 *** 0.0241 *** 0.0232 *** 0.0241 *** (0.0070) (0.0075) (0.0074) (0.0075) (0.0052) (0.0073) (0.0075) (0.0072) Social Cat al ys t-1 0.2046 *** 0.2210 *** 0.2061 *** 0.2210 *** 0.2030 *** 0.2183 *** 0.2109 *** 0.2183 *** (0.0210) (0.0269) (0.0300) (0.0268) (0.0138) (0.0303) (0.0271) (0.0202) Int er cep t 0.7649 *** 0.7416 *** 0.7532 *** 0.6572 *** 0.7349 *** 0.7142 *** 0.7118 *** 0.6414 *** (0.0534) (0.0481) (0.0495) (0.0688) (0.0446) (0.0692) (0.0504) (0.0692) Obser vations 90 90 90 90 90 90 90 90 Time dummies ye s ye s ye s ye s ye s ye s ye s ye s R 2 0.7937 0.6843 0.7952 0.7834 0.7884 0.6508 0.7910 0.7815 Adjus ted R 2 0.7705 0.6488 0.7521 0.7646 0.6115 0.7675 Kleiber gen P aap F s tat.(p-v alue) 25.963 (<0.01) 25.963 (<0.01) Hausman tes t (p-v al) 6.648 (0.674) 2.900 (0.968) W u-Hausman tes t (p-v al) 0.045 (0.832) 0.162 (0.688)
differences occur at both Chamber of Deputies and Senate. Among the control variables identified by the literature on the determinants of turnout, population density is positively correlated with the regional turnout, showing the prevalence of a “socialization effect”; income inequality seems to discourage voters, being negatively correlated; education turns out weakly and positively correlated only in the IV pooled model in the Chamber, and in both the pooled and IV pooled models in the Senate; Winning margin has a null effect in stimulating voter turnout.
4 Bundle Effect vs Individual Effects
As emphasized in Sect. 2.3, the Social Catalyst is able to capture the bundle effect on voter turnout created by the individual components of the indicator, which are important not only
per se but because of the ‘relational or spillover’ effects they generate on each other as well
as on the measure of social capital. Our estimates show that the bundle effect identified by the Social Catalyst is strongly and positively correlated with voter turnout suggesting that the complex and multifaceted nature of social capital overall influence voting decisions.
Table 4 compares the ‘bundle’ with the ‘individual’ effect of each component of our measure of social capital on voter participation, once considered separately. Both the social norms (TV taxpayers and Newspapers’ diffusion) and associational networks’ variables (Associations and Blood donors) are strongly and positively correlated with voter turnout, showing that the particularistic dimensions of social capital is able to promote an active citizenry (see, among others, Gronlund and Setala 2007). Instead, the coefficient on
Cor-ruption exposure is not significant, suggesting that electoral participation is not affected by
the general sense of integrity and legality of the community. While corruption enters social capital as a relevant dimension, it does not affect electoral participation, once taken sepa-rately. This result interestingly implies that the influence of corruption on electoral partici-pation is mediated by the strength of social norms as well as by informational environment (see, Chang et al. 2010). In other words, corruption is not relevant per se in shaping voters’ behavior; what matters is the ‘bundle effect’ of social channels, which make voters aware of corruption in political life.
5 Conclusions
In this paper we develop a new composite indicator of social capital, the Social Catalyst, which is able to capture the ‘compositional effect power’ of different dimension of trust by analyzing the weight of each individual component. The methodology, which we test using Italian data, can be generalized and applied to different countries.
The Social Catalyst is employed to explore the following questions: Is local social capital a good predictor of the electoral participation in national Parliamentary elections? Among the different dimensions of social capital, which are the drivers of voter turnout? Firstly, we provide empirical evidence that the nexus between social capital and turnout is positive and strongly significant in both Chambers, after testing for the circular causa-tion between social capital and political participacausa-tion. Secondly, we find that social norms and civicness play a prominent role, although with a different intensity. We can conclude therefore that greater involvement in politics and trust in the electoral process seems to be favored by an increase of community social norms and civic participation.
Table
4
Es
timates f
or t
he Chamber of Deputies and t
he Senate b y com ponent of t he Social Cat al ys t Chamber Senate (1) (2) (3) (4) (5) (6) (7) (8) (9) (10) Sc hool att ain -ment -1 0.6013 0.5153 0.1113 1.0577*** −0.0541 0.5908 0.5077 0.2512 1.1076*** 0.0374 (0.4171) (0.4294) (0.5541) (0.3822) (0.3987) (0.4262) (0.4066) (0.5166) (0.4067) (0.3845) Income ineq uality -1 −0.2787** −0.2287* −0.1925* −0.2955 −0.1803* −0.2957** −0.2487** −0.2305** −0.3257* −0.2055** (0.1240) (0.1315) (0.1020) (0.1800) (0.1076) (0.1258) (0.1247) (0.0945) (0.1736) (0.1026) W inning mar gin-1 −0.0001 −0.0001 −0.0004 0.0008 −0.000005 0.0002 0.0001 −0.0001 0.0012* 0.0002 (0.0005) (0.0005) (0.0005) (0.0007) (0.0006) (0.0004) (0.0004) (0.0004) (0.0007) (0.0005) log(pop. density) -1 0.0179*** 0.0181 0.0126 0.0154 0.0312** 0.0218*** 0.0228 0.0158 0.0201 0.0355*** (0.0065) (0.0162) (0.0110) (0.0125) (0.0134) (0.0083) (0.0153) (0.0129) (0.0127) (0.0133) Associations -1 0.9471*** 0.7918*** (0.1315) (0.1297) Blood donor s-1 4.2214*** 4.3181*** (0.8095) (0.9375) Ne wspaper s diff. -1 1.8505*** 1.8431*** (0.5921) (0.6263) Cor rup tion exposur e-1 −21.1425 −23.4911 (17.1936) (17.2033) TV t axpa yer s-1 0.3093*** 0.3121*** (0.0777) (0.0789)
* p<0.1; **
p<0.05; ***
p<0.01. Es
timates ar
e based on r
andom effects models. R
egionall y clus ter r obus t s tandar d er rors in br ac ke ts Table 4 (continued) Chamber Senate (1) (2) (3) (4) (5) (6) (7) (8) (9) (10) Int er cep t 0.7419*** 0.7606*** 0.7711*** 0.8358*** 0.4981*** 0.7290*** 0.7289*** 0.7498*** 0.8074*** 0.4658*** (0.0482) (0.0898) (0.0690) (0.0613) (0.1073) (0.0488) (0.0923) (0.0743) (0.0620) (0.1112) Obser vations 90 90 90 90 90 90 90 90 90 90 Time dummies ye s ye s ye s ye s ye s ye s ye s ye s ye s ye s R 2 0.5526 0.5756 0.5056 0.3942 0.5608 0.4877 0.5759 0.4849 0.3945 0.5492 Adjus ted R 2 0.5023 0.5279 0.4499 0.3260 0.5114 0.4300 0.5281 0.4269 0.3264 0.4985 Hausman tes t (p-v alue) 32.082 (<0.01) 16.187 (0.0631) 5.772 (0.7625) 19.089 (0.0244) 11.647 (0.234) 76.150 (<0.01) 10.774 (0.2915) 9.906 (0.3581) 10.660 (0.2997) 4.684 (0.8609)
Future studies may consider other methodologies that would allow to empirically test latent variables relationships, enriching the set of indicators for each latent variable and further developing our empirical contribution.
Appendix 1
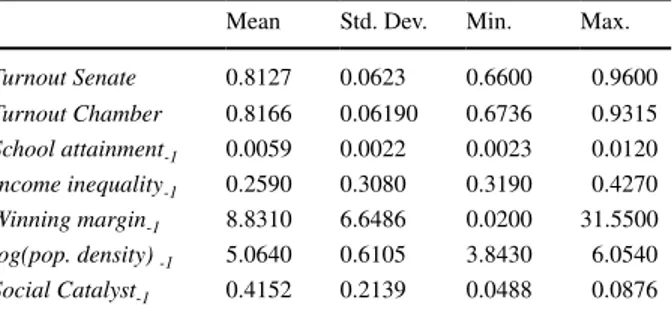
Table A1 Descriptive statistics Mean Std. Dev. Min. Max.
Turnout Senate 0.8127 0.0623 0.6600 0.9600 Turnout Chamber 0.8166 0.06190 0.6736 0.9315 School attainment-1 0.0059 0.0022 0.0023 0.0120 Income inequality-1 0.2590 0.3080 0.3190 0.4270 Winning margin-1 8.8310 6.6486 0.0200 31.5500 log(pop. density) -1 5.0640 0.6105 3.8430 6.0540 Social Catalyst-1 0.4152 0.2139 0.0488 0.0876
Table A2 Cor relation matr ix Tur nout -Chamber Tur nout -Senat e Sc hoolA t-tainm. −1 IncomeIneq. −1 W inning -mar gin −1 Log(pop. den.) −1 SocialCat -al ys t−1 Assoc. −1 Blooddo -nor s−1 Ne wspap. diff. −1 Cor rup -tione xpo -sur e−1 TVt axpa y-ers−1 Tur nout Chamber 1.0000 Tur nout Senat e 0.9799 1.0000 Sc
hool attain
-ment -1 0.0991 0.1507 1.0000 Income ineq ual -ity-1 −0.3215 −0.3221 −0.3247 1.0000 W inning mar gin -1 0.3470 0.3636 −0.1976 −0.0535 1.0000 log(pop. density) -1 0.1941 0.2437 0.1746 0.2240 0.0431 1.0000 Social Cat al ys t-1 0.7609 0.7710 0.2486 −0.3238 0.2934 0.0214 1.0000 Associa -tions -1 0.6737 0.6752 0.2019 −0.2799 0.3315 0.0029 0.9104 1.0000 Blood donor s-1 0.5640 0.5984 0.2437 −0.1729 0.2762 0.0186 0.7943 0.6153 1.0000 Ne wspaper s diff. -1 0.6088 0.5826 0.1430 −0.3313 0.1375 0.1145 0.7203 0.6667 0.2082 1.0000 Cor rup tion expo -sur e-1 −0.4049 −0.4178 0.3697 −0.0672 −0.1550 −0.0009 −0.3191 −0.3040 −0.2822 −0.1229 1.0000 TV t axpa y-ers-1 0.6405 0.6487 0.2103 −0.3633 0.1109 −0.1417 0.7987 0.6731 0.4552 0.7211 −0.2871 1.0000
Funding Open access funding provided by Università degli Studi di Roma La Sapienza within the CRUI-CARE Agreement.
Open Access This article is licensed under a Creative Commons Attribution 4.0 International License,
which permits use, sharing, adaptation, distribution and reproduction in any medium or format, as long as you give appropriate credit to the original author(s) and the source, provide a link to the Creative Com-mons licence, and indicate if changes were made. The images or other third party material in this article are included in the article’s Creative Commons licence, unless indicated otherwise in a credit line to the material. If material is not included in the article’s Creative Commons licence and your intended use is not permitted by statutory regulation or exceeds the permitted use, you will need to obtain permission directly from the copyright holder. To view a copy of this licence, visit http://creat iveco mmons .org/licen ses/by/4.0/.
References
Albanese, G., & de Blasio, G. (2016). Civic capital and development: Italy, 1951–2001. Politica Economica
- Journal of Economic Policy, 1, 47–64.
Almond, G., & Verba, S. (1963). The civic culture: Political attitudes and democracy in five nations. Prince-ton University Press: PrincePrince-ton.
Ambrosanio, M. F., Bordignon, M., & Cerniglia, F. (2010). Constitutional reforms, fiscal decentralization and regional fiscal flows in Italy. In: N. Bosch, M. Espasa, & A. Solé Ollé (Eds.), The political
econ-omy of inter-regional fiscal flows (pp. 75–107). London: Edward Elgar.
ASIG (2001). Rapporto 2011 sull’industria dei quotidiani in Italia. Roma.
Atkinson, M., & Fowler, A. (2014). Social capital and voter turnout: Evidence from Saint’s Day fiestas in Mexico. British Journal of Political Science, 44, 41–59.
Barone, G., Cannari, L., & Mocetti, S. (2012). Gli italiani e l’atteggiamento nei confronti del fisco. In A. Gentile & S. Giannini (Eds.), Evasione fiscale e tax compliance. Bologna: Il Mulino.
Barone, G., de Blasio, G. (2010). Il capitale sociale. In Il Mezzogiorno e la politica economica dell’Italia, Seminari e Convegni, 4, Banca d’Italia, Roma.
Table A3 First stage regression
* p<0.1; **p<0.05; ***p<0.01. Regionally cluster robust standard
errors in brackets
Dependent variable: Social Catalyst Variable
School attainment 6.3177*** (2.0186) Income inequality −0.5879 (0.5977) Winning margin 0.0073** (0.0033) log(pop. density) −0.0974*** (0.0366) Free city-state 0.0216*** (0.0033) Constant 0.5780 (0.2342) Observations 90
Time dummies yes
R2 0.4501
Adjusted R2 0.3882
Becker, W., Paruolo, P., Saisana, M., & Saltelli, A. (2015). Weights and importance in composite indicators: Mind the gap. In R. Ghanem, D. Higdon, & H. Owhadi (Eds.), Handbook of uncertainty
quantifica-tion. Cham: Springer.
Bertrand, M., Luttmer, E. F. P., & Mullainathan, S. (2000). Network effects and welfare culture. Quarterly
Journal of Economics, 115, 1019–55.
Bigoni, M., Bortolotti, S., Casari, M., Gambetta, D., & Pancotto, F. (2016). Amoral familism, social capital, or trust? The behavioural foundations of the Italian North-South divide. The Economic Journal, 126, 1318–41.
Blais, A. (2000). To vote or not to vote: The merits and limits of rational choice theory. Pittsburgh: Univer-sity of Pittsburgh Press.
Bourdieu, P. (1986). The forms of capital. In J. G. Richardson (Ed.), Handbook of theory and research for
the sociology of education (pp. 241–258). New York: Greenwood Press.
Bowles, S., & Gintis, H. (2002). ‘Social Capital’ and community governance. Economic Journal, 112, 419–36.
Bracco, E., De Paola, M., & Green, C. P. (2015). Long lasting differences in civic capital: Evidence from a unique immigration event in Italy. Journal of Economic Behavior and Organization, 120, 160–173. Brehm, J., & Rahn, W. (1997). Individual level evidence for the causes and consequences of social capital.
American Journal of Political Science, 41, 881–1023.
Buonanno, P., Montolio, D., & Vanin, P. (2009). Does social capital reduce crime? The Journal of Law and
Economics, 52, 145–170.
Burt, R. S. (2000). The network structure of social capital R., in I. Sutton and B. M. Shaw (eds.), Research in
organizational behavior, Greenwich, JAI Press.
Campante, F., Durante, R., & Sobbrio, F. (2018). Politics 2.0: The multifaceted effect of broadband internet on political participation. Journal of the European Economic Association, 16, 1094–1136.
Cartocci, R. (2011). Capitale sociale. In M. Almagisti & D. Piana (Eds.), Parole-chiave della politica italiana. Carocci: Roma.
Cartocci, R. & Vanelli, V. (2015). Una mappa del capitale sociale e della cultura civica in Italia’. L’Italia e le sue
regioni. L’età repubblicana. Società Istituto Enciclopedia Italiana Treccani, Roma, 17–36.
Chang, E. C. C., Golden, M. A., & Hill, S. I. (2010). Legislative malfeasance and political accountability. Word
Politics, 62, 177–220.
Coleman, J. (1988). Social capital in the creation of human capital. American Journal of Sociology, 94, 95–120. Fieldhouse, E., & Cutts, D. (2012). The companion effect: Household and local context and the turnout of
young people. The Journal of Politics, 74, 856–869.
Crescenzi, R., Gagliardi, L., & Percoco, M. (2013). Social capital and the innovative performance of Italian provinces. Environment and Planning, 45, 908–29.
Crescenzi, R., & Rodríguez-Pose, A. (2012). Infrastructure and regional growth in the European Union. Papers
in Regional Science, 91, 487–615.
de Blasio, G., Scalise, D., & Sestito, P. (2014). Universalism vs. particularism: a round trip from sociology to economics. Questioni di Economia e Finanza (Occasional Papers), 212, 6–37.
de Blasio, G., & Nuzzo, G. (2010). Historical traditions of civicness and local economic development. Journal
of Regional Science, 50, 833–57.
Decancq, K., & Lugo, M. A. (2013). Weights in multidimensional indices of wellbeing: An overview.
Econo-metric Reviews, 32, 7–34.
Easton, D. (1965). A systems analysis of political life. New York: Wiley.
Filippin, A., Fiorio, C. V., & Viviano, E. (2013). The effect of tax enforcement on tax morale. European
Jour-nal of Political Economy, 32, 320–331.
Fiorino, N., & Galli, E. (2013). La corruzione in Italia. Bologna: Il Mulino.
Freudenberg, M. (2003). Composite indicators of country performance: a critical assessment. OECD Science,
Technology and Industry Working Papers. Paris: No. 2003/16, OECD Publishing.
Fukuyama, F. (1995). Trust. New York: Free Press.
Gentzkow, M., Shapiro, J., & Sinkinson, M. (2011). The effect of newspaper entry and exit on electoral politics.
American Economic Review, 101, 2980–3018.
Gerber, A., Green, D., & Larimer, C. (2008). Social pressure and voter turnout: Evidence from a large-scale field experiment. American Political Science Review, 102, 33–48.
Geys, B. (2006). Explaining voter turnout: A review of aggregate-level research. Electoral Studies, 25, 637–663. Goletsis, Y., & Chletsos, M. (2011). Measurement of development and regional disparities in Greek periphery:
A multivariate approach. Socio-Economic Planning, 45, 174–183.
Glaeser, E. L., Laibson, D. I., & Sacerdote, B. (2002). An economic approach to social capital. The Economic
Goodin, R., & Dryzek, J. (1980). Rational participation: The politics of relative power. British Journal of
Politi-cal Science, 10, 273–292.
Gronlund, K., & Setala, M. (2007). Political trust, satisfaction and voter turnout. Comparative European
Poli-tics, 5, 400–422.
Guiso, L., Sapienza, P., & Zingales, L. (2016). Long term persistence. Journal of the European Economics
Association, 14, 1401–1436.
Guiso, L., Sapienza, P., & Zingales, L. (2008). Social capital and good culture. Marshall Lecture, Journal of the
European Economics Association, 6, 295–320.
Guiso, L., Sapienza, P., & Zingales, L. (2004). The role of social capital in financial development. American
Economic Review, 94(3), 526–556.
Hansen, L. P. (1982). Large sample properties of generalized method of moments estimators. Econometrica, 50, 1029–1054.
Henn, M., Weinstein, M., & Hodgkinson, S. (2007). Social capital and political participation: understanding the dynamics of young people’s political disengagement in contemporary Britain. Social Policy and Society,
6(4), 467–479.
Istat (various years). Annuario delle statistiche giudiziarie. Roma: Istat. Istat (2018). Rapporto sulla Conoscenza in Italia. Istat: Roma.
Krishna, A. (2007). How does social capital grow? A seven-year study of villages in India. Journal of Politics,
69, 941–56.
Norris, P. (Ed.). (1999). Critical citizens – global support for democratic government. Oxford University Press: Oxford.
Matsusaka, J. G., & Palda, F. (1993). The Downsian voter meets the ecological fallacy. Public Choice, 77, 855–878.
Meltzer, A. H., & Richard, S. F. (1981). A rational theory of the size of government. Journal of Political
Econ-omy, 89, 914–27.
Mutz, D. (2002). The consequences of cross-cutting networks for political participation. American Journal of
Political Science, 46, 838–55.
Nardo, M., Saisana, M., Saltelli, A., & Tarantola, S. (2008). Handbook on constructing composite indicators:
Methodology and user guide OECD, European Commission. Joint Research Centre: OECD Publishing.
Pontarollo, N., & Serpieri, C. (2020). A composite policy tool to measure territorial resilience capacity.
Socio-Economic Planning Sciences, 70, 100669.
Prior, M. (2005). News vs. entertainment: How increasing media choice widens gaps in political knowledge and turnout. American Journal of Political Science, 49, 577–592.
Putnam, R. (1993). Making democracy work: Civic traditions in modern Italy. Princeton, N.J.: Princeton Uni-versity Press.
Putnam, R. (2000). Bowling alone: The collapse and revival of American community. New York: Simon and Schuster.
Stolle, D. (1998). Bowling together, bowling alone: The development of generalized trust in voluntary associa-tions. Political Psychology, 19, 497–526.
Tabellini, G. (2010). Culture and institutions: Economic development in the region of Europe. Journal of the
European Economic Association, 8, 677–716.
Uslaner, E. M. (2002). The moral foundations of trust. UK: Cambridge University Press.
Uslaner, E. M., & Brown, M. (2005). Inequality, trust, and civic engagement. American Politics Research, 33, 868–894.
Verba, S., Schlozman, K. L., & Brady, H. E. (1995). Voice and equality: Civic voluntarism in American
politics. Cambridge: Harvard University Press.
Publisher’s Note Springer Nature remains neutral with regard to jurisdictional claims in published maps and