LABOR MARKET RIGIDITY, SOCIAL POLICIES AND THE LABOR SHARE.
EMPIRICAL EVIDENCE BEFORE AND AFTER THE BIG CRISIS
MARIA LAURA PARISI
Department of Economics and Management, University of Brescia, via San Faustino 74/b, 25122 Brescia, Italy
Abstract
This paper provides evidence of the impact of three important and general policies shaping the degree of labor market rigidity on the labor share: welfare expenditures, government expenditures on active labor market programs, and passive labor market measures. It analyzes the impact of regulation such as the intensity of employment protection, and evaluates whether trade unions and the minimum wage institutions do play a role in the relationship between all measures and the labor share. Labor income share has experienced a declining trend since mid-1970s in most advanced economies, and existing literature found little if no correlation of this decline to general labor market characteristics. The present paper found, however, that some institutions are correlated to the downward trend, depending on the welfare system adopted, and that welfare and employment protection counteract the decline. Moreover, many countries saw an upsurge of their labor share after the burst of the financial crisis. Evidence of whether the effect of the policies weakened or reinforced the labor share after 2007 is reported.
JEL classification: E02, E25, H53
Keywords: labor income share, employment protection legislation, active labor market programs, minimum wage, welfare systems
1. Introduction
The last financial and economic crisis aggravated such macroeconomic distortions as unemployment, especially for the youngsters and of the long-term type, increasing social and income disparities, and hit macroeconomic distribution of income, as well. We are interested in the role of institutions in explaining this phenomenon. Every advanced economy has a set of established policies and institutions designed to reduce those disparities, in order to sustain households’ income. An extensive research on the effectiveness of institutions (such as, e.g., Employment Protection Legislation or wage bargaining process) on wage determination and employment exists. Part of these studies focus on attributing the decreasing path of the labor income share to globalization, labor-saving technological progress, or competition, but found little or no effect of labor market institutions. At the beginning of the new century and after the depression time 2008-2009, data reveal that European countries’ labor share declined more than Anglo-Saxon’s labor share. Labor share dynamics depends on factors moving the growth rates of real wages and labor productivity. Vergeer and Kleinknecht (VK, 2010) document that many European countries and Japan had substantially larger real wage growth and labor productivity growth than Anglo-Saxon countries, at least until 2005, but real wages growth followed close labor productivity growth in the latter more than in the former. For example, labor productivity growth declined from an average rate of 2.8% in 1963-1973, to 0.7% in 2003-2010 in the UK, and wage growth was 3.1% and 0.6% in the corresponding periods (UK Office for National Statistics, 2011). Scholars attribute the main causes of this different behavior to the reduction of union representation, accruing bargaining power of employers, inducing (downward) wage flexibility. In Europe, however, unions may have a role in increasing productivity by providing agency services, which boost both the supply of and demand for firm-specific human capital (Young and Zuleta, 2011, and the literature mentioned there). More stringent employment protection legislation and more generous unemployment benefits counteract flexibility of European labor markets (less wage flexibility and higher hiring/firing costs). Furthermore, lower demand for unskilled labor, due to ICT revolution of the 1990s, deregulation and more competition in product markets, and lower barriers to entry pushed productivity growth up in Europe at the end of the 1990s. Vergeer and Kleinknecht (VK, 2014) argue that the higher productivity of European workers is due to labor-capital substitution induced by labor-saving technological change, slow innovative process of ‘creative destruction’, longer job tenure,
training and firm loyalty. Furthermore, they argue that lower employment protection forces workers to work more hours to reach the same GDP growth rate (VK, 2014, p.382), as happened in Anglo-Saxon countries, thus resulting in jobs with lower productivity. As labor productivity behaves differently in each country, real wage changes are not the only drivers of change in the LS (Bentolila and Saint-Paul, 2003). This paper follow the empirical approach of these authors and Young and Zuleta (2011) to estimate the impact of social policy expenditures and labor market institutions on the labor share, controlling for factors such as globalization, (labor-saving or skill-biased) technological progress, competition, physical and human capital accumulation, and labor force participation. Finally, it provides an empirical analysis of whether the impact of each policy weakened after the beginning of the crisis. The structure of the paper follows next. Section 2 reviews the empirical literature on the main determinants of the labor income share. Section 3 provides a description of the diverse labor market institutions and government social policies characterizing countries in our sample, and discusses the expected impact of such institutions on the Labor Share. Section 4 describes the data. Section 5 defines the econometric framework and discusses the results. Finally, Section 6 concludes.
2. The Main Determinants of the Labor Share
Many empirical studies gave different explanations to labor share decline, but there is not a consensus on how such factors affected the labor share. Bentolila and Saint-Paul (2003) use a production function approach (neoclassical or more general non-monotonic function) to show that the LS is a function of the Capital-Output ratio, which is in turn affected by changes in factor prices (real wages or real interest rates) and labor-augmenting technological progress. There are factors shifting the exact relationship between LS and Capital-Output, e.g. capital-augmenting technological progress (TFP) or imports of raw materials. When Capital/Output ratio and TFP shows the same estimated sign, technology is strictly capital augmenting. Both Jayadev (2007) and Jaumotte and Tytell (2007) explain that technological progress is biased towards saving technology rather than a labor-augmenting one. Guerriero and Sen (2012), on the other hand, find a positive correlation between the labor share and either international trade or technological progress. According to their results, exports of consumption goods and capital goods, and the consequent need for good managerial practices, lead to a rise in both employment and
wages, thus increasing the labor share. Karabarbounis and Neiman (2014), besides demonstrating that the labor share indeed declined, find that technological progress lowers the ratio, consistently with most previous literature. Bassanini and Manfredi (2012) find that ICT progress creates opportunities for innovations. However, innovations appear to be mostly labor-saving, thus lowering the labor share. Other scholars suggest that trade openness negatively affect the labor share (especially since the 1980s). Harrison (2005) and Guscina (2006) find that an increase in trade openness causes a decrease in the labor share, although globalization improves the general conditions of workers. Jayadev (2007), Jaumotte and Tytell (2007) find that globalization affects negatively the labor share, because it increases the mobility of workers and weakens the bargaining power of unskilled workers. Grossman and Rossi-Hansberg (2006) argue that the productivity-enhancing effect from trade in intermediates could be even larger than that in final goods because, in addition to a competition effect for producing sectors, trade in intermediates also reduces the costs of production of using sectors. Elsby, et al. (2013) in their analysis of the US economic activity, explore the relationship between offshoring (outsourcing or outward foreign investment) and the labor share. Offshoring the most labor-intensive component of US production, they argue, makes the remaining domestic part more capital-intensive, especially if capital-labor elasticity of substitution is high. Such a practice undermine workers’ position. Rodrick in 1997 claimed that increasing trade openness magnifies the amplitude of fluctuations in real wages at home and labor is exposed to high risk. The value of intermediate imports as a percentage of GDP is used here and expected to reduce the labor share.
Blanchard and Giavazzi (2003) searched for the effects of competition on the labor share. They found that deregulation in the product market (PM) may trigger subsequent deregulation in the labor market. With lower rents, induced by the goods market deregulation, workers may have no incentives to fight for a share of those rents. Nonetheless, reliable measures of product market regulation are available only at the level of network industries (see Bassanini and Manfredi, 2012) and no such measure is included here.
Guerriero and Sen (2012) put forward ‘kaldorian’ arguments to notice that if real investment demand increases, the returns to capital (and labor) adjusts in order to finance investments. Income distribution will support the right level of savings, shifting towards groups with higher savings propensity. An increase in investment may cause redistribution from wages to profits, and the expected impact of Investments on the LS is negative.
The amount of human capital that workers possess, as well, is an important determinant of the labor share. Guerriero and Sen (2012) argue that increasing human capital levels are associated to high wages and higher levels of employment, thus affecting positively the labor share. While (new) machineries are generally substitutes to unskilled labor, they are also complements to skilled labor. Arpaia, et al. (2009) show that the labor share responds negatively to an increase in the relative supply of skilled workers if skilled and unskilled labor are highly substitutive. Given an excess supply of skilled labor, its relative wage decreases (skill-premium), the labor demand for the unskilled decreases and the overall effect is negative. Even Bentolila and Saint-Paul (1998) show that the skill-mix of employed workers has the potential to affect the LS, moving it along the LS-Capital-Output schedule. Finally, activity rates in terms of labor force participation may alter the meaning of the share statistics because by supplying more (usually female) wage labor, in principle, households might sustain their incomes but at a very great non-pecuniary cost. Moreover, gender gaps in labor compensation and labor participation are significant. When women enter the labor force they are forced into or choose greater flexibility than men, accepting jobs with lower or no pay (Bettio and Rosenberg, 1999). In Germany, women earn on average 49.8 percent less income during their employment career (Boll, et al. 2017). In the US, gender pay gap has been narrowing over the last two decades (Hadavand and Thomas, 2013). Female participation rate increasing is associated to male participation decreasing into the labor force. This substitution effect contributes to the decline of the labor share. Therefore, female participation rate might be a better proxy of labor adjustment costs than employment changes, expected to reduce the aggregate labor share.
3. Labor Market Institutions and Social Policies
This section provides a discussion on important and general features shaping the degree of labor market flexibility. Strictness of employment protection depends usually on the implementation and content of the Employment Protection Legislation (EPL) in a country. EPL includes, among others, regulation on individual and collective dismissals and severance pay.1 As OECD (2004) argues, employment protection may diminish firms’ ability to
1 The measure of employment protection, developed by OECD back in 1999, is mainly based on legislative provisions, but it
also incorporates some aspects of contractual provisions and judicial practices. Provisions regarding fixed-term contracts and temporary work agencies are also considered. This component of the EPL index is intended to measure the restrictions on the
cope with a rapidly changing environment driven by globalization, technological change and the derived organizational innovation. European Commission (2003) and ILO both recommended governments to reform appropriately the employment legislation to balance the need of more flexibility in the labor market but with an eye on worker security. Although there has been convergence in reviewing the employment legislation across OECD countries, at least until mid-2000s, especially by introducing many different types of temporary work contracts, still quite a lot of variability exists across countries. In Denmark, for example, employment services seem to be rather effective in “activating” benefit recipients while EPL is moderate in this country – the so-called “flexicurity” approach. In countries like the US and New Zealand, only workers under collective agreements may benefit from severance pay, but the share of workers covered by collective agreements is quite low. Germany has 70% of its workers covered by collective agreements, but it does not have any severance pay in EPL, except for senior workers. France, Greece, and Spain, in Southern Europe, offer the strictest employment protection among OECD countries for temporary contracts, while not having particularly stringent provisions for regular contracts. EPL may therefore influence the labor market dynamics, and the aggregate level of employment in a countercyclical way (see e.g. Young, 2003), which is one component of the labor income share. We should expect to observe an average positive impact, if any, even if it is enforced by collective agreements like in the US or Germany, unless wage adjustments are possible. On the other hand, by strengthening the position of protected workers (“insiders”) in wage bargaining, EPL may have negative impacts on employment, raising labor costs indirectly through its effect on bargaining power.2 In the empirical literature, Guerriero and Sen (2012) argue that legal adjustments may protect workers when their bargaining power is weak. Therefore, the authors find a positive relationship between regulations and the labor share. Some other scholars in the past (e.g. Nickell, 1999, Besley and Burgess, 2004) found that this kind of impositions could have an ambiguous effect on employment levels. Summarizing, EPL should have a negative direct impact on the labor share, by reducing labor mobility, increasing hiring and firing costs, lowering labor demand. On the other hand, EPL serves both at protecting workers and at
use of temporary employment by firms, the type of work for which these contracts are allowed and their duration. OECD built also a separate index for the latter component of EPL.
2 Coordination and centralization of the wage bargaining process are also important factors in country classification. There is
an extensive literature about the possible “hump-shape” hypothesis relating the degree of wage centralization and market performance. See for example Traxler and Kittel (2000) for a thorough discussion of this topic. Given lack of updated data on these measures, the present paper is not using such a variable, but a general measure of union density.
reducing the negative impact of employment and income loss during recessions. Depending on the strength of these two forces, the impact on the labor share is an empirical issue.
Trade union density is a way of measuring potential union bargaining pressure.3 Union bargaining power on wages should positively affect the labor share, by lowering turnovers and dispersion of pays. Young and Zuleta (2011) argue that unions’ effect on the LS depends on the degree of substitutability of Labor and Capital: wage pressures push firms to substitute Capital to Labor. Nonetheless, the action of unions might prevent labor demand expansion. According to which force predominates, one can expect either a positive or a negative impact. Fichtenbaum (2011) provides empirical evidence for US manufacturing, in which union density is positively correlated to the labor share, and the decline in unionization in the US between 1997 and 2006 explains up to 16% of LS decline. Azmat et al. (2012) as well include trade union density as an explanatory variable in their model. Nonetheless, their estimate is not statistically significant.
Active labor market policies (ALMP) are capable of limiting the EPL-induced mechanisms, in particular reducing long-term unemployment and favoring hiring. ALMP are government expenditures on public employment services, training, subsidized employment such as direct job creation and incentives, job rotation and sharing, and supported employment and rehabilitation.4 Until 2005, Australia, Canada, New Zealand, the US and Norway spent on average 0.5% of GDP on ALMP, while European countries’ expenditure was on average 1% of GDP, with Denmark peaking at a high 5% (both on active and passive programs). Sweden government designed a multitude of active programs to lower the unemployment rate, especially after 1994, and the average expenditure on ALMP in Sweden in 1996-2000 was more than five times higher than in UK, and 27% higher than in Germany (Calmfors et al. 2004). However, countries have different targets: most Anglo-Saxon countries spent more on public employment services, training and programs for the disabled, while EU countries focused on employment incentives, direct job creation, and start-up incentives (Grubb and Puymoyen, 2008). In general, total "active" spending is typically distributed across transfers to (unemployed/young/trainees) individuals, transfers to
3 Bargaining coverage, instead, captures the ability of unions in defending minimum labor standards and employment
protection (Visser, 2006). This measure is therefore positively correlated to our EPL index and is not used in our analysis.
4 Starting in 2002, OECD adopted a new classification and definition of labor market programs, which changed the types of
programs to include according to Eurostat (2006). For the OECD countries belonging to EU and for Norway, these expenditures were re-classified going back to 1998, our first year of observation. See Grubb and Puymoyen (2008) for details.
employers and transfer to service providers, in the form of wages (OECD, 2014). Active programs such as training, employment incentives, direct job creation, early retirement, therefore, should all help increasing employment (unless a direct crowding-out effect of regular employment takes place due to subsidized employment). Nonetheless the intended and unintended effects of ALMP on the real wage rate is ambiguous, according to whether it helps at increasing labor productivity, the reservation wage of the unemployed (putting upward pressure on wages), job competition and matching (putting downward pressure, see Calmfors et al., 2004). The general effect on the labor share is an empirical issue.
Passive labor market policies (PLMP) include “unemployment subsidies”. Sometimes PLMP strictly depend on the ALMP. In Scandinavian countries, for example, unemployed people receive subsidies conditional to entering active programs, such as training and job search since the first day of unemployment. Schneider (2011) finds that unemployment benefits have a short run positive effects on wages (while employment reacts slowly) thus increasing the labor share. However, in the long run, employment is adjusted and the labor share could even decrease (especially for low-skilled individuals).
Welfare expenditures (Welfare) refer to government spending on public health, pensions and other forms of social assistance, including education, protection of the environment and access to cultural resources. Scandinavian countries are renowned to have adopted a “Nordic model”, where those services are extensively granted. Continental countries developed a “European Social model” and the others adopted a “Third Way”, with fewer and residual services provided to special categories of people.5 Policies such as household income subsidies or pensions, and public health, may increase the labor share, when for example governments spend on day care for children up to 6 years old, helping mothers to get back to their jobs.
Fixing a Minimum Wage (MW) is another form of salary protection given that it is usually binding for low-skilled occupations. Given that minimum wage keeps workers (in general, those employed in low-skilled occupations, the youngsters, women or part-time workers) income higher, but lower their labor demand (especially if the elasticity of substitution between skilled and unskilled labor is high), it is not clear whether such a policy favors
5 Southern European countries adopted a “Mediterranean Model”, which employs more than 50% of welfare expenditure on
the labor share (ceteris paribus). A minimum wage scheme affects the earning distribution in at least three ways: reducing the proportions of workers earning below the minimum, increasing the proportion of those earning exactly the minimum and affecting those earnings above the minimum wage (see OECD, 1998). In the empirical analysis, countries are also grouped according to whether they have such regulations or not (Italy is in the no-minimum-wage group, although it has a similar system of minimum requirements in collective bargaining.).6
4. Data Description
Parisi and Penta (2015) document labor share trend in six large economies, where the decrease concerned European countries and Japan much more than the Anglo-Saxon countries. Similar patterns are documented in other research (e.g. Blanchard and Giavazzi, 2001, Boggio et al., 2010). In 1970-1990 period, the US labor share decreased by 3.3%, -2% in Canada, -1.9% in Australia. In Europe, the growth rate was -2% in Germany, -5.2% in France, -4.5% in Italy, -8.8% in the Netherlands. On average, Europe suffered by a larger decline, and this discrepancy is still present in later periods, even after the latest economic crisis (see Appendix A and IMF, 2007, p.168). Most of the decline in the labor share can be attributed to the fall in unskilled sectors, which was more pronounced in Europe and Japan than in the Anglo-Saxon countries. The income share of labor in skilled sectors, on the other hand, has been rising, especially in Anglo-Saxons where it increased by about 5 percentage points.
This section reports evidence on five groups of (25) countries with complete observations between 1998 and 2014 on the labor share and other factors. Groups differ for their features in terms of labor institutions, welfare expenditures and educational systems.7,8 Labor income share is composed of returns to skilled and unskilled labor, or, in other words, to human capital and raw labor. Human capital consists of past investments in education, training and experience, and raw labor is the remuneration of a zero-skill labor (Prados de la Escosura and Rosés,
6 The no-minimum-wage group includes Austria, Denmark, Finland, Iceland, Italy, Norway, and Sweden.
7 Anglo-Saxons are Australia, Canada, Iceland, Ireland, New Zealand, United Kingdom and USA; Southern Europe includes
France, Greece, Italy, Portugal and Spain; Continentals include Austria, Belgium and Germany; Scandinavian countries are Denmark, Finland, Netherlands, Norway and Sweden; New EU Members include Czech- Republic, Estonia, Hungary, Poland and Slovakia. This classification is widely used in the literature. Esping-Andersen (1990) proposed this grouping, and Ebbinghaus (2012) compared and enlarged different welfare state regimes in OECD countries.
8 Educational systems vary across countries even within homogeneous groups. In Scandinavian countries like Finland,
government finances student education from 6 years old to university degree, entirely free, with one of the highest percentage of GDP devoted to education among the OECD countries. Germany adopts a ‘dual’ system of education and work. Southern countries have a ‘sequential’ model of school to work transition.
2003, Schneider, 2011). Thus, the value of the labor share is determined by the level of employment, total labor compensation and the value added:
𝐿𝑆𝑖𝑡 =
𝑊𝑎𝑔𝑒 𝑐𝑜𝑚𝑝𝑒𝑛𝑠𝑎𝑡𝑖𝑜𝑛 𝑜𝑓 𝑒𝑚𝑝𝑙𝑜𝑦𝑒𝑒𝑠
𝑉𝑎𝑙𝑢𝑒 𝐴𝑑𝑑𝑒𝑑 ∗
𝐸𝑚𝑝𝑙𝑜𝑦𝑒𝑒𝑠 + 𝑆𝑒𝑙𝑓 − 𝑒𝑚𝑝𝑙𝑜𝑦𝑒𝑑 𝐸𝑚𝑝𝑙𝑜𝑦𝑒𝑒𝑠
This ‘adjusted’ definition is standard according to the discussion in OECD (2004) and Gollin (2002).9
Fig.1 illustrates the trend of LS for all groups. Anglo-Saxon countries labor share declined over the entire period, reaching a minimum in 2011 (61%).10 Continental countries converged to a minimum 61.5% in 2007, with a U-shaped trend. Southern European countries, in the ten years going from 1996 to 2006, saw a converging downward trend, spreading out a bit after 2007. Scandinavian countries low labor share declined until 2006 (59%), then grew by more than 5 percent points, and remained stable thereafter. The right panel shows the labor share dynamics for New EU members compared to Anglo-Saxons. Although for this group the labor share is quite low (53% in 2006), its trend is similar to Scandinavian and Continental U-shape (there is no converging or diverging trend within this group).
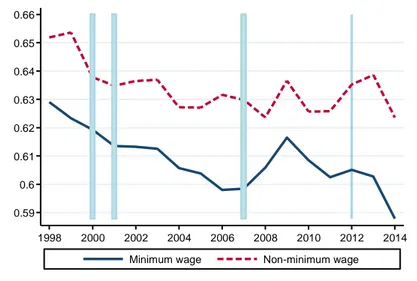
Next, the 25 countries are divided in two groups, those implementing currently a minimum wage policy and those that do not (see footnote 6). Fig. 2 shows the average labor share for minimum wage and non-minimum wage countries. Clearly, the latter have always had higher and more volatile labor income share over time. The minimum wage group’s labor share declined sharply until 2006, and increased again sharply until 2009. Minimum wage policy seems to insert a wedge on the average labor share, because the two groups do not show signs of convergence either before or after the burst of the crisis.
9 Gollin (2002) discusses the problem of considering self-employed workers’ compensation, which is missing in the naive
measures of the Labor Share of National Income. One way of doing this, is assuming that self-employed average wage is equal to the average employees wage, which is a reasonable assumption for the richest countries.
10 Within Anglo-Saxons, the labor share behaves differently, where the US, Canada and Australia have experienced a
continuous decrease in their average labor share, the UK has a quite stable and high labor share over time, with a jump after 2007. Ireland‘s labor share is volatile, New Zealand, which has the lowest level of the labor share in the group, saw it constantly increasing at least until 2008. See Figure A4 in Appendix A.
Fig. 1 LABOR SHARE OF COUNTRIES BY GROUP
Fig. 2 MINIMUM WAGE ADOPTING AND NON-ADOPTING COUNTRIES’LABOR SHARE
Notes: Blue bars denote years of economic recession. Source: OECD database with elaboration of the author.
It is interesting to notice that the big crash has actually reversed the trend in labor income share almost everywhere, with larger fluctuations, with the exception of the Anglo-Saxon group.
Table 1 reports descriptive statistics of all variables of interest. Capital-Output ratio is the ratio of the real Capital Stock to GDP. The sum of exports and imports over GDP measures trade openness. Imports of intermediates are
0.59 0.6 0.61 0.62 0.63 0.64 0.65 0.66 1998 2000 2002 2004 2006 2008 2010 2012 2014 Minimum wage Non-minimum wage
Labor Share by Minimum Wage
0.53 0.54 0.55 0.56 0.57 0.61 0.615 0.62 0.625 0.63 0.635 0.64 0.645 0.65 1998 2000 2002 2004 2006 2008 2010 2012 2014 Anglo-Saxons New EU members, right scale 0.6 0.61 0.62 0.63 0.64 0.65 0.66 0.67 0.68 1998 2000 2002 2004 2006 2008 2010 2012 2014 Anglo-Saxons Scandinavian Continental Southern EU
an alternative measure capturing offshoring. Technological progress is measured with TFP levels, growth and/or by country’s distance from US frontier (calculated as each country’s GDP difference from US GDP, over US GDP). A low index means that a country is close to the frontier (it is technologically advanced). Investment in physical capital is the intensity of fixed capital formation to GDP. Human capital is measured by the share of labor force individuals with tertiary education. Female participation rate is the share of female labor force in active population.11 The average labor share in the seventeen years until 2014 spans from lowest 54.6% of New EU Members to 64.4% of Continental countries and 64.6% in Southern Europe.
In terms of welfare spending, there appear to be two main routes: core European countries, including Southern, Continental and Scandinavian, reserve at least one fourth of their GDP to pensions and public health. Peripheral European countries, similarly to Anglo-Saxons, devote much less to those items.
Active Labor Market expenditures have a peak in Scandinavian countries (1.22% of GDP, it was 2.68% until 2012). Passive Labor Market measures absorb 1.96% of GDP in Southern Europe and 0.5% in New EU Members. Everywhere but in the latter group, Passive policy expenditures are about the double of Active policy, on average. Employment Protection index is lowest in Anglo-Saxon countries (1.64) and highest in Southern Europe (2.98), where a higher value indicates more protection (against firing, to get high severance pay, etc.). Overall, the US, the UK and Canada remain the least regulated countries, while Southern Europe has the highest level of protection, with some exception in France and Italy.
Trade Union density is the percentage of employees enrolled in a union, over total employment. Trade Union wages is the sum of wages of union members over total wages paid to employees.12 Both variables indicate that almost 60% of employees are enrolled in a trade or labor union in Scandinavian countries, versus 20.8% in Southern Europe, 33% in Anglo-Saxons or about 17% in New European members.
11 Information on most variables come from several OECD databases. TFP growth comes from the Conference Board (2015),
however levels here are missing for 9 countries of the sample. TFP level (in current PPPs, USA=1) thus comes from the Penn World Table, April 2015 update, as well as real Capital Stock at current PPPs (in million 2011 US$). The shares of educated labor force come from World Development Indicators - Worldbank. Female participation rate is downloaded from UNCTAD data.
12 The correlation between these two measures is 0.96 on average across countries. We then use the wage ratio in the regression
Table 1
DESCRIPTIVE STATISTICS: 1998-2014
Anglo-Saxons Scandinavia Continental Southern Europe New EU members All countries
Labor Share 0.631 0.620 0.644 0.646 0.546 0.616 Welfare 13.13 18.29 20.87 20.45 15.46 17.02 ALMP 0.350 1.22 0.828 0.655 0.290 0.630 PLMP 0.705 1.55 1.96 1.21 0.518 1.09 OSS 3.67 4.19 3.12 2.20 2.51 3.18 EPL 1.64 2.48 2.82 2.98 2.42 2.37
Trade union wages 32.91 57.78 36.12 20.82 16.89 32.65
Trade openness 52.11 77.87 105.56 38.57 68.61 64.3
Import of Intermediates 11.51 18.16 27.50 11.94 21.14 16.8
Distance to US 18.12 11.77 19.63 36.88 58.19 28.8
Distance to Norway 25.43 20.08 26.95 42.50 62.56 35.4
Investments 22.53 23.84 21.35 19.12 14.55 20.4
Capital Output ratio 3.27 3.48 3.59 4.33 3.26 3.56
TFP level 0.895 1.04 0.938 0.820 0.594 0.854
Secondary education 44.15 47.67 53.21 33.57 68.49 48.69 Tertiary education 33.18 31.23 26.30 22.63 20.90 27.40 Female participation 71.8 75.0 64.74 60.78 62.62 67.53 Unemployment rate 6.14 5.65 6.85 10.98 10.82 8.03 Observations 119 85 51 85 85 425 Countries 7 5 3 5 5 25
Notes: Mean values for each group. Welfare is the percentage of GDP devoted to welfare expenditures (elders, survivors, impaired, health expenditures). ALMP refers to Active Labor Market Policy (including PES and Administration, Training, Job Rotation and Sharing Incentives, etc.). PLMP refers to Passive Labor Market Policy (including subsidies for the unemployed). OSS refers to Other Social Spending (including family and housing). These variables are in percentage of GDP. EPL refers to Employment Protection Legislation OECD index measuring the strictness of employment protection, varying in the [0,6] interval: a higher index corresponds to higher protection. Trade union measures the percentage of wage and salary earners who are union members over total employees. Trade openness is the sum of Imports and Exports as a percentage of GDP. Import of intermediates measures the values of intermediate goods imported as a percentage of GDP. Distance to US measures distance to the technological frontier. The higher this value, the less innovative the country. We consider also Norway as the technological frontier and measure its distance as a percentage of Norwegian GDP (Distance to Norway). TFP level is total factor productivity relative to US TFP = 1. TFP growth measures yearly growth rate of country’s TFP (in %). Secondary education is the percentage of LF with at least a secondary degree. Tertiary education is the percentage of LF with a university or college degree. Female participation is the participation rate to labor force of 15-64 years old women. Unemployment rate is the average yearly national rate.
5. Econometric Framework and Results
This paper uses an “extended” general multiplicative functional form for the Labor Share as the aggregate version of Bentolila and Saint-Paul (BS, 2003) and Young and Zuleta (YZ, 2011) LS-Capital-Output schedule,
(1) 𝐿𝑆𝑖𝑡 = 𝑔(𝐴, 𝑘𝑖𝑡, 𝛼)𝜔(𝑍𝑖𝑡, 𝑋𝑖𝑡, 𝜀𝑖𝑡)
Where the sub-indices i and t refer to country and year, respectively. Function g(A,kit) captures the relationship of the labor share derived strictly from a production function approach (technological progress and capital-output ratio, kit), plus a country specific error term, αi. The separate (exponential) function ω(Zit,Xit) is an augmented form with respect to that conceived by BS (2003) or YZ (2011). Their original function is meant to capture all factors shifting the LS-k schedule or pushing the economy off that relationship.13 As discussed in Section 2 and Section 3, function ω(•) captures the potential effects of variables that are expected to influence the dynamics of the labor share, other than the Capital-Output ratio. According to previous research,
X
it includes measures of globalization,competition, and employment changes. In the present analysis, globalization is measured with imports of intermediates to capture international effects on labor demand. Instead of employment changes, that BS (2003) admit to be a poor proxy for labor adjustment costs, we include female participation rate and human capital accumulation measured by the share of tertiary educated workers. The rational under this choice is discussed in Section 2. The augmented function considers labor market institutions and policy variables as potential shifting factors, Zit ={Welfare, ALMP, PLMP, EPL, Union}. Finally, an idiosyncratic error captures possible shocks over countries or time. Both functions are expressed in multiplicative form as well, such that we express the LS (in log-linear form) as in equation (2),
(2) 𝑙𝑠𝑖𝑡 = 𝛽0+ 𝛽1Α𝑖𝑡+ 𝛽2ln 𝑘𝑖𝑡 + 𝜔1𝑊𝑒𝑙𝑓𝑎𝑟𝑒𝑖𝑡+ 𝜔2𝐴𝐿𝑀𝑃𝑖𝑡 + 𝜔3𝑃𝐿𝑀𝑃𝑖𝑡 + 𝜔4𝐸𝑃𝐿𝑖𝑡+ 𝜔5𝑈𝑛𝑖𝑜𝑛𝑖𝑡+ Γ′𝑋
𝑖𝑡+ 𝛼𝑖+ 𝜀𝑖𝑡
where 𝜀𝑖𝑡 is alternatively assumed to be a white noise or following an AR(1) process. Because the objective of this paper is to check for differences in the effects of labor market policies on the labor share in different groups of
13 In BS (2003) the ω(•) function reduces to h(X) where X includes oil prices, employment changes, labor conflict rate. Their
study however, as already mentioned, used industry data. YZ (2011) add to those variables a measure of uncertainty as the standard deviation of an industry value added, which cannot be used at this level of aggregation. See discussion in Section 2 for the expected impact of X variables of choice.
countries - and whether there was any difference before and after the crisis - equation (2) is estimated on the whole sample and on different panels. Moreover, interacting the right-hand-side variables in equation (2) with a dummy equal to 1 for years after 2006, corresponds to the assumption that parameters β and ω may vary over time, so eq.(2) becomes a “variable coefficients” model. Furthermore, equation (2) is estimated for Minimum Wage and Non-Minimum Wage countries separately. This method controls for any interaction existing between minimum wage and other policies affecting labor market outcomes, and income distribution. One of the common concerns in time series analysis of the labor share in levels is a potential presence of unit roots. Non-stationarity would force a re-specification of equation (2) in first or longer differences. After running the augmented Dickey-Fuller test for panel unit root, test and p-values are reported at the bottom of Table 2. The null hypothesis assumes that every panel in the sample presents a non-stationary labor share, versus the alternative that at least some of the panels have stationary share. The test runs both on the 1998-2014 span, and on the two time intervals occurring before and after the crisis, verifying that a deterministic trend and drift may affect the results. Given that the ADF test is not robust to structural breaks in time series, the alternative robust Phillips-Perron test for panel unit root is performed on the same null hypothesis. The results of the test reject the null hypothesis, in the overall interval, then labor share in the panel can be safely considered (drift) stationary. The result is, however, different when the sample is split, due to the evident structural break of 2007. The PP unit root test reveals the non-stationarity feature of the labor share (net of a drift) after the burst of the crisis.
5.1 Results
Errore. L'origine riferimento non è stata trovata.Table 2 shows the results of the within-group FE estimator
applied to equation (2) to the entire sample of countries. Column 1 reports benchmark estimates of the elasticities of LS to standard factors (K/Y, TFP level, Intermediate imports) plus LMI. Column 2 assumes that the residuals follow an AR(1) process, which seems reasonable when we look at the autocorrelogram of the residuals in column 1 (not reported) for few panels. Column 3 reports estimates when the set of explanatory variables is augmented with Human Capital and Female participation rate. Results in columns (4) to (8) are discussed in subsection 5.5. Complete regression results are reported in Table 2A and Table 2B in Appendix B. Capital/Output ratio and TFP
level have negative and significant estimated elasticities, as found in Bentolila and Saint-Paul (2003), meaning that technological progress is strictly capital-augmenting.14 Globalization appears to affect negatively the labor share, as in Guerriero and Sen (2012).15 However, Table 2A shows the share of employees with tertiary education negatively correlated to the labor share (as predicted in Guerriero and Sen, 2012). Tertiary education is highly correlated to the participation rate of women in the labor force. Female participation rates is negatively correlated as well. This result confirms the substitution effect of female participation to male participation, contributing to lower the labor share (due to gender pay gap, flexibility, low-paid jobs, and the like). Although female participation is always lower than men’s, the education level of those entering the labor force is higher than average. This might explains why the impact of tertiary education is negative on the labor share, for the whole sample.16
Differently from most of previous empirical literature, there is a significant effect of labor institutions and social policies on the labor share. Labor share responds strongly and positively to Welfare expenditures. Its estimated elasticity (+0.155) implies that a 10% increase in spending on welfare would accrue the labor share by 1.55%. Although LS is not significantly related to ALMP on average in the whole sample, it behaves differently before and after the break. On the other hand, LS elasticity to PLMP is robustly negative and significant. Indeed, the weak side effects of passive measures include disincentives to job search, long-run unemployment, and skill deterioration, which appear to more than compensate the intended benefits to support income, giving evidence of employment downward adjustment. EPL elasticity is either nil or significant and positive, as found in Guerriero and Sen (2012) or European Commission (2007), meaning that protection legislation has a positive effect on employment more than compensating the negative direct and indirect adjustment costs (due to bargaining power). Union representation is negatively correlated to the labor share. This might be due to the prevailing effect of
14 As Bentolila and Saint-Paul (2003) emphasized, if total factor productivity is strictly capital augmenting, it should come
out with the same sign as the capital/output ratio. When TFP growth substitutes TFP levels, its estimated sign is negative and significant as well.
15 We used other measure of technological progress or innovation, i.e. the total number of patents applications, the share of
patents with respect to the average of the group, Business R&D expenditures and the distance to Norway frontier. Distance to US frontier appears to be the most correlated variable to the labor share.
16 While the unconditional correlation between tertiary education and female participation is high (0.492 at 1% level), tertiary
education is also slightly positively correlated to ALMP (0.104 at 5% level). The evidence in Appendix A may capture the fact that part of ALM programs are targeted to highly educated women in the labor force.
bargaining pressure on depressing labor demand. When introducing AR(1) error dynamics in Column 2, results lose their statistical significance for PLMP, ELP and Trade union, whose variability is not typically high enough. Table 2
ELASTICITIES FOR ALL COUNTRIES,1998-2014,LABOR MARKET INSTITUTIONS
(1) (2) (3) (4) (5) (6) (7) (8)
standard standard (1)+HC+FP (1) var. coeff. Test (3) var. coeff.
𝜀~𝑊𝑁 𝜀~𝐴𝑅(1) 𝜀~𝑊𝑁 pre post pre post
Welfare 0.145*** 0.163*** 0.155*** 0.115*** 0.142*** 0.132*** 0.160*** (0.0295) (0.0289) (0.0284) (0.0285) (0.0329) [0.17] (0.0279) (0.0320) ALMP 0.004 -0.002 0.006 -0.017** 0.031*** -0.013 0.029*** (0.0087) (0.0093) (0.0084) (0.0086) (0.0106) [0.00] (0.0085) (0.0106) PLMP -0.021*** -0.016** -0.020*** 0.004 -0.028*** 0.005 -0.029*** (0.0069) (0.0067) (0.0066) (0.0084) (0.0076) [0.00] (0.0084) (0.0074) EPL 0.038 0.050 0.059** 0.136*** 0.064* 0.097*** 0.064* (0.0303) (0.0342) (0.0290) (0.0338) (0.0332) [0.00] (0.0373) (0.0326) Union -0.044* 0.017 -0.111*** -0.005 -0.025 -0.071** -0.080*** (0.0240) (0.0413) (0.0251) (0.0258) (0.0236) [0.00] (0.0279) (0.0250) Obs. 425 400 425 425 425 Countries 25 25 25 25 25 R2 within 0.264 0.302 0.338 0.383 0.431 ADF (p=1) [0.023] [0.000] [0.000] PP (p=1) [0.032] [0.000] [0.381]
Notes: Standard errors in parentheses, p-values in brackets. *α≤0.10, **α≤0.05, ***α≤0.01. Within-group FE estimates. Original
specification contains a constant term. ADF(p=1) is the Augmented Dickey-Fuller test for panel unit root of the ln-Labor Share. PP is the Phillips-Perron panel unit root test, which is robust to structural breaks in the series. Standard regression includes K/Y, TFP level, Intermediate imports. Augmented regression includes HC: Tertiary educated labor force share. FP: Female participation rate. Pre-crisis refers to period before the crisis initial year (FC=0 if t<2007), Post-crisis refers to period t≥2007 (FC=1). Wald test of equality of coefficients across the two periods (4) and (5).
5.2 Labor Market Institutions by country grouping
Table 3 reports the contributions of each group of countries to the average elasticities of the augmented model in Column 7 and 8 of Table 2 (differential effects over subpopulations of countries). Welfare elasticities are below the average for Anglo-Saxon and New EU Members, and above average for all other groups. Continental and Southern Europe have the highest (positive) estimates, while Anglo-Saxons have the lowest elasticity (0.120). It turns out that the ‘European model’ as well as the ‘Mediterranean model’ are the most successful at sustaining the labor share through Welfare. Scandinavia has the highest estimates for ALMP, as expected, although on average this is not significant, while Anglo-Saxons and New EU countries have a negligible estimated elasticity. Significant results turn out when considering the structural break in subsection 5.5. Passive measures seem to be mostly detrimental to Continental Europe’s LS (-0.036, highly significant), because they are not accompanied by active programs. New EU members have the lowest estimated elasticity to PLMP (-0.01) although it is still significant at 1% level, due to their more recent experience of high unemployment at the end of the 1990s (see Appendix A, Figure A9). Employment Protection helps at sustaining the labor share mostly in Southern Europe (+0.074) and Continental Europe (+0.070), while it is below average in Anglo-Saxon countries (+0.041). It either helps or soften the negative impact of trade union and PLMP, and does not appear to have increased labor adjustment costs. Trade union density appears detrimental especially in Scandinavia (-0.197) and, to a lower extent, Continental Europe (-0.123) where the model predicts a predominant negative impact on labor demand. All other elasticities are below average (in absolute value), yet the estimates are negative, contrary to what found in the literature.
Table 3
DECOMPOSITION OF MARGINAL EFFECTS FOR COUNTRY GROUPS AND STRUCTURAL BREAK
Anglo-Saxons Scandinavians Continental Southern EU New EU Members Welfare FC=0 0.101*** 0.143*** 0.166*** 0.154*** 0.121*** (0.021) (0.030) (0.035) (0.033) (0.026) FC=1 0.125*** 0.169*** 0.191*** 0.197*** 0.143*** (0.025) (0.034) (0.038) (0.040) (0.029) ALMP FC=0 -0.007 -0.026 -0.017 -0.013 -0.005 (0.005) (0.017) (0.011) (0.009) (0.003) FC=1 0.016*** 0.054*** 0.038*** 0.031*** 0.015*** (0.006) (0.020) (0.014) (0.011) (0.005) PLMP FC=0 0.003 0.008 0.009 0.005 0.002 (0.005) (0.014) (0.015) (0.008) (0.004) FC=1 -0.020*** -0.035*** -0.051*** -0.035*** -0.014*** (0.005) (0.009) (0.013) (0.009) (0.004) EPL FC=0 0.064*** 0.100*** 0.113*** 0.124*** 0.100*** (0.025) (0.039) (0.044) (0.048) (0.039) FC=1 0.046** 0.067** 0.077** 0.077** 0.063** (0.023) (0.034) (0.039) (0.040) (0.032) TU FC=0 -0.071** -0.124** -0.078** -0.044** -0.043** (0.028) (0.049) (0.031) (0.017) (0.017) FC=1 -0.082*** -0.144*** -0.089*** -0.054*** -0.033*** (0.026) (0.045) (0.028) (0.017) (0.010)
Notes: Standard errors in parentheses. *α≤0.10, **α≤0.05, ***α≤0.01. Based on total sample observations, these are estimated elasticities decomposed by country group and time-period. FC=1 refers to time t>2006. Other variables are K/Y, TFP level, Intermediate imports, HC: Tertiary educated labor force share, FP: Female participation rate.
5.3 Minimum Wage
Once dividing countries into the group implementing the minimum wage policy (18 countries), at least during the sample period (MW), versus the group that never adopted this measure until 2014 (NMW, 7 countries), the estimated elasticities are reported in Table 4. Governments may sustain household income through tax schemes, preferring pre-tax and pre-transfer income distribution policies, such as the minimum wage, or adopting post-tax post-transfer distribution policies such as tax credits and welfare benefits. These two approaches are part of the so-called “redistributive policies” (Castater, 2015) to alleviate the problem of inequality and unemployment. Indeed, they are found to reinforce each other at least for some individual categories, improving distributional effects (Neumark and Wascher, 2011). Table 4 shows that Welfare effects are strongly positive for NMW (+0.361), overall, while it is smaller in MW countries (+0.06), meaning that MW countries are less inclined to simultaneously adopt the two schemes discussed above. AMLP elasticity is never significant for both groups on average. Nonetheless, there is a significant change from pre-crisis to post-crisis period for MW countries.17 Passive measures seem to be negatively correlated to LS only for NMW, in the whole period, while they are even positive for MW countries in the pre-crisis period, turning insignificant thereafter. EPL effect is positively correlated with the labor share in minimum wage countries, while positive but not significant in the other group. Overall, minimum wage policy interacts with the other re-distributional policies in a significant way, modifying their intended impact on the labor share, or even lessen them. Trade union, on the other hand, has negative impact on the LS for both groups, significant in MW only.
Tertiary education is negatively correlated to the LS in both groups (with the exception of NMW in the post-crisis period, where its impact is null). Female participation rate has a depressing effect just in the NMW group, overall and across time periods, while it has not significant impact in the MW countries, where the substitution effect between female and male in minimum wage occupations is much smaller.
17 Active Labor Market measures effects on the labor share appear to be offset by capital-labor substitutability and total
factor productivity. If these latter variables are omitted, ALMP turns positive and significant in all model specifications. Unconditional correlation of ALMP to LS is 0.2143 significant at 1% level, and to TFP level is 0.4556 (at 1%). Active programs help at increasing TFP (and viceversa). This might explain why a negative effect of TFP on the LS makes ALMP almost never significant (apart from splitting the time interval, as shown next).
Table 4
ELASTICITIES FOR MINIMUM WAGE (MW) AND NON MINIMUM WAGE (NMW)COUNTRIES
MW NMW MW NMW
Pre Post Pre Post
Welfare 0.061* 0.316*** 0.062** 0.093** 0.274*** 0.352*** (0.0332) (0.0523) (0.0300) (0.0376) (0.0713) (0.0640) ALMP 0.010 0.007 -0.021* 0.016 -0.008 -0.000 (0.0121) (0.0119) (0.0119) (0.0146) (0.0132) (0.0163) PLMP 0.003 -0.066*** 0.021** 0.006 -0.063*** -0.061*** (0.0084) (0.0112) (0.0098) (0.0092) (0.0152) (0.0116) EPL 0.064** 0.039 0.175*** 0.110*** 0.100 0.056 (0.0325) (0.0878) (0.0408) (0.0351) (0.1139) (0.0880) Trade union -0.082*** -0.035 -0.045* -0.073*** 0.132 -0.058 (0.0214) (0.0737) (0.0237) (0.0207) (0.1058) (0.0963) Observations 287 138 287 138 Countries 18 7 18 7 R2 0.166 0.585 0.424 0.813
Notes: Standard errors in parentheses. *α≤0.10, **α≤0.05, ***α≤0.01. R2 is within group R-square. “Pre” refers to period before the crisis
initial year (<2007), “Post” refers to period 2007-2014. Other variables are K/Y, TFP level, Intermediate imports, HC: Tertiary educated labor force share, FP: Female participation rate.
5.4 Endogeneity Issue
As a robustness check, an instrumental variable estimator is applied to take into account potential endogeneity of some variables, in order to reduce reverse causation bias. Endogeneity may affect either main policy and LMI variables, and/or Capital/Output ratio, TFP, Intermediate imports. Table 5 shows the results for the 2SLS-IV estimation with fixed effects, applied to the whole sample of countries (replicating standard regression of Table 2). Column 1 shows results from instrumenting only policy variables Welfare, ALMP, PLMP, EPL, and Trade union. The instruments used in the 2SLS estimation are the first difference of Welfare, and lagged values of all
other policy and LMI. Sargan-Hansen test never rejects the validity of these instruments. Moreover, the null hypothesis that the set of instrumented variables are exogenous is rejected in all regressions (the p-value is below 10%). When all explanatory variables are instrumented, we get significant estimates for all the policy variables (but ALMP) with the same direction discussed above. The complete Table 5 is in Appendix B.
Table 5
2SLS-IV ESTIMATED COEFFICIENTS FOR STANDARD REGRESSION
(1) (2) (3) (4) (5) (6)
1998-2014 before after 1998-2014 before after Welfare 0.040*** -0.003 0.044** 0.032*** -0.024 0.029** (0.0114) (0.0459) (0.0195) (0.0091) (0.0192) (0.0129) ALMP 0.039 0.019 -0.012 0.022 -0.070 0.004 (0.0431) (0.1410) (0.1579) (0.0396) (0.0789) (0.1345) PLMP -0.077*** 0.011 -0.138*** -0.066*** 0.024 -0.113*** (0.0149) (0.0357) (0.0492) (0.0129) (0.0266) (0.0364) EPL 0.033* 0.177 0.065 0.032* 0.050 0.029 (0.0198) (0.1109) (0.0412) (0.0172) (0.0770) (0.0334) Trade union -0.002* -0.010 -0.004 -0.004*** -0.013*** -0.004 (0.0012) (0.0087) (0.0035) (0.0015) (0.0049) (0.0031) Observations 375 175 200 375 175 200 Countries 25 25 25 25 25 25 R2 0.236 0.244 0.568 0.076 . . Sargan p-value [0.489] [0.567] [0.779] [0.659] [0.150] [0.974]
Instrumented LMI LMI LMI all all all
Notes: Standard errors in parentheses, p-values in brackets. * p≤0.1, ** p≤0.05, *** p≤0.01. Elasticities of 2SLS-IV estimator with small
sample correction. Excluded instruments are ΔWelfare, twice lagged ALMP, lagged PLMP, lagged TFP, lagged trade union, lagged EPL; included instruments are K/Y, TFP, Intermediate imports in (1)-(3). Regression in col.4 instruments all variables. Excluded instruments
are lagged ΔWelfare, twice lagged ALMP, lagged PMLP, lagged K/Y, lagged ΔK/Y, lagged trade union, lagged ΔIntermediate imports, ΔTrade openness; included instrument EPL. In (5) and (6) centered R2 are negative and not reported.
5.5 The Burst of the Crisis
The latest financial and economic crisis hit Southern European countries and the UK and Ireland very harshly. Ineffective labor market policies, flexibility, high private indebtedness and low private savings, together with high public debts, increased income inequality and lower labor productivity for at least a couple of subsequent years. On exception is Germany, where labor market reforms of 2003-2004 allowed bringing the unemployment rate down to 6% even during the crisis years, but jobs are not stable and very low paid, pushing the German labor share down (and inequality up). In 2008 and 2009, labor productivity decreased in European countries, while it was about constant in Anglo-Saxon countries. Starting in 2009, until 2014, labor productivity grew at the same rate in both groups (see Appendix A). However, after the burst of the financial crisis, labor income share experienced a sudden upsurge and a following volatile dynamics, which differed across countries. To take this structural break in the regression analysis, the explanatory variables are interacted with a time dummy FC equal 1 for time-year ≥ 2007. Table 2 shows such results in columns 4, 5, 7 and 8 and reports a Wald test of parameter equality in column 6. This latter test indicate whether there is a significant increase or decrease of the impact of our variables of interest on the Labor share, after the burst of the crisis. Welfare impact does not change its significance over time, actually increasing its LS elasticity. This result is robust to all specifications (Appendix B). ALMP turns out strongly positive in the after-crisis period, from negative or nil before. This result is compatible with the positive impact of active programs on employment services, training or direct job creation, especially needed after a recession. They do not show a crowding-out effect on employment, maybe exerting a general upward wage pressure effect or at least offsetting a downward trend. Scandinavian countries, in particular (Table 3), sustain labor income through the implementation of Active Programs (education, incentives to unemployed to immediate job search) whose target appears to be more successful than the Anglo-Saxon target (based on employment services and training). PLMP turns out depressing LS during the recession. EPL is positive before and even after the crisis, when the negative consequences on declining employment and wages were limited by the existing regulations on
labor protection. However, its equality test confirms a significant negative difference, therefore EPL strength at sustaining income lost power after 2007. Trade union negative impact is robust over time, however in the post-crisis period it turns even more depressing the labor share in all countries. In Table 4, Welfare expenditures are strongly correlated to the LS both before and after the crisis period. Moreover, this policy impact is even stronger after 2007. Active LM programs appear to be significant and negative for MW countries in the pre-crisis period, and change to non-significant afterwards. On the other hand, Passive LM programs are negatively correlated to the LS in NMW over time. In MW, it is even significantly positive before the start of the crisis. EPL is positively correlated to LS in MW countries only. Trade union elasticity is strongly negative in MW and negative but not significant in NMW. These results confirm that minimum wage policy interacts with the other re-distributional policies, especially after an economic recession, when active and passive labor market programs change their intended impact on the LS.
6. Summary and Conclusions
The focus of this paper is to evaluate the impact of social policies and labor market institutions on the level of the labor income share for groups of countries, which differ for their labor market and educational structures, and welfare regimes. It first discusses the control variables that potentially influence the declining trend of the labor share in most advanced economies, i.e. trade openness, technological progress, market competition, physical and human capital endowment in terms of skilled labor, and (female) labor supply. Differently to other empirical research, the impact of policy and institutions appear to be relevant at sustaining (or depressing) the labor income share, and vary quite substantially across countries and over time. The ‘European model’ (in Continental Europe) as well as the ‘Mediterranean model’ (Southern Europe) are the most successful at sustaining the labor share through expenditures on welfare (public health, pensions and other forms of social assistance, etc.). Scandinavian countries keep their labor income share level mainly through the implementation of active labor market programs (education programs, incentives to unemployed to immediate job search, start-up incentives) whose aim appears to be more successful than the Anglo-Saxon target (based on employment services and training). Moreover, Scandinavian passive measures such as unemployment benefits are conditional to participating to active programs.
On the other hand, passive labor market measures seem to be robustly negative and detrimental to Continental Europe, because they are usually not accompanied by active policies, causing long-run unemployment or discouraging job search. Generous unemployment benefits, indeed, counteract wage flexibility in European labor markets. New EU members have the lowest estimated elasticity to passive programs due to their more recent experience of high unemployment at the end of the 1990s. Active and passive measures are sensitive to the structural break in 2007, when their correlation to LS becomes even stronger. The impact of welfare expenditures, instead, does not change over time (it remains strong and positive).
Like other empirical research findings, employment protection legislation has a positive effect on employment more than compensating the negative direct and indirect labor adjustment costs, especially in Southern Europe, where hiring and firing costs are usually high. This result is compatible with the argument that higher employment protection brings about higher productivity growth and higher labor share of income (VK, 2014). Nonetheless, EPL impact becomes weaker after 2007. As in YZ (2011), union density elasticity is negatively correlated to the labor share, in every group of countries. This might be due to the prevailing effect of bargaining pressure on depressing labor demand, when firms tend to substitute costly labor with capital. LS elasticity to trade union, however, is highest in Scandinavian countries and lowest in New EU members. In the post-crisis period, it turns even more depressing the labor share, especially in Scandinavian countries, but not in New EU Members. Governments may sustain household income alternatively preferring pre-tax and pre-transfer income distribution policies, such as the minimum wage, to alleviate the problem of inequality and unemployment. Indeed, minimum wage is found to reinforce welfare policies at least for some individual categories, improving distributional effects. Nonetheless, minimum wage countries are on average less inclined to spend on welfare than NMW countries, rather preferring active or passive labor market measures. Passive measures elasticity is even positive and slightly significant for minimum wage countries before 2007. Employment protection appears to be strongly positively correlated to the labor share in minimum wage countries, and has no significant impact in non-minimum wage countries, which appear to rely on welfare expenditures the most to sustain households or individuals’ income.
Overall, after 2007, policies sustaining labor income move as expected in theoretical arguments, to counteract the negative impact of employment and income loss. Welfare expenditures have the most important role in this respect.
Employment Protection is an important driver for the labor share. Finally, minimum wage interacts with the other re-distributional policies, especially after the economic recession, when active and passive labor market programs change their intended impact on the LS on average in the group.
Acknowledgements
A previous draft of the paper was presented at “XI Jornadas de Economìa Laboral” held in Universitat Autònoma de Barcelona, Spain, on 1-3 July 2015, at the 56th annual meeting of the Italian Economic Society, Parthenope University of Naples, Italy, on 22-24 October 2015, and at a seminar series of Catholic University in Piacenza, Italy, in March 2016. I am grateful to Héctor Sala, Carlos Usabiaga, Germana Giombini, Maurizio Baussola, Francesco Daveri, Chiara Mussida, conference participants, and two anonymous referees for their useful comments. Angelo Penta provided excellent research assistance. Nonetheless, I remain the only responsible for what expressed in this paper. This research did not receive any specific grant from funding agencies in the public, commercial, or not-for-profits sectors.
Conflict of interest: none.
References
Arpaia, A., Pérez, E., and K. Pichelmann, 2009. Understanding Labour Income Share Dynamics in Europe. European Economy. Economic Papers, 379. DOI: 10.2765/37596
Azmat, G., Manning, A. and J. Van Reenen, 2012. Privatization and the Decline of Labor's Share: International Evidence from Network Industries. Economica 79, 470-492. doi:10.1111/j.1468-0335.2011.00906.x Bassanini, A. and T. Manfredi, 2012. Capital’s Grabbing Hand? A Cross-Country/Cross-Industry Analysis of the
Decline of the Labour Share. Eurasian Bus. Rev. 4(1), 3-30.
Bentolila, S. and G. Saint-Paul, 1998. Explaining Movements in the Labour Share. London, Centre for Economic Policy Research. http://www.cepr.org/active/publications/discussion_papers/dp.php?dpno=1958
Bentolila, S. and G. Saint-Paul, 2003. Explaining Movements in the Labor Share. The B.E. J. of Macroecon. Contrib. to Macroecon. 3.
Besley, T. and R. Burgess, 2004. Can Labor Regulation Hinder Economic Performance? Evidence from India. The Q. J. of Econ. 119, 91-134.
Bettio, F. and S. Rosenberg, 1999. Labour Markets and Flexibility in the 1990s: the Europe-USA opposition revisited. Int. Rev. of Appl. Econ. 13, 269-279.
Blanchard, O. and F. Giavazzi, 2003. Macroeconomic effects of regulation and deregulation in goods and labor market. The Q. J. of Econ. 118, 879-907.
Boggio, L., Dall’Aglio, V. and M. Magnani, 2010. On Labour Shares in Recent Decades: A Survey. Rivista Internazionale di Scienze Sociali 118, 283-333.
Boll, C., Malte, J. and A. Lagemann, 2017. The gender lifetime earnings gap – exploring gendered pay from the life course perspective. Hamburg Institute of International Economics, Research Paper n.179, ISSN: 1861-504X, 2017.
Calmfors, L., Forslund, A. and M. Hemström. 2004. The effects of active labor market policies in Sweden: What is the evidence? In Labor market institutions and public regulation, ed. J. Agell, M. Keen, and A. Weichenrieder, 1– 63. Cambridge, MA: MIT Press
Castater, E. G., 2015. Unionization and the partisan effect on income inequality. Bus. Politics 17, 1-40.
(The) Conference Board, 2015. The Conference Board Total Economy Database™, September 2015, http://www.conference-board.org/data/economydatabase/
Ebbinghaus, B., 2012. Comparing Welfare State Regimes: Are Typologies an Ideal or Realistic Strategy? Draft Paper presented at European Social Policy Analysis Network, ESPAnet Conference, Edinburgh, UK, September 6‐8.
Elsby, M. W. L., Hobijn, B. and A. Şahin, 2013. The Decline of the U.S. Labor Share. Brook. Pap. on Econ. Act. 1-52.
European Commission, 2003. Adopted Employment Guidelines. http://europa.eu.int/eur-lex/pri/en/oj/dat/2003/l_197/l_19720030805en00130021.pdf
European Commission, 2007. The Labour Income Share in the European Union. Employment in Europe 2007, Directorate-General for Employment Social Affairs and Equal Opportunities, Brussels
Eurostat, 2006. Labour market policy database. Methodology. Luxembourg: Office for Official Publications of the European Communities, ISBN: 92-79-02273-3.
Fichtenbaum, R., 2011. Do Unions Affect Labor's Share of Income: Evidence Using Panel Data. The Am. J. of Econ. & Soc. 70, 784-810.
Gollin, D., 2002. Getting Income Shares Right. J. of Political Econ. 110(2): 458-474. DOI: 10.1086/338747 Grossman, G.M. and E. Rossi-Hansberg, 2006. The Rise of Offshoring: It’s Not Wine for Cloth Anymore. Federal
Reserve Bank of Kansas City, Proceedings of the symposium, “The New Economic Geography: Effects and Policy Implications,” Jackson Hole
Grubb, D. and A. Puymoyen, 2008. Long time series for public expenditure on labour market programmes. OECD Social, Employment and Migration Working Papers, No. 73.
Guerriero, M. and K. Sen, 2012. What determines the share of Labour in National Income? A Cross-Country Analysis. IZA discussion paper n. 6643.
Guscina, A., 2006. Effects of Globalization on Labor’s Share in National Income. IMF Working Paper n. 06/294. Hadavand, A. and S. Thomas, 2017. Gender Differences and Inequality in the U.S. Labor Market.
SSRN: https://ssrn.com/abstract=2945435 (Accesses: 03.04.17).
Harrison, A.E., 2005. Has Globalization eroded the labour’s share? Some Cross-Country evidence. MPRA working paper n. 39649.
IMF, 2007. The Globalization of Labor. In World Economic Outlook: Spillovers and Cycles in the Global Economy, Chapter 5. Washington.
Jaumotte, F. and I. Tytell, 2007. How has the Globalization of Labor affected the Labour Share in Advanced Countries? IMF Working Paper series n. 07/298.
Karabarbounis, L. and B. Neiman, 2014. The Global Decline of the Labor Share. The Q. J. of Econ. 129, 61-103. Neumark, D. and W. Wascher, 2011. Does a Higher Minimum Wage Enhance the Effectiveness of the Earned
Income Tax Credit? ILR Rev. 64, 712-746.
Nickell, S., 1999. Product markets and labour markets. Labour Econ. 6, 1-20.
OECD, 1998. Making the Most from the Minimum: Statutory Minimum Wages, Employment and Poverty. Employment Outlook, Chapter 2.
OECD, 2004. Employment Protection Regulation and Labor Market Performance. Employment Outlook. ISBN 92-64-10812-2.
OECD, 2014. Labor Market Policies and Institutions. Employment Database.
http://www.oecd.org/employment/emp/ALMPdata-Scope-and-Comparability.pdf
Parisi, M.L. and A. Penta, 2015. Labor Market Rigidity, Social Policies and the Labor Share. University of Brescia, Department of Economics Working Paper WPDEM 7/15.
Prados de la Escosura, L. and J.R. Rosés, 2003. Wages and Labor income in history: A Survey. Univ. de Madrid, Economic History and Institutions series n. 6.
Rodrick, D., 1997. Has Globalization Gone Too Far? Institute for International Economics, ISBN: 0-88132-241-5.
Schneider, D., 2011. The Labor Share: A review of theory and evidence. Humboldt-Universität zu Berlin SFB 649 Discussion Paper 069.
Traxler, F. and B. Kittel, 2000. The Bargaining System and Performance. A comparison of 18 OECD Countries. Comp. Political Stud. 33, 1154-1190.
UK Office for National Statistics, 2011. Employment and Labour Market.
https://www.ons.gov.uk/employmentandlabourmarket
Vergeer, R. and A. Kleinknecht, 2010. The Impact of Labor Market Deregulation on Productivity: a Panel Data Analysis of 19 OECD Countries (1960-2004). J. of Post Keyn. Econ. 33, 371-408.
Vergeer, R. and A. Kleinknecht, 2014. Do Labour Market Reforms Reduce Labour Productivity Growth? A Panel Data Analysis of 20 OECD Countries (1960-2004). Int. Lab. Rev. 153, 365-393.