This content has been downloaded from IOPscience. Please scroll down to see the full text.
Download details:
IP Address: 192.167.23.210
This content was downloaded on 18/10/2016 at 14:39
Please note that terms and conditions apply.
You may also be interested in:
Determination of jet energy calibration and transverse momentum resolution in CMS The CMS collaboration
Performance of -lepton reconstruction and identification in CMS CMS Collaboration
Identification of b-quark jets with the CMS experiment The CMS collaboration
Performance of the CMS Level-1 trigger during commissioning with cosmic ray muons and LHC beams CMS Collaboration
Performance of CMS hadron calorimeter timing and synchronization using test beam, cosmic ray, and LHC beam data
CMS Collaboration
Description and performance of track and primary-vertex reconstruction with the CMS tracker
Missing transverse energy performance of the CMS detector
View the table of contents for this issue, or go to the journal homepage for more 2011 JINST 6 P09001
(http://iopscience.iop.org/1748-0221/6/09/P09001)
2011 JINST 6 P09001
PUBLISHED BYIOP PUBLISHING FORSISSA
RECEIVED: June 25, 2011
ACCEPTED: July 22, 2011
PUBLISHED: September 9, 2011
LHC REFERENCE VOLUME
Missing transverse energy performance of the
CMS detector
The CMS collaboration
ABSTRACT: During 2010 the LHC delivered pp collisions with a centre-of-mass energy of 7 TeV.
In this paper, the results of comprehensive studies of missing transverse energy as measured by the CMS detector are presented. The results cover the measurements of the scale and resolu-tion for missing transverse energy, and the effects of multiple pp interacresolu-tions within the same bunch crossings on the scale and resolution. Anomalous measurements of missing transverse en-ergy are studied, and algorithms for their identification are described. The performance of sev-eral reconstruction algorithms for calculating missing transverse energy are compared. An algo-rithm, called missing-transverse-energy significance, which estimates the compatibility of the re-constructed missing transverse energy with zero, is described, and its performance is demonstrated.
KEYWORDS: Performance of High Energy Physics detectors; Missing Transverse Energy studies;
Calorimeter methods; Detector modelling and simulations (interaction of radiation with matter, interaction of photons with matter, interaction of hadrons with matter, etc)
2011 JINST 6 P09001
Contents
1 Introduction 2
2 The CMS detector 2
3 Data sample selection and particle reconstruction 3
4 Reconstruction of /ET 5
5 Large /ET due to misreconstruction 6
5.1 Contributions to /ETfrom anomalous signals in the calorimeters 6
5.2 Removal of beam-induced contributions to /ET 8
5.3 Contributions of noninstrumented or nonfunctioning detector regions 10
6 Missing transverse energy scale and resolution 12
6.1 Direct photon sample 13
6.2 Z samples 14
6.3 Scale and resolution for events with one primary vertex 15
6.4 Resolution in multijet events 18
6.5 Effect of multiple interactions 19
6.5.1 Studies of pile-up effects using photon and Z events 20
6.5.2 Studies of pile-up effects in jet data 21
7 Studies of physics processes containing genuine /ET 22
7.1 W events 23
7.2 Heavy flavour production and /ET 24
8 E/Tsignificance 25
8.1 Definition 26
8.2 Performance of SPFin dijet events 28
8.3 Application to W → eν events 29
9 Conclusions 31
A Appendix: optimization of /ETcorrections 34
2011 JINST 6 P09001
1 Introduction
Neutral weakly interacting particles, such as neutrinos, escape from typical collider detectors with-out producing any direct response in the detector elements. The presence of such particles must be inferred from the imbalance of total momentum. The vector momentum imbalance in the plane perpendicular to the beam direction is particularly useful in pp and p¯p colliders, and is known as
missing transverse momentum, here denoted ~/ET. Its magnitude is called missing transverse energy,
and is denoted /ET.
Missing transverse energy is one of the most important observables for discriminating leptonic decays of W bosons and top quarks from background events which do not contain neutrinos, such as multijet and Drell-Yan events. It is also an important variable in searches for new weakly interact-ing, long-lived particles. Many beyond-the-standard-model scenarios, including supersymmetry,
predict events with large /ET. The reconstruction of ~/ET is very sensitive to particle momentum
mismeasurements, particle misidentification, detector malfunctions, particles impinging on poorly instrumented regions of the detector, cosmic-ray particles, and beam-halo particles, which may result in artificial /ET.
In this paper, we present studies of ~/ETas measured using the Compact Muon Solenoid (CMS)
detector at the Large Hadron Collider (LHC), based on a data sample corresponding to an
inte-grated luminosity of 36pb−1. In section2, the CMS detector is briefly described. In section 3,
particle reconstruction algorithms and identification requirements, together with the basic sample selection requirements, are given. In section4, the different algorithms for evaluating ~/ETare
pre-sented. In section5, methods for identifying anomalous ~/ET measurements from known detector
artifacts are described. In section6, the scale and resolution are measured using events containing
photons or Z bosons. The degradation of the resolution due to the presence of additional soft pp
collisions in the same crossing as the hard scatter (“pile-up”) is presented. In section7we present
distributions from physics processes containing genuine /ET. In section8, an algorithm, called “/ET
significance”, which assesses the likelihood that the observed ~/ET is due to resolution effects, is
described, its performance in jet events is demonstrated, and its efficacy for separating events con-taining a W boson decaying to either an electron and a neutrino or a muon and a neutrino from
multijet backgrounds is shown. Conclusions are given in section9. Finally, in the appendix, the
optimization of the parameters used in the correction for the detector response is described.
2 The CMS detector
The central feature of the CMS apparatus is a superconducting solenoid, of 6 m internal diameter, providing a field of 3.8 T. Within the field volume are the silicon pixel and strip tracker, the crystal electromagnetic calorimeter (ECAL), and the brass/scintillator hadron calorimeter (HCAL). Muons are measured in gas-ionization detectors embedded in the steel return yoke. In addition to the barrel and endcap detectors, CMS has extensive forward calorimetry.
CMS uses a right-handed coordinate system, with the origin at the nominal interaction point, the x-axis pointing to the centre of the LHC, the y-axis pointing up (perpendicular to the LHC plane), and the z-axis along the anticlockwise-beam direction. The polar angle, θ, is measured from the positive z-axis and the azimuthal angle, φ, is measured in the x-y plane relative to the
2011 JINST 6 P09001
x-axis. Transverse quantities, such as “transverse momentum” (~pT), refer to the components in the
x-y plane. The magnitude of ~pTis pT. Transverse energy, ET, is defined as E sinθ.
The electromagnetic calorimeter (ECAL) consists of nearly 76 000 lead tungstate crystals, which provide coverage in pseudorapidity |η| < 1.479 in a barrel region (EB) and 1.479 < |η| < 3.0 in two endcap regions (EE). A preshower detector consisting of two planes of silicon sensors
interleaved with a total of 3X0 of lead is located in front of the EE. The ECAL has an energy
resolution of better than 0.5% for unconverted photons with ET>100GeV.
The HCAL is comprised of four subdetectors, a barrel detector (HB) covering |η| < 1.3, two endcap detectors (HE) covering 1.3 < |η| < 3.0, two forward detectors (HF) covering 2.8 < |η| < 5.0, and a detector outside of the solenoid (HO) covering |η| < 1.3. The HCAL, when combined with the ECAL, measures hadrons with a resolution ∆E/E ≈ 100%pE [GeV] ⊕ 5%. In the region
|η| <1.74, the HCAL cells have widths of 0.087 in pseudorapidity and 0.087 rad in azimuth. In
the (η,φ) plane, and for |η| < 1.48, the HCAL cells map onto 5 × 5 ECAL crystal arrays to form calorimeter towers projecting radially outwards from close to the nominal interaction point. At larger values of |η|, the size of the towers increases and the matching ECAL arrays contain fewer crystals.
The muons are measured in the pseudorapidity window |η| < 2.4, with detection planes made of three technologies: Drift Tubes, Cathode Strip Chambers, and Resistive Plate Chambers. A
global fit of the measurements from the muon system and the central tracker results in a pT
resolu-tion between 1 and 5%, for pTvalues up to 1 TeV.
The inner tracker measures charged particles within the |η| < 2.5 pseudorapidity range. It consists of 1440 silicon pixel and 15 148 silicon strip detector modules and is located in the 3.8 T field of the superconducting solenoid. It provides an impact parameter resolution of ∼ 15 µm and
a pTresolution of about 1.5% for 100GeV particles.
The first level (L1) of the CMS trigger system, composed of custom hardware processors, uses information from the calorimeters and muon detectors to select, in less than 1 µs, the most interesting events. The High Level Trigger (HLT) processor farm further decreases the event rate from around 100 kHz to ∼ 300 Hz, before data storage.
The calibrations used in this analysis were those available at the beginning of the fall of 2010, which are not the final calibrations for this data sample. Improvements and updates to the calibra-tions can lead to small improvements in resolution.
A much more detailed description of CMS can be found elsewhere [1].
3 Data sample selection and particle reconstruction
The data sets used for the studies presented in this paper were collected from March through
November, 2010, and consist of pp collisions at a centre-of-mass energy √s=7 TeV. An
inte-grated luminosity of 36 pb−1was available with all subdetectors certified as fully functional. The
detailed selection criteria for the individual data samples used for each study are given throughout the text. However, all require at least one well-identified primary vertex (PV) whose z position is less than 24 cm away from the nominal centre of the detector and whose transverse distance from the z-axis is less than 2 cm, ensuring that particles coming from collisions are well contained in the CMS detector.
2011 JINST 6 P09001
The samples used for the studies in this paper are defined through selection requirementson reconstructed jets, electrons, photons, muons, and b jets. We describe the basic identification requirements used for these particles here.
Jet reconstruction and its performance in CMS are discussed in detail elsewhere [2]. For the
analyses described in this paper, jets are reconstructed using an anti-kT algorithm [3] with a jet
radius parameter R of 0.5. The energy of a jet is corrected, on average, to that which would have been obtained if all particles inside the jet cone at the vertex were measured perfectly (particle-level). Calorimeter jets (Calo Jets) are clusters of calorimeter tower energies. Jet-plus-track jets (JPT Jets) achieve improved response by supplementing the calorimeter information with tracking information. Tracks are associated with Calo Jets if they are within the jet cone at the PV. The measured momentum of these tracks is added to the jet. To avoid double-counting energies, the expected response in the calorimeter is subtracted from the Calo Jet if the particle is still within the cone when it impacts the calorimeter.
Photon candidates are selected from clusters of energy in the ECAL. They are required to be isolated. The ECAL energy in an annular region in the η-φ plane with inner radius 0.06 and outer radius 0.4, excluding a three-crystal-wide strip along φ from the candidate, is required to be less than 4.2 + 0.006 pγ
TGeV, where pγT is the transverse momentum in GeV of the photon candidate.
The sum of the pTs of the tracks in the same region must be less than 2.2+0.0025 pγTGeV. The ratio of the HCAL energy in an annular region with inner radius 0.15 and outer radius 0.4 to the ECAL cluster energy is required to be less than 0.05. The shape of the cluster of calorimeter energies must be consistent with that of an electromagnetic shower. The agreement is quantified by the variable ση η, which uses the following definitions:
ση η2 =∑ (ηi−¯η) 2w i ∑ wi , ¯η =∑ ηiwi ∑ wi , wi=max(0,4.7 + log(Ei/E5×5)) (3.1)
and where the sums run over the 5 × 5 crystal matrix around the most energetic crystal. Eiand ηi
are the energy and pseudorapidity of the ithcrystal within the 5 × 5 electromagnetic cluster. E5×5
and ¯η are the energy and η of the entire 5 × 5 cluster. Photon candidates with 0.002 < ση η <
0.013 are selected. In addition, to provide strong rejection against misidentification of electrons as photons, the cluster must not match any track reconstructed in the pixel detector that is consistent with coming from the primary vertex. Photon reconstruction and identification are described in detail in [4].
Electrons are identified using similar criteria. In addition to similar shower shape and isolation requirements, the candidate must match well in both φ and η to a charged track, but be isolated from additional tracks. Electron candidates are also required to be in the fiducial portion of the calorimeter (|η| < 1.4442 or 1.5660 < |η| < 2.5). More details are given in [5]. In addition, photon-conversion rejection is used in some of the analyses presented in this paper.
Muon candidates consist of a track in the tracker which can be linked to one reconstructed in the muon system. The candidate must be isolated from deposits of energy in the ECAL and HCAL
that are not consistent with having been deposited by the muon. The sum of the pTs of other tracks
within an isolation cone centred on the candidate must also be small.
Several algorithms for the identification of b jets have been developed [6, 7]. Two of them
2011 JINST 6 P09001
algorithm exploits the significance of the three-dimensional flight distance between the PV and areconstructed secondary vertex. The SoftMuonByPt (SMbyPt) tagger uses the transverse momen-tum of the muon with respect to the jet axis to construct a discriminant.
CMS also has a global particle-flow reconstruction. Details on the CMS particle-flow
algo-rithm and performance can be found in [8]. The particle-flow technique reconstructs a complete,
unique list of particles (PF particles) in each event using an optimized combination of information from all CMS subdetector systems. Reconstructed and identified particles include muons, electrons (with associated bremsstrahlung photons), photons (including conversions in the tracker volume), and charged and neutral hadrons. These particles are not necessarily the same as those found in the other reconstruction, and all detector information is used in the construction of the PF particles. For the analyses described in this paper, PF particles are used to construct a third type of jets (PF Jets). They are also used in one type of ~/ETreconstruction, as discussed in section4.
The collision data are compared to samples of simulated events that were generated either
usingPYTHIA6 [9], with a parameter setting referred to as tune Z2, or with MADGRAPHinterfaced
with PYTHIA[10]. The generated events are passed through the CMS detector simulation based
onGEANT4 [11]. The detector geometry description includes realistic subsystem conditions such
as simulation of nonfunctioning channels. The samples used in section6.5include pile-up. The
offline event selection for collision data is also applied to simulated events.
4 Reconstruction of /ET
In general, ~/ETis the negative of the vector sum of the transverse momenta of all final-state parti-cles reconstructed in the detector. CMS has developed three distinct algorithms to reconstruct ~/ET: (a) PF /ET, which is calculated using a complete particle-flow technique [8]; (b) Calo /ET, which is
based on calorimeter energies and the calorimeter tower geometry [12]; and (c) TC /ET, which
cor-rects Calo /ET by including tracks reconstructed in the inner tracker after correcting for the tracks’ expected energy depositions in the calorimeter [13].
As discussed in section3, the CMS particle flow reconstruction uses all detector information
to create a complete list of identified and reconstructed PF particles. Since all detector information is included, it is simple to use the PF particles to calculate a ~/ET: PF /ETis the negative of the vector
sum over all PF particles of their transverse momentum. PF ∑ET is the associated scalar sum of
the transverse energies of the PF particles.
Calo /ET is calculated using the energies contained in calorimeter towers and their directions,
relative to the centre of the detector, to define pseudo-particles. The sum excludes energy deposits below noise thresholds. Since a muon deposits only a few GeV on average in the calorimeter,
independent of its momentum, the muon pTis included in the Calo /ET calculation while the small
calorimetric energy deposit associated with the muon track is excluded. Calo ∑ETis the associated
scalar sum of the transverse energies of the calorimeter towers and muons.
TC /ET is based on Calo /ET, but also includes the pTs of tracks that have been reconstructed in the inner tracker, while removing the expected calorimetric energy deposit of each track. The predicted energy deposition for charged pions is used for all tracks not identified as electrons or muons. The calorimetric energy deposit is estimated from simulations of single pions, in intervals
2011 JINST 6 P09001
its expected position. No correction is applied for very high pT tracks (pT >100GeV), whose
energy is already well measured by the calorimeters. For low-pTtracks (pT<2GeV), the measured
momentum is taken into account assuming no response from the calorimeter.
The magnitude of the ~/ET can be underestimated for a variety of reasons, including the
non-linearity of the response of the calorimeter for neutral and charged hadrons due to its noncompen-sating nature, neutrinos from semileptonic decays of particles, minimum energy thresholds in the calorimeters, pT thresholds and inefficiencies in the tracker, and, for Calo /ET, charged particles that are bent by the strong magnetic field of the CMS solenoid and whose calorimetric energies are therefore in a calorimeter cell whose associated angle is very different from the angle of the
track at the vertex. The displacement of charged particles with small pTdue to the magnetic field
and the calorimeter nonlinearity are the largest of these biases, and thus Calo /ET is affected most.
A two-step correction has been devised in order to remove the bias in the ~/ET scale. The
correc-tion procedure relies on the fact that ~/ET can be factorized into contributions from jets, isolated
high pT photons, isolated high pT electrons, muons, and unclustered energies. The contribution
due to unclustered energies is the difference between the ~/ET and the negative of the vector sum
of the pTs of the other objects. Isolated photons, electrons, and muons are assumed to require no
scale corrections.
Jets can be corrected to the particle level using the jet energy correction [2]. The “type-I
corrections” for ~/ET use these jet energy scale corrections for all jets that have less than 90% of
their energy in the ECAL and corrected pT>20GeV for Calo /ET, and for a user-defined selection of jets with pT>10GeV for PF /ET. These corrections can be up to a factor of two for Calo /ET but are less than 1.4 for PF /ET [14]. In order to correct the remaining soft jets below this threshold, and energy deposits not clustered in any jet, a second correction can be applied to the unclustered energy, which is referred to as the “type-II correction”. This correction is obtained from Z → ee events, as discussed in the appendix.
In this paper, distributions involving Calo /ETinclude both type-I and type-II corrections, those
involving PF /ET include type-I corrections, and those involving TC /ET are uncorrected, as these
were the corrections that were available at the time the analyses presented in this paper were per-formed and are the versions used most typically in 2010 physics analyses. As discussed in the
appendix, type-II corrections have been developed for PF /ET and can be used in future analyses.
The optimization of both corrections is also discussed in the appendix.
5 Large /ET due to misreconstruction
This section describes various instrumental causes of anomalous ~/ET measurements, and the
meth-ods used to identify, and sometimes to correct, ~/ET for these effects. We also examine the
contri-butions to the tails of the /ETdistribution from nonfunctioning channels, uninstrumented regions of
the detector, and particles from sources other than pp interactions.
5.1 Contributions to /ETfrom anomalous signals in the calorimeters
The CMS ECAL and HCAL occasionally record anomalous signals that correspond to particles hitting the transducers. Anomalous signals in HCAL can also be produced by rare random dis-charges of the readout detectors. Some of these effects had already been observed during past test
2011 JINST 6 P09001
beam and cosmic data taking [15]. Detailed studies of these effects have continued with the 7 TeV
data taking, and are documented in detail in [16] for the HCAL and in [17] for the ECAL. For
some types of anomalous energies, the number of affected channels is small and the event can still be used in physics analysis after the removal of the anomaly. We refer to the removal process as “cleaning” the event. If a large number of channels are affected, “filters” instead tag the event as not suitable for use in physics analysis.
Anomalous energy deposits in EB are associated with particles striking the sensors and very occasionally interacting to produce secondaries that cause large anomalous signals through direct ionization of the silicon. Three main types of noise have been identified in HF: scintillation light produced in the light guides that carry the light from the quartz fibres to the photomultipliers, Cherenkov light in the photomultiplier tube (PMT) windows, and punch-through particles hitting the PMTs. While the EB, HF scintillation, and HF Cherenkov sources typically affect only a single channel, signals generated in the HF by particles that exit the back of the calorimeter can affect clusters of channels per event. In the HB and HE, electronics noise from the Hybrid Photo Diode (HPD) and Readout BoX (RBX) occurs, and can affect from one up to all 72 channels in an RBX. This noise is not related to interactions with particles from pp interactions but instead occurs at a low rate and at random times, so the overlap with pp interactions is very low at the bunch spacings of the 2010 run.
The basic strategy for the identification and removal of anomalous signals (cleaning) is based on information such as unphysical charge sharing between neighbouring channels in η-φ and/or depth, and timing and pulse shape information. Each of the calorimeters in CMS measures and samples signals every 25ns and several samples are saved with the event record. The shapes of the pulses for signals that develop from energy deposits in the calorimeters are different than those from anomalous noise signals.
Once a “hit” in an HCAL tower or ECAL crystal is determined to be unphysical, we exclude it from the reconstruction of higher-level objects such as jets or~/ET. We thus arrive at a reconstruction
of jets and ~/ET that is consistently “cleaned” of anomalous detector effects. Studies using
simula-tions of a variety of different physics processes indicate that the amount of energy that is removed that comes from particles produced in a pp scattering is negligible.
Some features of anomalous signals can be used most effectively to identify events contam-inated by them after higher level objects such as jets have been reconstructed. Usually we reject events containing these types of anomalies using filters instead of trying to clean them, although
some cleaning is available for PF /ET. For example, we usually exclude events with HPD or RBX
noise affecting many channels by imposing the requirements described in [15]. We find that these
requirements exclude 0.003% of an otherwise good inclusive sample of pp interactions (minimum-bias events).
The Calo /ET distribution from a data sample that was collected with a trigger that requires a
coincidence in the beam pickup monitors and scintillators in front of the HF calorimeter
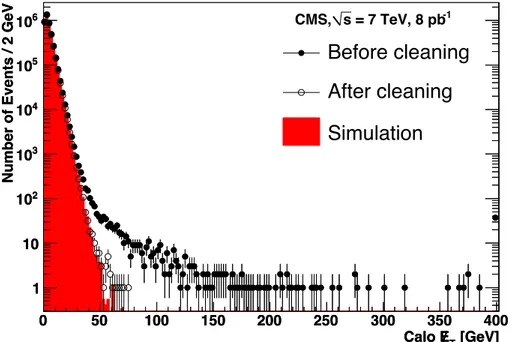
(minimum-bias data) are shown before and after removal of the anomalous signals in figure1, demonstrating
the effect of the cleaning and filters. The fraction of events in this sample that had energies recorded
in the HF cleaned was 1 × 10⁻². The fraction for the EB was 3 × 10⁻³. These are the dominant
sources of anomalous signals for the bunch spacings of the 2010 run. A comparison with simula-tion, which does not include anomalous energies, shows good agreement. The effect of the cleaning
2011 JINST 6 P09001
[GeV] T E Calo 0 50 100 150 200 250 300 350 400Number of Events / 2 GeV
1 10 2 10 3 10 4 10 5 10 6 10
Before cleaning
After cleaning
Simulation
[GeV] T E Calo 0 50 100 150 200 250 300 350 400Number of Events / 2 GeV
1 10 2 10 3 10 4 10 5 10 6 10 CMS, s = 7 TeV, 8 pb-1
Figure 1. Calo /ETdistributions in a minimum-bias data sample without (black dots) and with (open circles) cleaning and filters, compared to simulation. Overflows are included in the highest bin.
The minimum-bias triggers used to collect the data shown in figure1were prescaled for most
of the data-taking period. Triggers that require large amounts of energy in the detector, such as /ET triggers and single-jet triggers, are enriched in events with anomalous energies. Filters to remove cosmic rays, other non-collision-related sources of high /ET, and other types of anomalies have been
developed in the context of specific searches for new particle production [18]. An example of a
filter for beam-halo muons, which can produce high energy bremsstrahlung photons in the detector, is given in the next section.
Hardware modifications to mitigate one of the largest sources of anomalous energies during the 2010 run, scintillation light produced in part of the light guide reflective sleeves in the HF, were implemented during the winter 2010–2011 shutdown period. During this period, the material that was producing the scintillation light was replaced with Tyvek. These modifications reduce the rate of noise events in HF by an order of magnitude. The HF PMTs will be replaced with multi-anode PMTs with flat, thinner front glass during the winter 2013–2014 shutdown, reducing the noise from Cherenkov light and punch-through particles. To reduce the noise observed in HB and HE, the HPDs will be replaced by silicon photomultipliers that do not produce this type of noise.
5.2 Removal of beam-induced contributions to /ET
Machine-induced backgrounds, especially the production of muons when beam protons suffer
col-lisions upstream of the detector (“beam halo”), can cause anomalous, large /ET. The CMS
beam-halo event filter uses trigger and reconstruction-level information obtained from the Cathode Strip Chambers (CSCs), a subdetector with good reconstruction performance for both collision and
2011 JINST 6 P09001
Beam Intensity (# of Protons) 13
10
Tagged Event Fraction per Fill
-5 10 -4 10 -3 10 -2 10 CMS, s = 7 TeV [GeV] T E PF 0 100 200 300 400 500 Events/ 10 GeV 1 10 2 10 3 10 4 10 5 10 6 10 Muon-triggered (all) Muon-triggered (halo) -triggered (all) T E -triggered (halo) T E -1 =7 TeV, 34 pb s CMS,
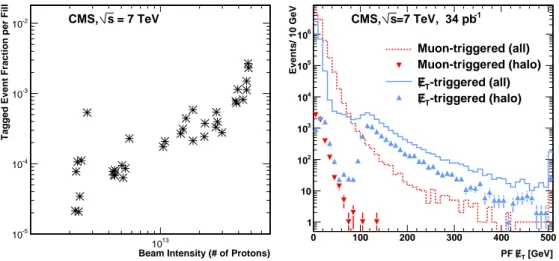
Figure 2. (left) Probability of finding a beam-halo tagged event in muon-triggered events. Results are shown as a function of the beam intensity. (right) PF /ET distribution for all the events from muon and
Calo /ETtriggers that were analyzed, and for the subset of these events that were identified as beam halo.
it difficult for beam-halo particles, with mostly parallel-to-beam trajectories, to traverse the barrel calorimetry without traversing one or both CSC endcaps.
The filter can operate in either a “loose” or “tight” mode. The former is designed for high tagging efficiency at the cost of a modest misidentification probability, while the latter tags only well-identified halo candidates and has a smaller misidentification probability. The tagging ef-ficiencies and misidentification probabilities have been assessed using simulation. For simulated
beam-halo particles which impact the calorimeters and produce Calo /ET >15GeV, the loose (tight)
filter is roughly 92% (65%) efficient. The per-event mistag probability determined from a simula-tion of inclusive pp interacsimula-tions (minimum-bias events) for the loose (tight) filter is ∼10−5(10−7). The tagging inefficiency is due in part to halo muons that do not traverse enough active layers of the CSCs for a well-measured track to be reconstructed and in part to muons that do not meet the coincidence requirements of the L1 beam-halo trigger. Many of the mistagged events are from
ex-tremely soft and forward muons (i.e. pT<2GeV and |η| > 1.7), from pion decay or from hadron
punch-through.
The CSC-based beam-halo filter was applied to events passing muon triggers which had pT
thresholds of 9, 11, or 15GeV, depending on the running period. Beam-halo muons, because their tracks do not point towards the nominal interaction point in the centre of the detector, in general do not fire the triggers for muons from pp interactions. The beam halo muons in this sample are
therefore overlaid on events triggered otherwise, providing an unbiased comparison of /ETin events
with and without a beam-halo muon in coincidence. Minimum-bias events could have been used as well, but, because the minimum-bias trigger was prescaled, the number of available events was small. The fraction of halo-tagged events for each running period is shown versus the average
beam intensity, with an uncertainty of approximately 10%, in figure2(left). The fraction of tagged
events increases with the beam intensity, as might be expected.
Figure2 (right) shows the PF /ET distribution for two trigger streams. The distribution from
sub-2011 JINST 6 P09001
set of these events satisfying the requirements of the tight halo filter is shown by the red invertedtriangles. As can be seen, the halo muons that overlapped with these events did not
disproportion-ately produce events with large PF /ET, indicating that the probability of a halo muon producing
large /ET in events taken from triggers that are uncorrelated with /ET is small. Also shown are
the PF /ET distributions for events taken on a trigger with a minimum trigger threshold of 100GeV
(solid curve). The structure seen in this plot at 100GeV is due to the trigger threshold. No cleaning
of anomalous energies is done for the /ET used in the trigger decision. The peak at low values of
the /ET is due to events that had large trigger /ET but were cleaned during the reconstruction used
for physics analysis. A substantial fraction of events collected on this trigger are identified as halo (blue triangles), since the trigger preferentially selects events in which the beam-halo muon has deposited large amounts of energy in the calorimeter. A beam-halo filter is therefore necessary for analyses that make use of samples based on this trigger.
5.3 Contributions of noninstrumented or nonfunctioning detector regions
Particles traversing poorly instrumented regions of the detector can be a cause of apparent ~/ET.
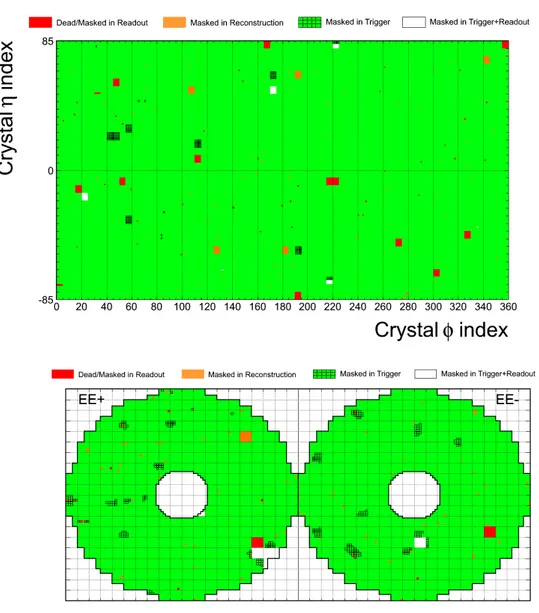
While generally hermetic, the CMS calorimeter does have uninstrumented areas (cracks) at the boundary between the barrel and endcap sections, and between the endcap and the forward calorimeters. The gap between the barrel and endcap sections is about 5 cm and contains various services, including cooling, power cables, and silicon detector readout. The crack is not projec-tive to the interaction point. In addition, about 1% of the ECAL crystals are either not operational
or have a high level of electronic noise [17], and they are “masked” (ignored) during
reconstruc-tion. The η-φ distribution of these crystals for the barrel and x-y distribution for the endcaps are shown in figure3.
In this section, we illustrate the effect of these features on the /ET distribution and test the reliability of the simulation for events with jets pointing towards masked ECAL channels or cracks.
Figure 4 shows the /ET distributions from simulated samples of events containing at least 2
jets, with the leading jet satisfying pT >50GeV and the second jet satisfying pT >25GeV, for Calo /ET, TC /ET, and PF /ET. For events with 100 < /ET<200GeV, the contribution from QCD
multijet production is 24–42%, depending on the ~/ET reconstruction algorithm; the rest is from
W/Z/t¯t production. In order to illustrate the effect of the cracks, distributions are also shown for
those subsets of these samples that have at least one jet that is aligned with the ~/ET to within
∆φ (~/ET,jet) < 0.2 and that is pointing towards masked ECAL channels, the barrel-endcap boundary (1.3 < |η| < 1.7), or the endcap-forward boundary (2.8 < |η| < 3.2). The masked ECAL channels considered here are those that are part of a group of 5×5 or 5×1 masked channels that are adjacent
in η-φ, as they have larger impact on the /ET distributions than isolated masked channels. A jet is
considered to be pointing to one of the masked ECAL channels when its jet centroid is within
∆R <0.2 of a masked ECAL channel, where ∆R = p(∆η)2+ (∆φ )2. We can see effects on the /ET
distribution from masked ECAL channels, while the calorimeter boundaries do not appear to have an enhanced contribution to the events with large /ET.
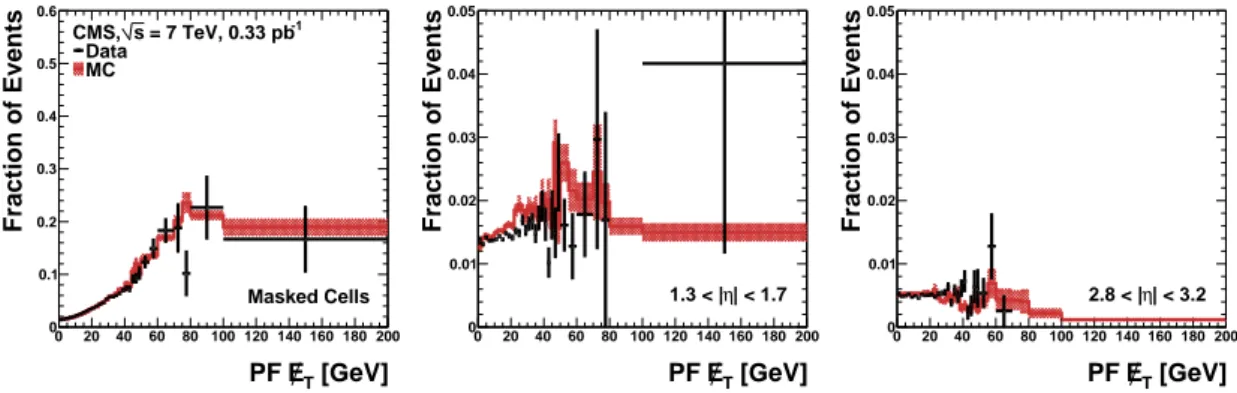
Figure 5 shows the fraction of dijet events with at least one jet aligned with the ~/ET and
also pointing towards the masked ECAL channels, the barrel-endcap boundary, or endcap-forward
boundary for data and for simulation. Figure5(left) shows that the masked ECAL channels
2011 JINST 6 P09001
Figure 3. Distribution of masked ECAL channels in (top) barrel: η-φ view of 170×360 individual crystals, and (bottom) endcaps: x-y view of 2 × 7400 individual crystals.
20% of the events with /ET>80GeV have contributions to the measured~/ETfrom mismeasurements
due to masked ECAL channels. Results from simulations indicate that the fraction of events with
large /ET due to mismeasurements (excluding the predicted contributions from sources of genuine
/
ET, such as W/Z/t¯t) is 30%. As shown in figures 5(middle) and5 (right), the fraction of events
which contain a jet that is both aligned with the ~/ET and pointing towards a calorimeter boundary
does not have a strong dependence on /ET, indicating that the calorimeter boundaries are not major
contributors to events that have large apparent /ET due to mismeasurements. Unlike the masked
ECAL channels, the cracks are not projective to the interaction point, and therefore energies of particles traversing these cracks are still measured, albeit with degraded resolution.
While the impact of the cracks is small, analyses sensitive to events with large /ET need to
2011 JINST 6 P09001
[GeV] T E Calo 0 20 40 60 80 100 120 140 160 180 200Fraction of Events / GeV10-7 -6 10 -5 10 -4 10 -3 10 -2 10 -1 10 1 CMS, s = 7 TeV, MC > 50(25) GeV jet1(2) T p
All Dijet Events ECAL Masked Cells
| < 1.7 η 1.3 < | | < 3.2 η 2.8 < | [GeV] T E TC 0 20 40 60 80 100 120 140 160 180 200
Fraction of Events / GeV10-7 -6 10 -5 10 -4 10 -3 10 -2 10 -1 10 1 [GeV] T E PF 0 20 40 60 80 100 120 140 160 180 200
Fraction of Events / GeV10-7 -6 10 -5 10 -4 10 -3 10 -2 10 -1 10 1
Figure 4. Distribution of (left) Calo /ET, (middle) TC /ET, and (right) PF /ET, normalized to unit area, for events containing at least 2 jets with pjet1(2)T >50 (25) GeV (black solid), and for the subsets of these events with a jet aligned with ~/ETwithin ∆φ(~/ET,jet) < 0.2 and pointing towards a masked ECAL cell (red
dotted), the barrel-endcap boundary (green dot-dashed), and the endcap-forward boundary (blue dashed) in simulation. [GeV] T E PF 0 20 40 60 80 100 120 140 160 180 200 Fraction of Events 0 0.1 0.2 0.3 0.4 0.5 0.6 -1 = 7 TeV, 0.33 pb s CMS, Data MC Masked Cells [GeV] T E PF 0 20 40 60 80 100 120 140 160 180 200 Fraction of Events 0 0.01 0.02 0.03 0.04 0.05 | < 1.7 η 1.3 < | [GeV] T E PF 0 20 40 60 80 100 120 140 160 180 200 Fraction of Events 0 0.01 0.02 0.03 0.04 0.05 | < 3.2 η 2.8 < |
Figure 5. Fraction of dijet events in data (points) and simulation (red band) with a jet aligned to ~/ETwithin ∆φ (~/ET,jet) < 0.2 and pointing towards (left) a masked ECAL channel, (middle) the barrel-endcap boundary, and (right) the endcap-forward boundary, as functions of /ET.
during offline reconstruction have a useful measurement of their energy from the separate readout
of the L1 trigger. Although the trigger readout saturates at ET=64GeV, it can be used to recover
energies smaller than this and to identify events that had more than this amount of energy in a masked channel. The saturation level was increased to 128GeV in 2011. Analysts can veto events with a jet pointing towards an ECAL masked channel that does not have trigger information or that has trigger-readout energy at the saturation threshold.
6 Missing transverse energy scale and resolution
In this section, we study the performance of~/ETusing events where an identified Z boson or isolated
γ is present. Events containing vector bosons may be produced in hard parton-parton collisions
such as qg→ qγ, q¯q → Z, qg→qZ, and q¯q → gZ. While there is no genuine /ETin these events, we
can induce it by removing the vector boson. By comparing the momenta of the well-measured and
well-understood vector boson to the ~/ET induced this way, we probe the detector response to the
under-2011 JINST 6 P09001
lying processes may be simple, many physics and experimental issues contribute to the measured,induced ~/ETin these events. Effects due to jet energy scale corrections and fluctuating jet
compo-sition directly impact the measurement of the hadronic products of the hard collision. Underlying event activity, pile-up, detector noise, and detector acceptance contribute as well.
The following notation is used: the vector boson momentum in the transverse plane is ~qT, and
the hadronic recoil, defined as the vector sum of the transverse momenta of all particles except the
vector boson (or its decay products, in the case of Z candidates), is ~uT. Momentum conservation in
the transverse plane requires ~qT+~uT=0. The recoil is the negative of the induced ~/ET.
The presence of a well-measured Z or γ provides both a momentum scale, qT≡ |~qT|, and a
unique event axis, ˆqT. The hadronic recoil can be projected onto this axis, yielding two signed com-ponents, parallel (uk) and perpendicular (u⊥) to the event axis. Since uk≡ ~uT·ˆqT, and the observed
hadronic system is usually in the opposite hemisphere from the boson, ukis typically negative.
The absolute value of the mean of the scalar quantity uk/qT is the scale factor correction
required for /ETmeasurements in the classes of events considered here, and is closely related to jet energy scale corrections and jet parton flavour. We refer to |huki|/qT as the “response” and denote
distributions of this quantity versus qTas “response curves”. Deviations of the response curve from
unity probe the /ET response as a function of qT.
Resolution is assessed by measuring the RMS spread of uk and u⊥ about their mean values,
after correcting for the response, and is denoted RMS(uk)and RMS(u⊥). As with the response, we
examine the resolutions as functions of qT.
The uncertainty on the /ET scale and resolution for a generic physics analysis has a strong
dependence on the final state being studied: events where the transverse momenta of the jets in the final state are small compared to the pTof a lepton (often true, for example, for leptonic W decays)
will have very different uncertainties than those dominated by several high pT jets. Each physics
analysis must have its /ET uncertainty evaluated carefully for its particular final state. The error
bars shown on the plots in these figures, however, can give an order of magnitude estimate of the resulting uncertainty for similar final states.
6.1 Direct photon sample
Candidate photon events are selected by requiring each event to contain exactly one reconstructed
photon in the barrel portion of the ECAL (|η| < 1.479), with qT>20GeV, and which passes the
identification and isolation selection described in section3. The total number of events passing
all requirements is 157 567, of which 67 621 have only one reconstructed primary vertex. The prescale factors for the HLT triggers used to collect this sample varied over the course of the 2010 LHC running period. As a result, this sample is dominated by events recorded during the earlier period of the data taking, when the fraction of crossings containing pile-up interactions was smaller.
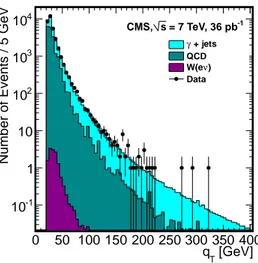
Figure6shows the photon qTspectrum for data and for simulation. About half of the observed
rate arises from QCD dijet production where one jet passes all photon identification requirements. Such jets are typically highly enriched in π0→ γγand contain little hadronic activity. The detector response to these jets is similar to that of single photons, and studies indicate that response curves extracted from these QCD background events match the response of true photon-jet events to within a percent. We therefore make no further attempt to filter them out. The detector response to the jet depends on the type of parton from which it originated. The leading jet in photon events is
2011 JINST 6 P09001
[GeV]T q
0 50 100 150 200 250 300 350 400
Number of Events / 5 GeV
-1 10 1 10 2 10 3 10 4 10 + jets γ QCD ) ν W(e Data -1 = 7 TeV, 36 pb s CMS,
Figure 6. Distribution of qTfor events selected as photon+jet candidates. Predicted rates from simulation for signal and backgrounds are also shown. QCD refers to multijet events.
predicted to predominantly be a quark jet. A prediction for the difference in response for the CMS
detector between quark and gluon jets can be found in [20]. The difference is largest for Calo Jets
(≈ 20% for jets with pTof 20GeV), and decreases with pT. The primary reason that the response
is lower for gluon jets is that their particles tend to have lower pTs, and the calorimeter response
is lower at low pT. For PF jets and PF /ET, which use tracker instead of calorimeter momenta for
most charged hadrons, the difference in response is reduced, and varies from about 5% at 20GeV to a percent a high pT.
6.2 Z samples
For the Z → e+e−selection (electron channel), we require two well-identified and isolated electrons with pT>20GeV, within the fiducial region of the ECAL. The invariant mass (M``) of the electron pair is required to be in the range 70 < M``<120GeV.
For the Z → µ+
µ− selection (muon channel), we require two isolated muons with opposite
electric charges, that have pT>20GeV, and are within the |η| < 2.1 region. The invariant mass
M``of the muon pair is required to be at least 60GeV and no more than 120GeV.
We obtain a total of 12 635 (12 383) Z → e+e−(Z → µ+
µ−) candidates. The relative contri-butions of signal and background are estimated from simulation. By normalizing the signal plus background invariant mass distribution from simulation so that it has the same number of events as observed in the data, a total background of around 143 (35) events is estimated, with contributions of 97 (2) events from QCD, 28 (9) events from electroweak, and 18 (24) from final states containing top quarks.
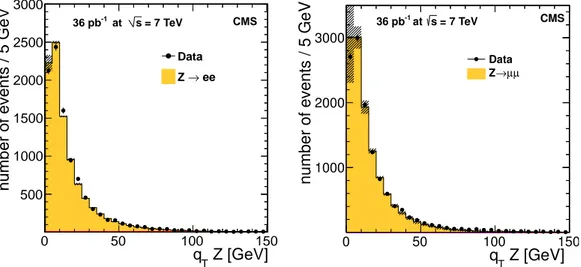
Figure7shows the M``distributions for the electron and muon samples. Figure8shows their
qT spectra. Except at very low qT, the leading jet in Z events, as with the γ events, should usually be a quark jet.
2011 JINST 6 P09001
[GeV]
ee
M
70 80 90 100 110 120
number of events / 1 GeV
-1 10 1 10 2 10 3 10 4 10 Data ee → Z EWK QCD +jet γ t t = 7 TeV s at -1 36 pb CMS 60 80 100 120 -1 10 1 10 2 10 3 10 4 10 [GeV] µ µ M
number of events / 1 GeV
Data µ µ → Z t t EWK QCD = 7 TeV s at -1 36 pb CMS
Figure 7. (left) Invariant mass distribution of the two leading electrons and (right) invariant mass distribution of the two leading muons, for the Z boson candidates, along with the predicted distributions from simulation. QCD refers to multijet events.
Z [GeV]
T
q
0 50 100 150
number of events / 5 GeV
500 1000 1500 2000 2500 3000 Data ee → Z = 7 TeV s at -1 36 pb CMS 0 50 100 150 1000 2000 3000 Z [GeV] T q
number of events / 5 GeV
Data µ µ → Z = 7 TeV s at -1 36 pb CMS
Figure 8. The qT distribution for Z boson candidates in (left) the electron channel and (right) the muon
channel, along with the prediction from simulation. Systematic uncertainties are shown as grey bands.
6.3 Scale and resolution for events with one primary vertex
To study the /ETscale and resolution, we decompose the recoil with respect to the boson (γ or Z) di-rection in the transverse plane. We restrict ourselves to events containing one reconstructed primary
vertex. Z yields are thus reduced to 2611 Z → e+e− candidates and 2438 Z → µ+
µ− candidates.
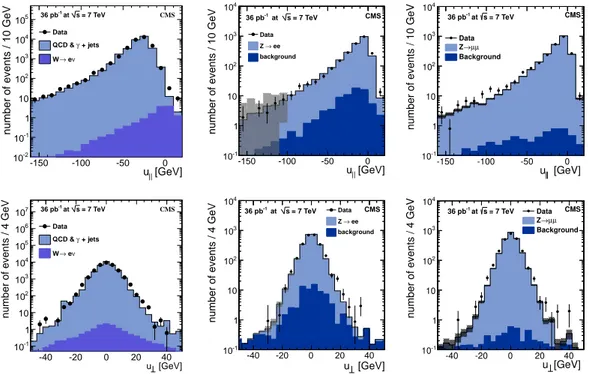
The effect of pile-up on the scale and the resolution is studied in section6.5.1. Distributions of the
components of the recoil calculated from PF /ET that are parallel and perpendicular to the boson
axis, uk and u⊥, are shown in figure 9 for direct photon candidates, Z → e+e− candidates, and
Z → µ+
µ− candidates. As expected, the parallel component is mainly negative, consistent with
the back-to-back nature of the events, while the perpendicular component is symmetric.
2011 JINST 6 P09001
[GeV]
||
u
-150 -100 -50 0
number of events / 10 GeV
-2 10 -1 10 1 10 2 10 3 10 4 10 5 10 Data + jets γ QCD & ν e → W = 7 TeV s at -1 36 pb CMS [GeV] || u -150 -100 -50 0
number of events / 10 GeV
-1 10 1 10 2 10 3 10 4 10 Data ee → Z background = 7 TeV s at -1 36 pb CMS -150 -100 -50 0 -1 10 1 10 2 10 3 10 4 10 [GeV] u
number of events / 10 GeV
Data µ µ → Z Background = 7 TeV s at -1 36 pb CMS [GeV] u -40 -20 0 20 40
number of events / 4 GeV
-1 10 1 10 2 10 3 10 4 10 5 10 6 10 7 10 Data + jets γ QCD & ν e → W = 7 TeV s at -1 36 pb CMS [GeV] u -40 -20 0 20 40
number of events / 4 GeV
-1 10 1 10 2 10 3 10 4 10 Data ee → Z background = 7 TeV s at -1 36 pb CMS -40 -20 0 20 40 -1 10 1 10 2 10 3 10 4 10 [GeV] u
number of events / 4 GeV
Data µ µ → Z Background = 7 TeV s at -1 36 pb CMS
Figure 9. ukdistributions for PF /ETfor (top, left) γ, (top, middle) Z → e+e− and (top, right) Z → µ+µ− events; u⊥distributions for PF /ET for (bottom, left) γ, (bottom, middle) Z → e+e−, and (bottom, right)
Z → µ+µ−events. Distributions are for events containing one PV, with a correction for residual pile-up
contamination. Statistical uncertainties and systematic uncertainties on the removal of events with more than one PV and on the boson qTspectrum are shown as grey bands on the prediction from simulation. QCD
refers to multijet production.
than one interaction. The number of events with more than one scattering that are reconstructed as a single PV is estimated by convolving the efficiency for reconstructing two vertices as a function of the vertex separation with the z distribution of vertices. The distributions are corrected for this contamination by subtracting multi-vertex-event shapes obtained from data, rescaled to the estimated contamination, from the distribution from events with one PV. The systematic uncertainty on the residual contamination is obtained by varying the normalization within its uncertainties.
Events generated withPYTHIAare reweighted so that the qTspectrum matches that predicted
by the RESBOSMonte Carlo program [21], in order to take advantage of its resummed calculation
of the boson qT spectrum. The systematic uncertainties due to our imperfect knowledge of the
true qT distributions for Z bosons are estimated from the difference between the qT distributions
predicted byPYTHIA and RESBOS. We set the systematic uncertainty, bin-by-bin in qT, equal to
this difference.
In addition, there is a systematic uncertainty on the prediction from the simulation due to the
size of the simulation samples. The dominant uncertainty on the uk distribution from the electron
channel below −100GeV is from this source and from uncertainties on the removal of the multi-PV contamination.
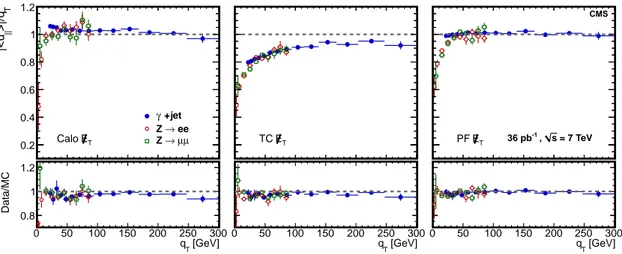
Figure10shows the response curves, |huki|/qTversus qT, extracted from data, for the three /ET reconstruction algorithms, Calo /ET, TC /ET, and PF /ET, for γ, Z → e+e−, and Z → µ+
2011 JINST 6 P09001
[GeV] T q 0 50 100 150 200 250 300 = 7 TeV s , -1 36 pb CMS T E PF [GeV] T q 0 50 100 150 200 250 300 Data/MC [GeV] T q 0 50 100 150 200 250 300 T E TC [GeV] T q 0 50 100 150 200 250 300 Data/MC [GeV] T q 0 50 100 150 200 250 300 T >|/q || |<u 0.2 0.4 0.6 0.8 1 1.2 +jet γ ee → Z µ µ → Z T E Calo [GeV] T q 0 50 100 150 200 250 300 Data/MC 0.8 1 1.2Figure 10. Response curves for events with one primary vertex, for (left) Calo /ET, (middle) TC /ET, and (right) PF /ET. Results are shown for photon events (full blue circles), Z → e+e−events (open red circles)
and Z → µ+µ−events (open green squares). The upper frame of each figure shows the response in data; the
lower frame shows the ratio of data to simulation. The vertical axis labels at the far left apply to all three subfigures. [GeV] T q 20 40 60 80 100 120 140 160 180 200 ) [GeV] || RMS(u 0 5 10 15 20 25 30 35 MC: Calo ET T E MC: TC T E MC: PF T E DATA 1PV: Calo T E DATA 1PV: TC T E DATA 1PV: PF -1 = 7 TeV, 36 pb s CMS, [GeV] T q 20 40 60 80 100 120 140 160 180 200 ) [GeV] RMS(u 0 5 10 15 20 25 30 35 MC: Calo ET T E MC: TC T E MC: PF T E DATA 1PV: Calo T E DATA 1PV: TC T E DATA 1PV: PF -1 = 7 TeV, 36 pb s CMS,
Figure 11. Resolution curves for components of hadronic recoil measured in direct photon candidate events with one primary vertex, (left) parallel to the boson direction, and (right) perpendicular to the boson di-rection. Data and simulation are indicated by points and histograms, respectively. Black circles denote Calo /ET, pink squares TC /ET, and blue triangles PF /ET. Shaded regions indicate statistical uncertainties on
the simulation.
The agreement in response between the different samples is good. The agreement between data and simulation is good, and the results indicate that the three reconstruction algorithms are distinct in their capabilities, performing differently in the recovery of hadronic activity in the detector. The
response for Calo /ET is slightly larger than one because the jet energy scale used in the type-I
corrections was determined from a sample with a mixture of quark and gluon jets, while in these samples the leading jet is primarily a quark jet. The TC /ETresponse is lower because it has neither
2011 JINST 6 P09001
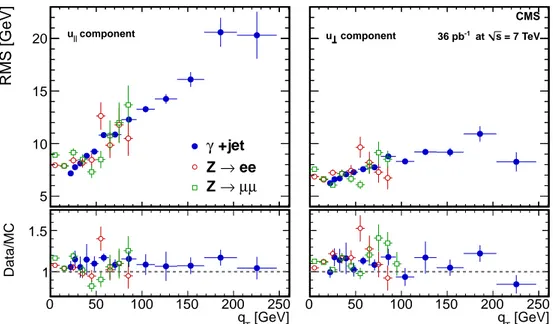
[GeV] T q 0 50 100 150 200 250 = 7 TeV s at -1 36 pb component u CMS [GeV] T q 0 50 100 150 200 250 Data/MC [GeV] T q 0 50 100 150 200 250 RMS [GeV] 5 10 15 20 u|| component +jet γ ee → Z µ µ → Z [GeV] T q 0 50 100 150 200 250 Data/MC 1 1.5Figure 12. Resolution curves for components of hadronic recoil calculated using PF /ET, measured in events with one primary vertex, (left) parallel to the boson direction, and (right) perpendicular to the boson direc-tion. Z → µ+µ−, Z → e+e−and γ events are indicated by open green squares, open red circles, and full
blue circles, respectively. The lower frame indicates the ratio of data to simulation. The vertical axis labels at the far left apply to both subfigures.
type-I nor type-II corrections. The PF /ETresponse is lower than the Calo /ETresponse at low values of qTbecause Calo /EThas type-II corrections while PF /EThas only type-I corrections.
Figure 11shows the resolution curves from photon candidate events for uk and u⊥ for data
and simulation, for all three reconstruction algorithms. Figure12shows the resolution as measured
in γ, Z → e+e−, and Z → µ+
µ− events for PF /ET. The measured resolution must be corrected
for the scale to avoid a misleading result; e.g., the apparent resolution on u⊥is proportional to the scale and therefore an algorithm with a scale that is smaller than unity could appear to have a better
resolution than one with a scale of unity without such a correction. Since only Calo /ET has been
corrected fully for the detector response with both type-I and type-II corrections, the resolution
measurements are rescaled, bin by bin, using the corresponding response curves of figure10. The
data confirm the prediction from simulation that tracking information significantly enhances the
~/ET resolution. The resolutions measured in the different samples are in good agreement, but are
≈10% worse than expected from the simulation. A similar difference in resolution for jets in the
2010 run is documented in [14]. The small discrepancies between data and simulation shown in
figure9are due to this difference.
6.4 Resolution in multijet events
The /ETresolution can also be evaluated in events with a purely hadronic final state, where the
ob-served /ETarises solely from resolution effects. Because the /ETresolution has a strong dependence
on the associated ∑ET, it is presented as a function of ∑ET. We characterize the ~/ET resolution
2011 JINST 6 P09001
Σσ
CMS
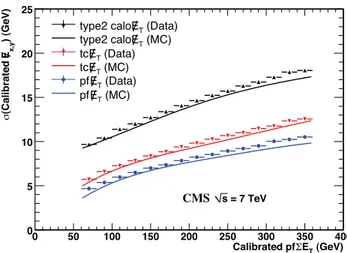
Figure 13. Calibrated /Ex,yresolution versus calibrated PF ∑ETfor Calo /ET, TC /ET, and PF /ETin data and
in simulation.
to make a meaningful comparison, we calibrate the measured /ET for the different algorithms to
the same scale using the response from figure10. These corrections would not be needed if all ~/ET
algorithms had both type-I and type-II corrections.
We use the PF ∑ET in plotting the /ETresolutions for all three algorithms, as it gives the best estimate of the true ∑ET, and hence is an accurate evaluation of the event activity. We calibrate PF ∑ ETto the particle-level ∑ET, on average, using the predicted average mean value as a function of
the particle-level ∑ETfrom a simulation of events from thePYTHIA8 event generator [22].
Figure 13 shows the calibrated /Ex,y Gaussian core resolution versus the calibrated PF ∑ET
for different /ETreconstruction algorithms in events containing at least two jets with pT>25GeV.
Both TC /ET and PF /ET show improvements in the /ET resolution compared to the Calo /ET, with
the PF /ETyielding the smallest /ETresolution.
Figure14shows the PF /ETdistributions for different intervals of Calo ∑ETand for jet multi-plicities varying from two to four, normalized to the same area. The jets are required to be above
a pT threshold of 20GeV. The good agreement of the normalized shapes in figure 14 indicates
that PF /ET-performance in events without genuine /ETis driven by the total amount of calorimetric
activity (parametrized by Calo ∑ET) and no residual nonlinear contribution from jets to PF /ET is
visible. Similar behaviour is also observed for Calo /ETand TC /ET.
6.5 Effect of multiple interactions
Pile-up, namely multiple proton collisions within the same bunch crossing, occurs because of high
LHC bunch currents and can play an important role in ~/ETperformance.
Because there is no true ~/ET in minimum-bias events and because the average value for a
component of ~/ET in these events is zero (e.g., the x or y component), pile-up should have only
a small effect on the scale of the component of the measured ~/ET projected along the true ~/ET
direction. Pile-up, however, will have a considerable effect on the resolution of the parallel and perpendicular components.
2011 JINST 6 P09001
[GeV] T E PF 0 20 40 60 80 100 120Fraction of Events / GeV
-7 10 -6 10 -5 10 -4 10 -3 10 -2 10 -1 10 1 2 Jets 3 Jets 4 Jets < 140 GeV T E Σ 120 < -1 0.025 pb = 7TeV s CMS, 0 20 40 60 80 100 120 2-jet / n-jet 0 0.5 1 1.5 2 [GeV] T E PF 0 20 40 60 80 100 120
Fraction of Events / GeV
-7 10 -6 10 -5 10 -4 10 -3 10 -2 10 -1 10 1 2 Jets 3 Jets 4 Jets < 225 GeV T E Σ 220 < -1 9.054 pb = 7TeV s CMS, 0 20 40 60 80 100 120 2-jet / n-jet 0 0.5 1 1.5 2 [GeV] T E PF 0 20 40 60 80 100 120
Fraction of Events / GeV
-7 10 -6 10 -5 10 -4 10 -3 10 -2 10 -1 10 1 2 Jets 3 Jets 4 Jets < 350 GeV T E Σ 340 < -1 9.054 pb = 7TeV s CMS, 0 20 40 60 80 100 120 2-jet / n-jet 0 0.5 1 1.5 2
Figure 14. PF /ETdistributions in 2-, 3-, and 4-jet events, in selected Calo ∑ETbins.
[GeV] T q 50 100 150 200 250 2PV/1PV ≥ Response 0.92 0.94 0.96 0.98 1 1.02 1.04 1.06 1.08 0.002 ± 1.007 T E Calo CMS, s = 7 TeV, 36 pb-1 [GeV] T q 50 100 150 200 250 2PV/1PV ≥ Response 0.92 0.94 0.96 0.98 1 1.02 1.04 1.06 1.08 0.001 ± 1.005 T E TC CMS, s = 7 TeV, 36 pb-1 [GeV] T q 50 100 150 200 250 2PV/1PV ≥ Response 0.92 0.94 0.96 0.98 1 1.02 1.04 1.06 1.08 0.001 ± 1.002 T E PF CMS, s = 7 TeV, 36 pb-1
Figure 15. The ratio of the responses for the component of the induced ~/ET along the boson direction, measured in γ events containing 1 PV and at least 2 PVs, for (left) Calo /ET, (middle) TC /ET, and (right)
PF /ET. Also given is the best fit value for the average ratio, which corresponds to the solid, red line.
6.5.1 Studies of pile-up effects using photon and Z events
In this section, we use samples containing a vector boson to measure the effect of pile-up on the
scale and resolution of a component of ~/ET. Figure15shows the ratio of the responses measured
in γ events containing 1 PV and at least 2 PVs. The ratio of the responses of the component of the measured ~/ETalong the boson direction is close to one, as expected. It is slightly larger at low qT when pile-up is present. This is expected, as pile-up can reduce energy lost due to zero suppression in the readout of the calorimeter if energy from a pile-up interaction and from the hard scattering are both in the same readout channel. If the sum is larger than the zero suppression thresholds, more of the energy from the hard scattering is recorded.
Figure 16 shows the resolution versus the qT of the γ for the components of the hadronic
recoil parallel and perpendicular to the boson direction for 1, 2, and 3 reconstructed PVs. Also
shown is the prediction from simulated γ events without pile-up. Figure 17shows the resolution
2011 JINST 6 P09001
[GeV] T photon q 20 40 60 80 100 120 140 160 180 200 ) [GeV] || RMS(u 5 10 15 20 25 30 T E Calo 3 vertices 2 vertices 1 vertex MC 1 vertex 0.15 GeV ± (20 GeV): 6.17 ES f × PU σ -1 = 7 TeV, 36 pb s CMS, [GeV] T photon q 20 40 60 80 100 120 140 160 180 200 ) [GeV] || RMS(u 5 10 15 20 25 30 T E TC 3 vertices 2 vertices 1 vertex MC 1 vertex 0.10 GeV ± (20 GeV): 3.88 ES f × PU σ -1 = 7 TeV, 36 pb s CMS, [GeV] T photon q 20 40 60 80 100 120 140 160 180 200 ) [GeV] || RMS(u 5 10 15 20 25 30 T E PF 3 vertices 2 vertices 1 vertex MC 1 vertex 0.09 GeV ± (20 GeV): 3.90 ES f × PU σ -1 = 7 TeV, 36 pb s CMS, [GeV] T photon q 20 40 60 80 100 120 140 160 180 200 ) [GeV] RMS(u 0 5 10 15 20 25 CaloET 3 vertices 2 vertices 1 vertex MC 1 vertex 0.14 GeV ± (20 GeV): 6.35 ES f × PU σ -1 = 7 TeV, 36 pb s CMS, [GeV] T photon q 20 40 60 80 100 120 140 160 180 200 ) [GeV] RMS(u 0 5 10 15 20 25 TC ET 3 vertices 2 vertices 1 vertex MC 1 vertex 0.09 GeV ± (20 GeV): 4.12 ES f × PU σ -1 = 7 TeV, 36 pb s CMS, [GeV] T photon q 20 40 60 80 100 120 140 160 180 200 ) [GeV] RMS(u 0 5 10 15 20 25 PF ET 3 vertices 2 vertices 1 vertex MC 1 vertex 0.09 GeV ± (20 GeV): 3.91 ES f × PU σ -1 = 7 TeV, 36 pb s CMS,Figure 16. Resolution versus photon qTfor the parallel component (top) and perpendicular component (bot-tom) for (left to right) Calo /ET, TC /ET, and PF /ET, for events with 1 (circles), 2 (squares), and 3 (triangles)
reconstructed primary vertices.
parametrization of /ETresolution used in figures16and17is given by
σtotal2 = (a√qT+ b)2 + (σnoisefES(qT))2+ (N −1)(σPUfES(qT))2, (6.1) where a and b characterize the hard process, σnoiseis the intrinsic noise resolution, N is the number of reconstructed vertices in the event, σPU is the intrinsic pile-up resolution, and fES(qT) is the
energy scale correction applied on each event. At low qT, the resolution is dominated by
contri-butions from the underlying event and detector noise (σnoise). Since these contributions cannot be
distinguished from those due to the particles from the recoil, and since the recoil measurement needs to be corrected for the detector response, these contributions are magnified and have a larger
effect at low boson qT when energy scale corrections are applied. As expected, the resolution is
degraded with increasing pile-up interactions. Results from the Z and γ channels are in agreement and are similar to the values obtained in section6.5.2from jet data.
6.5.2 Studies of pile-up effects in jet data
In this section, we study the behaviour of the PF /ET distributions in samples containing high pT
jets when pile-up is present. The data are selected using a prescaled HT trigger with a threshold
of 100GeV, where HT is defined as the scalar sum of the transverse momenta of PF jets (pT>
20GeV, |η| < 3). Additionally, in the offline analysis, each event is required to have HT(calculated
using PF jets) >200GeV to avoid bias from the trigger. Figure18shows that the widening of the
2011 JINST 6 P09001
[GeV] T Z q 0 10 20 30 40 50 60 70 80 ) [GeV]|| RMS( u 5 10 15 20 25 30 1 PV (no PU) 2 PV 3 PV 4 PV 0.23 GeV ± (20 GeV) = 5.83 ES f × PU σ T E Calo = 7 TeV s at -1 36 pb CMS [GeV] T Z q 0 10 20 30 40 50 60 70 80 ) [GeV] || RMS( u 5 10 15 20 25 30 1 PV (no PU) 2 PV 3 PV 4 PV 0.12 GeV ± (20 GeV) = 3.70 ES f × PU σ T E TC = 7 TeV s at -1 36 pb CMS [GeV] T Z q 0 10 20 30 40 50 60 70 80 ) [GeV]|| RMS( u 5 10 15 20 25 30 1 PV (no PU) 2 PV 3 PV 4 PV 0.32 GeV ± (20 GeV) = 3.60 ES f × PU σ T E PF = 7 TeV s at -1 36 pb CMS [GeV] T Z q 0 10 20 30 40 50 60 70 80 ) [GeV] RMS( u 5 10 15 20 25 30 1 PV (no PU) 2 PV 3 PV 4 PV 0.19 GeV ± (20 GeV) = 6.36 ES f × PU σ T E Calo = 7 TeV s at -1 36 pb CMS [GeV] T Z q 0 10 20 30 40 50 60 70 80 ) [GeV] RMS( u 5 10 15 20 25 30 1 PV (no PU) 2 PV 3 PV 4 PV 0.09 GeV ± (20 GeV) = 4.34 ES f × PU σ T E TC = 7 TeV s at -1 36 pb CMS [GeV] T Z q 0 10 20 30 40 50 60 70 80 ) [GeV] RMS( u 5 10 15 20 25 30 1 PV (no PU) 2 PV 3 PV 4 PV 0.30 GeV ± (20 GeV) = 3.87 ES f × PU σ T E PF = 7 TeV s at -1 36 pb CMSFigure 17. Resolution versus the qTof the Z for the parallel component (top) and perpendicular component (bottom) for (left to right) Calo /ET, TC /ET, and PF /ET, for events with 1 (circles), 2 (squares), 3 (triangles),
and 4 (diamonds) reconstructed primary vertices.
components of the one-vertex /ET shape with a Gaussian function G whose mean is (n − 1) · ∆µx
and whose standard deviation is√n−1 · ∆σx: / ET,n= q ( /Ex1⊗ G[(n −1) · ∆µx, √ n−1 · ∆σx])2+ ( /Ey1⊗ G[(n −1) · ∆µy, √ n−1 · ∆σy])2, (6.2)
where /Ex,y are the x and y components of ~/ET. Here we assume that each additional vertex
con-tributes with a constant ∆σx (∆σy) to the /ET resolution such that the resolution with n pile-up
interactions is related to that with one primary vertex via σ2
xn= σx21+ (n −1)∆σx2. In addition we also allow for a linear shift of /Ex and /Ey by ∆µx(∆µy) such that µxn= µx1+ (n −1)∆µx. A fit of eq. (6.2) to data results in ∆σx= ∆σy=3.7GeV, consistent with the results from section6.5.1. This
fit is performed simultaneously on the /ETdistributions of events containing two to seven vertices.
The shifts of the x and y /ETcomponents are estimated to be ∆µx=0.5GeV and ∆µy= −0.3GeV,
respectively, which are small compared to ∆σ and are consistent with the expected shift seen in simulation due to nonfunctioning channels.
7 Studies of physics processes containing genuine /ET
In this section, we examine distributions relevant to ~/ET in events containing neutrinos. Events