The progression from obesity to type 2 diabetes in Alström
syndrome
Vera Bettini, MD1, Pietro Maffei, MD1, Claudio Pagano, MD1, Sara Romano, MD1, Gabriella Milan, BS1, Francesca Favaretto, BS1, Jan D. Marshall, BA2, Richard Paisey, MD3,
Francesco Scolari, MD4, Nella A. Greggio, MD5, Ilaria Tosetto, MD5, Jϋrgen K. Naggert,
PhD2, Nicola Sicolo, MD1, and Roberto Vettor, MD1
1Department of Medical and Surgical Sciences, University School of Medicine, Padua, Italy
2The Jackson Laboratory, Bar Harbor, ME, USA
3Torbay Hospital, Torquay, UK
4Nephrology, University School of Medicine, Brescia, Italy
5Paediatric Department, University School of Medicine, Padua, Italy
Abstract
Background—Alström syndrome (ALMS) is a rare autosomal recessive monogenic disease associated with obesity, hyperinsulinemia and alterations of glucose metabolism that often lead to the development of type 2 diabetes in a young age.
Objective—Relationship between weight and metabolism has been studied in a group of ALMS patients and matched controls.
Research design and methods—Fifteen ALMS patients (8 M, 7 F, aged 3-51 yrs) were compared in a cross-sectional study with an age- and weight-matched control population.
Anthropometric parameters, fat mass, glucose and insulin secretion in basal and dynamic (OGTT) conditions were measured. Further anthropometric and body composition data were obtained from an International group of 27 ALMS patients (13 M, 14 F, age range: 4-29 yrs).
Results—In ALMS we observed an inverse correlation between age and SDS for height, weight and BMI. The OGTT glycemic curves of ALMS subjects were similar to those of age-matched controls, while insulin response was clearly greater. In ALMS individuals the insulin response showed a reduction with age. We documented pathologic values of the derived indices HOMA-IR, ISI, HOMA%β cell and Insulinogenic Index in ALMS, but unlike the insulin-resistance indices, the beta-cell function indices showed a significant reduction with age.
Conclusions—In ALMS the progression from the early onset obesity towards the impaired fasting glucose or IGT and overt diabetes is mostly due to a progressive failure of β-cell insulin secretion without any further worsening of insulin resistance with age, even in the presence of weight reduction.
Keywords
Alström syndrome; ALMS1; obesity; diabetes; insulin resistance
NIH Public Access
Author Manuscript
Pediatr Diabetes
. Author manuscript; available in PMC 2013 February 01.Published in final edited form as:
Pediatr Diabetes. 2012 February ; 13(1): 59–67. doi:10.1111/j.1399-5448.2011.00789.x.
NIH-PA Author Manuscript
NIH-PA Author Manuscript
Introduction
Alström syndrome (ALMS) (OMIM 203800) is a recessive monogenic disease, affecting multiple organ systems, and caused by mutations in ALMS1, a large gene on chromosome 2p13 [1]. Approximately 700 patients have been diagnosed world-wide so far [personal communication-jdm]. The role of the ALMS1 protein is not yet known, although it localizes to the basal bodies of centrosomes and is implicated in ciliary function [2]. ALMS is characterized by a progressive retinal cone-rod dystrophy causing nystagmus and photodysphoria in the first months of life, and leading to blindness by adulthood [3,4]. A mild-to-profound bilateral sensorineural hearing loss develops throughout childhood. Dilated cardiomyopathy is reported in 60% of cases and can occur at various stages of life, primarily infancy [5]. Patients in adolescence or adulthood often present with progressive restrictive cardiomyopathy. They also exhibit variable urologic and pulmonary disturbances. Progressive hepatic and renal failure occur as the ALMS patient ages. The life span of ALMS individuals rarely exceeds 40 years if cardiac involvement is severe [1]. Systemic fibrosis has been found in biopsy and post-mortem specimens, and probably contributes to systemic complications and multi-organ failure [1,5].
Most children with ALMS are obese, with marked hyperinsulinaemia associated with acanthosis nigricans. Type 2 diabetes mellitus (T2DM) develops in 70% of subjects in the 2nd-3rd decade of life [1,5]. Other common metabolic disorders in adolescents and adults include hypertriglicerydaemia, hyperuricaemia and a non alcoholic steatohepatitis associated with liver function abnormalities. Endocrinological problems have been reported including hypothyroidism, GH-deficiency, primary hypogonadism in males and hyperandrogenism in females [1,5,6].
The mechanisms underlying the development of hyperinsulinemia and T2DM are still unknown in ALMS. Whether metabolic complications are primarily related to genetic determinants or body weight is still a matter of discussion. Furthermore, it has not been clarified whether T2DM in ALMS is attributed principally to decreased insulin-stimulated glucose uptake, progressive beta-cell failure, or both.
The aim of this study has been to specifically address the time course of insulin-resistance and beta-cell function, in relation to age, weight variations and body composition in a group of paediatric and adult patients affected by Alström syndrome.
Methods
Italian patients
Fifteen patients were included in this cross-sectional study (8 males and 7 females) and all satisfied the clinical and genetic criteria for the diagnosis of Alström syndrome [1] (Table 1). A 2-yr-old ALMS female was excluded from the study due to her “outlier phenotype” of low weight (BMI 13.43) associated with feeding disorders and neurological development delay.
The age range was 3-51 years (y), with a median age of 23,8 y; comprising six paediatric patients (3-13 y). There were 4 sets of siblings (# 2,4; 8,10; 9,12; 14,15) (Table 1). One patient (# 13) was born from a first-degree consanguineous union. Patients # 6 and # 10 are deceased at age 13 and 29 respectively. Although the patients came from various regions of Italy, they were all followed in our department, with the exception of patient # 10 who was diagnosed retrospectively by clinical records and genetic confirmation of archived DNA samples. Careful medical history, clinical examinations, anthropometric measurements (weight, height, body mass index, waist circumference), metabolic and endocrinological
NIH-PA Author Manuscript
NIH-PA Author Manuscript
assessments were obtained from each patient. 8 of the living adult patients were also evaluated for body composition (fat mass) by bioelectrical impedance analysis (BIA). Medical information from multiple yearly evaluations was collected from previous clinical records. For metabolic investigations, patients were divided into 3 groups according to age, as shown in table 2.
Patients were also investigated for the following hormones: FT3, FT4, TSH, LH, FSH, 17 β-estradiol, progesterone, PRL, testosterone, cortisol, ACTH, GH (basal and after stimulation with GHRH+arginine), and IGF-I. Based on these results, we found 4 patients with
hypothyroidism, 3 with hypogonadism and 4 had GH-deficiency. Finally patients underwent the following investigations: electrocardiography, echocardiography, chest X-ray,
abdominal US examination, and audiometry. Control subjects
A group of 36 control subjects (age range 3-44 y), was evaluated in the following
proportion: 5 subjects <7 y, 10 subjects 7-18 y, 21 subjects >18 y. This control population was selected from patients referred to our department for weight disorders excluding the presence of a monogenic obesity. BMI in the control group was not significantly different from that of ALMS subjects (ALMS vs Controls respectively: < 7 years 25,4 vs 25,1; 7-18 years 28,1 vs 31,9; >18 years 28,0 vs 27,2). Three control subjects presented impaired fasting glycaemia. Additionally, the waist circumference in the adult patients (age > 18 y) was not significantly different between the two groups.
International group of ALMS patients
Body composition data were derived from BIA analysis of an additional group of 27 ALMS subjects (13 males, 14 females, age range: 4-29 y) examined during an Alström Syndrome International Meeting (Ontario, Canada 2001). Combining the data from the Italian and International groups of patients, we calculated the Standard Deviation Scores (SDS) for weight, height and BMI of all the measurements in our possession, performed in patients under 24 y.
Assays—We investigated Italian ALMS patients and control subjects for the following analyses, according to the standard laboratory methods of the central laboratory of Padua University Hospital. All the fasting venous blood samples were obtained from 7.30-9.30 AM. The measurements taken and their normal range (enclosed in parenthesis) are the following:
Basal investigations: Glucose [3,7-6,1 mmol/L]; Insulin [6,0-29,1 mmol/L]; AST [10-45 U/ L]; ALT [10-50 U/L]; γGT [3-65 U/L]; Total Cholesterol [desirable <5,18 mmol/L, elevated >6,19 mmol/L]; LDL cholesterol [desirable <3,36 mmol/L, elevated >4,11 mmol/L]; HDL cholesterol [desirable >1,00 mmol/L; protective >1,55 mmol/L]; Triglycerides [desirable <1,69 mmol/L]; ApoA1 [1,15-2,20 g/L]; ApoB [0,70-1,60 g/L].
Dynamic investigations: In non-diabetic ALMS patients an OGTT with ingestion of 75 g of glucose dissolved in 200 ml water flavoured with citric acid was performed according to WHO standards, including an FBG and a blood glucose measurement after 30, 60, 90, 120 and 180 minutes. The dose of glucose load in the paediatric population was 1.75 grams of glucose per kilogram of body weight to a maximum dose of 75 g (age < 7y OGTT measurements after 30, 60, 120 m′)
Derived measurements: In order to investigate fasting insulin-resistance and fasting beta-cell function, we used the homeostatic model HOMA1 (Homeostasis Model Assessment) [8]
NIH-PA Author Manuscript
NIH-PA Author Manuscript
which requires the parameters of fasting glucose and insulin calculated according to the following formula: HOMA insulin-resistance (HOMA1-IR)=
The formula used to obtain basal beta-cell function (HOMA1 %β cell) is the following:
Matsuda index [9], also called Insulin Sensitivity Index (ISI), was utilized to estimate insulin sensitivity during OGTT:
where G0 and I0 indicate fasting glucose and fasting insulin, respectively, and Gm and Im correspond to the mean of glucose and insulin during OGTT (0′-180′).
The last index, the Insulinogenic Index [10], estimates the early phase insulin secretion, and was calculated as the ratio of the increment of serum insulin 30 minutes after an oral glucose load, to blood glucose concentration 30 minutes after the glucose load:
Body composition measurements: Weight was measured in light indoor clothing to the nearest 0,1kg, and height measured without shoes to the nearest 0,1 cm using a portable stadiometer. BMI was calculated as weight (kg) / height (m)2. For adult patients (≥ 18 years), overweight and obesity were classified according to the WHO guidelines (1997), which define overweight as a BMI ≥ 25 and < 30, and obesity as a BMI ≥ 30. The classifications of overweight and obesity in paediatric patients were defined by Cole et al [11]. The SDS of BMI, weight and height were obtained using a web calculation tool (http://www.phsim.man.ac.uk/ SDSCalculator; SDS Individual Calculator for British 1990 Growth Reference Data). Waist circumferences were measured to the nearest 0,1 cm using a flexible non-stretchable tape measure. BIA measurements were taken in fasting condition, in a supine position and at rest. We utilized the bioelectric impedance analyzer, STA-BIA Body Composition Analyzer (Akern Bioresearch, Florence, Italy), and the data were elaborated by the software BIA-SITA and Bodygram software (Akern Bioresearch, Florence, Italy). Fat free mass (FFM) was expressed by percentage of total body weight (%FFM), and the fat mass (FM) was calculated as the difference between total body weight and the FFM, and it was also expressed as a percentage of total body weight (%FM). Both Italian and International group of patients were evaluated using the same impedentiometer.
NIH-PA Author Manuscript
NIH-PA Author Manuscript
Statistical analyses—Results are expressed as mean ± standard error of the mean (SEM). Comparisons between ALMS and control patients were calculated using the unpaired t-test (with correction for multiple measurements)..Correlations between normally distributed continuous variables were analysed by least mean squares regressions. p<0,05 was considered significant.
Results
Body composition measurements
Anthropometric variables of 9 adult Italian patients (Table 1) showed that 1 had a normal body weight, 7 were overweight and 1 was obese. Among the 6 paediatric patients (Table 1), 1 was overweight and 5 were obese. Retrospectively, 7 adult patients were found to be obese in their infancy. Considering the stature trend in terms of SDS from 39 patients (13 Italian and 26 International), we found that there was an inverse correlation with age (r= -0,554; p=0,0001). In infancy, stature-SDS values were markedly positive, while in adulthood they were negative (higher stature-SDS +3,86 at 8 y, lower stature-SDS -2,97 at 21 y). Also body weight-SDS, in the same group of patients, was found to have an inverse correlation with age (r=-0,43; p=0,001) and it was always positive. We also found an inverse correlation of BMI-SDS with age (r= -0,36; p= 0,006). When analyzed separately by gender, there were no correlations between age and anthropometric parameters in females, with the exception of height-SDS (Table 3). BIA data from 32 ALMS patients (8 Italian and 24 International; age range 5-51 y) showed that only in males there was a significant reduction of FM% and an increasing of FFM% with age (Table 3).
Metabolic characteristics
We found that, in the group of age < 7y, all (5/5) had normal glucose tolerance, in the 7-18 y group 3 patients out of 5 had normal glucose tolerance and 2 had IGT. Finally, in the >18 years group, 3 patients out of 9 had normal glucose tolerance, 4 had IGT and 2 were diabetic (Table 1 and 2). Basal insulin was elevated in all patients belonging to the two older patient groups (7- 18y and >18 y), with the exception of 4 patients (#9,12,14,15).
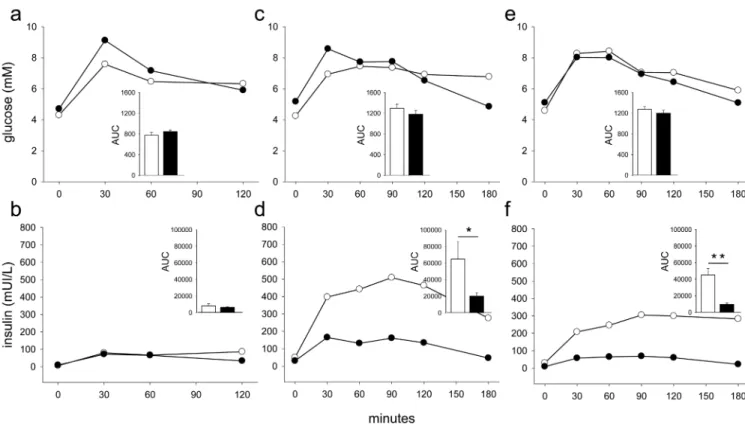
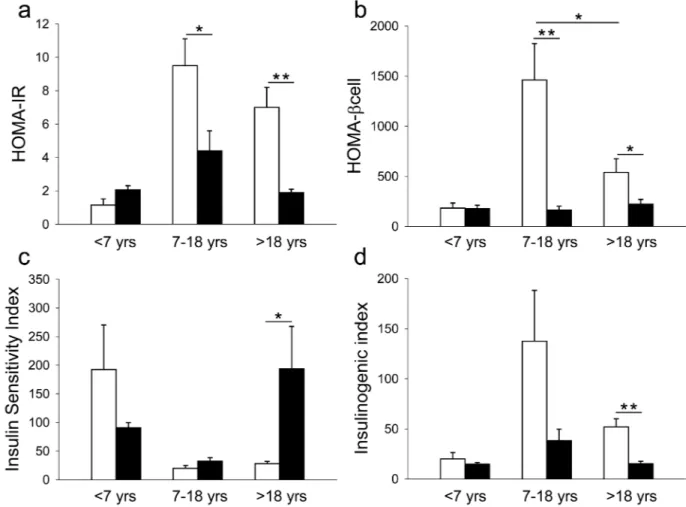
We compared glucose and insulin response during OGTT in ALMS and control patients (Fig 1). Glycemic curves including glycaemia-AUC, were largely indistinguishable from each other in all age groups. On the contrary, insulin curves (age > 7y) differ significantly between ALMS and control patients. There was a higher insulin-AUC in ALMS compared to controls in both older groups (Fig 1). We also compared the derived indices, of insulin resistance and beta cell function, in ALMS and controls in different age groups (Fig 2) and found that in both the 7-18y and > 18y age groups, HOMA-IR, HOMA%βcell and Insulinogenic Index were higher in ALMS than in controls. ISI was higher in controls only in the age group >18y. Finally, both HOMA%βcell and Insulinogenic Index decreased with age in ALMS individuals. There were no gender differences in insulin sensitivity nor in insulin resistance.
Lipids, Uric acid and Hepatic enzymes
Triglycerides were remarkably elevated in all patients over 7 y, except in one case (patient #7). One patient (#9) presented with hypertriglyceridaemia at 1 year of age. Eight adult patients out of 9 (88%) had dyslipidemia, while among pediatric patients a mild
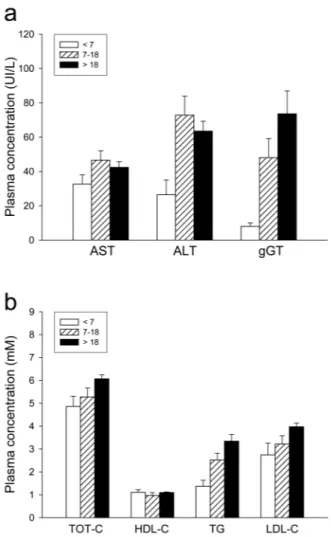
dyslipidemia was observed in 3 patients out of 6. We found low levels of apolipoproteinA1 and high levels of uric acid (> 0,42 mmol/L) in 6 adult patients. On evaluations of hepatic enzymes, we found that ALT and gGT in particular, tended to rise over the life of these patients (Fig 3).
NIH-PA Author Manuscript
NIH-PA Author Manuscript
Discussion
Alström syndrome is very rare, with approximately 700 cases having been identified since first described in 1959 [12]. Obesity, insulin resistance and T2DM are among the major criteria for the diagnosis of Alström syndrome, both in pediatric and adult populations. This study shows that development of insulin resistance and beta cell failure in Alström
syndrome are distinct in mechanisms and time course from that observed in age, sex, weight and BMI matched control subjects. Previous reporting specifically addressing the metabolic aspects of ALMS are scanty and typically relate to sporadic cases, sometimes not genetically confirmed, or lacking a control group [6, 13-15]. The cohort described in this study is the largest ever reported on this topic. Furthermore, the metabolic complications might have a great impact on management, quality of life and prognosis of patients and elucidation of their mechanisms that might shed new light on therapy.
We found that ALMS individuals were characterized by a childhood overweight or obesity that partially normalized as they reached adulthood, with weight and BMI trends differing by gender. In fact, weight SDS, BMI SDS and fat mass reduction in adults was significant only in males. This differs from what is reported in general population, where generally weight and BMI progressively increase with age. Also contrary to the general population, ALMS is characterized by fat accumulation in subcutaneous instead of visceral regions [15]. In a study of 12 UK ALMS patients, waist circumference and fat mass, but not BMI, were negatively correlated with age [14]. Furthermore, there was no significant gender difference in the percentage of body fat although it was suggested that males had higher total fat levels. The 3-fold increase in the number of subjects included in the present cohort and the wide age range might explain the different results.
Animal models do not help to clarify this observation, since in the three mouse models of ALMS [16-18] aging was associated with progressive increase of body weight and fat mass. Furthermore, in the Alms1 gene-trapped mouse model,, Alms1GT/GT the majority of adipose tissue was found in the subcutaneous and reproductive regions with adiposity indices higher in females (3-fold) than males (2-fold) in comparison to controls and only males become hyperglycemic [16].
The pathogenesis of obesity in ALMS patients is still unknown. Hyperphagia could be responsible for the progressive weight gain and for the secondary metabolic complications. At present it has been reported only anecdotally in some subjects, particularly in childhood, but one report documents a normalizing of BMI and prevention of hyperinsulinemia in a year old child on caloric restriction [7]. In the mouse model, fat aussie (foz/foz),
hyperphagia was observed before they started to gain weight [17]. It is therefore possible that with ageing, the food-intake behavior could change or modification of ciliary hypothalamic function might occur.
In the metabolic aspects of the subset of the Italian ALMS patients, we have noted a differences glycaemic balance with ageing. In adults, the prevalence of T2DM was 22%, and when the other metabolic complications (IGT, IFG) are considered, the percentage of glucose metabolism derangement in adults was 67%. Very young subjects (< 7 y) in spite of overweight or obesity showed normal insulin resistance insulin sensitivity and beta-cell function in comparison to BMI matched controls. On the contrary, in age groups >7 y insulin-resistance (HOMA-IR) was consistently significantly elevated, whereas insulin sensitivity (ISI) was reduced in comparison to controls only in older patients (>18 y). Both these parameters were unmodified across age groups. Our results provide evidence for a mechanism of insulin-resistance independent of body weight. In the general population, fat mass reduction results in a reduction of liver steatosis and enhanced glucose tolerance.
NIH-PA Author Manuscript
NIH-PA Author Manuscript
However, in lipodystrophies fat mass reduction leads to a decrease rather than an increase in systemic insulin sensitivity [19]. Insulin-resistance might be accompanied by rising free fatty acids levels which indirectely favor triglyceride infiltration of the liver and pancreas although insulin driven lipogenesis can also make a significant contribution to fatty liver. In this study, ALMS patients showed an elevation of their lipid profile and hepatic enzymes across age groups. Free fatty acids remain uninvestigated in ALMS, but Paisey et al described a marked hypertriglyceridaemia independent from insulin levels or metabolic profile [6]. The β-cell function determined by the HOMA %βcell and the Insulinogenic Index, was augmented in ALMS patients compared to age matched controls, but was reduced in patients > 18y, with those under 18y having a significantly higher β-cell secretion. The higher β-cell secretion could be interpreted as a compensatory mechanism made by pancreatic β-cells in order to temporarily maintain glucose homeostasis in the presence of a marked insulin-resistance. Also in the Alms1GT/GT and foz/foz, mouse models, hyperinsulinemia develops early and pancreatic islets show beta cell proliferation, thus suggesting that both insulin-resistance and increased insulin secretion might contribute to glucose intolerance. Development of diabetes could therefore, result from the metabolic effect of “β-cell exhaustion”. The primary cause of the insulin- resistance is most likely to be due to the effects of ALMS1 mutations on ciliary function and distinct from simple obesity.
Finally, since it has been described the presence of systemic fibrosis in biopsies and post-mortem investigations [1,5], it can be hypothesized that fibrosis occurring at the pancreatic level could compromise β-cell function resulting in secondary diabetes. Insulin secretion could in this situation be concomitantly decreased due to reduction in glucagon reserve. This has not been studied in Alström syndrome.
Strengths of the current study include the relatively large cohort of ALMS patients, their accurate genetic characterization, the comparison with an age, BMI, and weight matched population, as well as the application of validated measures of both insulin resistance and beta-cell dysfunction widely used in large clinical studies. Limitations include the cross-sectional design, and the use of surrogate rather than direct measures of insulin resistance and beta cell function. However, direct measures (such as clamp studies) would be difficult to implement given their cost, invasiveness and time requirement, which might be
particularly burdensome especially in younger subjects.
To summarize, we can affirm that both insulin-resistance and β-cell failure are the two determinant factors responsible for the development of glucose metabolism alterations in Alström patients. In ALMS the progression from the early onset obesity towards the impaired fasting glucose or IGT and overt diabetes is mostly due to a progressive failure of
β-cell insulin secretion without any further worsening of insulin resistance with age. It is
atypical and noteworthy to find these metabolic alterations even in the presence of weight reduction, which differs from the general population and is much more similar to
lipodystrophy..
Acknowledgments
Vera Bettini: researched data, wrote/edited the manuscript and followed patients Claudio Pagano: followed patients, design of the study, contributed to discussion Sara Romano: researched data, followed patients
Gabriella Milan: researched data, genetic investigation, editing of Figures Francesca Favaretto: researched data, genetic investigation
NIH-PA Author Manuscript
NIH-PA Author Manuscript
Jan D. Marshall: wrote the discussion, followed patients, genetic investigation Gayle B. Collin: contributed to discussion, genetic investigation
Jϋrgen K. Naggert: contributed to discussion Francesco Scolari: followed patients
Richard Paisey: contributed to discussion, followed patients Nella Augusta Greggio: followed patients, contributed to discussion Ilaria Tosetto: followed patients, researched data
Nicola Sicolo: contributed to discussion and funded the study Roberto Vettor: contributed to discussion and funded the study
Pietro Maffei: wrote/edited/reviewed the manuscript, design of the study, followed patients
Executive Agency for Health and Consumer; EURO-Rare diabetes; agreement number 2010 12 05 (Claudio Pagano, Gabriella Milan, Nicola Sicolo, Pietro Maffei)
References
1. Marshall JD, Beck S, Maffei P, Naggert JK. Alström syndrome. Euro J Hum Genet. 2007; 15(12): 1193–1202.
2. Hearn T, Spalluto C, Phillips VJ, et al. Subcellular localization of ALMS1 supports involvement of centrosome and basal body dysfunction in the pathogenesis of obesity, insulin resistance, and type 2 diabetes. Diabetes. 2005; 54:1581–1587. [PubMed: 15855349]
3. Tremblay F, LaRoche RG, Shea SE, Ludman MD. Longitudinal study of the early
electroretinographic changes in Alström's syndrome. Am J Ophtalmol. 1993; 115:657–665. 4. Russell-Eggit IM, Clayton PT, Coffey R, Kriss A, Taylor DS, Taylor JF. Alström syndrome. Report
of 22 cases and literature review. Ophtalmology. 1998; 105:1274–1280.
5. Marshall JD, Bronson RT, Collin JB, et al. New Alström syndrome phenotypes based on the evaluation of 182 cases. Arch Intern Med. 2005; 165:675–683. [PubMed: 15795345]
6. Paisey RB, Carey CM, Bower L, et al. Hypertriglyceridaemia in Alström's syndrome: causes and associations in 37 cases. Clin Endocrinol (Oxf). 2004; 60:228–231. [PubMed: 14725685] 7. Lee NC, Marshall JD, Collin GB, et al. Caloric restriction in Alström syndrome prevents
hyperinsulinemia– A case report. Am J Med Genet. 2009; A 149:666–668. [PubMed: 19283853] 8. Matthews DR, Hosker JP, Rudenski AS. Homeostasis Model Assessment: insulin-resistance and
beta-cell function from fasting plasma glucose and insulin concentration in man. Diabetologia. 1985; 28:412–419. [PubMed: 3899825]
9. Matsude M, DeFronzo RA. Insulin Sensitivity Indices obtained from oral glucose tolerance testing. Comparison with the euglycemic insulin clamp. Diabetes Care. 1999; 22:1462–1470. [PubMed: 10480510]
10. Seltzer HS, Allen EW, Herron AL Jr, Brennan NT. Insulin secretion in response to glycemic stimulus: relation of delayed initial release to carbohydrate intolerance in mild diabetes mellitus. J Clin Invest. 1967; 46:323–335. [PubMed: 6023769]
11. Cole TG, Bellizzi MC, Flegal KM, Dietz WH. Establishing a standard definition for child overweight and obesity worldwide: International survey. BMJ. 2000; 320:1240–1243. [PubMed: 10797032]
12. Alström CH, Hallgren B, Nillson LB, Asander H. Retinal degeneration combined with obesity, diabetes mellitus and neurogenous deafness: a specific syndrome (not hitherto described) distinct from the Laurence-Moon-Bardet-Biedl syndrome: a clinical, endocrinological and genetic examination based on a large pedigree. Acta Psychiatr Neurol Scand. 1959; 34:1–35. [PubMed: 13617033]
NIH-PA Author Manuscript
NIH-PA Author Manuscript
13. Satman I, Yilmaz MT, Gursoy N, et al. Evaluation of insulin-resistant diabetes mellitus in Alström syndrome: a long-term prospective follow-up of three siblings. Diabetes Res Clin Pract. 2002; 56:189–196. [PubMed: 11947966]
14. Minton JA, Owen KR, Ricketts CJ, et al. Syndromic obesity and diabetes: changes in body composition with age and mutation analysis of ALMS1 in 12 UK kindreds with Alström syndrome. J Clin Endocrin Metab. 2006; 91(8):3110–3116.
15. Paisey RB, Hodge D, Williams K. Body fat distribution, serum glucose, lipid and insulin response to meals in Alström syndrome. J Hum Nutr Diet. 2008; 21:268–274. [PubMed: 18477182] 16. Collin GB, Cyr E, Bronson R, et al. Alms1-disrupted mice recapitulate human Alström syndrome.
Hum Mol Genet. 2005; 14:2323–2333. [PubMed: 16000322]
17. Arsov T, Silva DG, O'Bryan MK, et al. Fat aussie. A new Alström syndrome mouse. Mol Endocrinol. 2006; 20(7):1610–1622. [PubMed: 16513793]
18. Li G, Vega R, Nelms K, Gekakis N, et al. A role for Alström syndrome protein, Alms1, in kidney ciliogenesis and cellular quiescence. PLoS Genet. 2007; 3(e8):0001–0012.
19. Huang-Doran I, Sleigh A, Rochford JJ, O'Rahilly S, Savage DB. Lipodystrophy: metabolic insights from a rare disorder. JOE. 2010:207, 245–255. [PubMed: 21134990]
NIH-PA Author Manuscript
NIH-PA Author Manuscript
Figure 1. Glucose and insulin responses during OGTT according to age groups in ALMS and controls
(a) glucose response < 7 y, (b) insulin response < 7 y, (c) glucose response 7-18 y, (d) insulin response 7-18 y, (e) glucose response > 18 y, (f) insulin response > 18 y. Alström subjects are indicated by white circles and white bars, control subjects by black circles and black bars. AUC, area under curves. *P < 0,05; **P < 0.01
NIH-PA Author Manuscript
NIH-PA Author Manuscript
Figure 2. Comparison of HOMA-IR, HOMA% β-cell, Insulin Sensitivity Index and Insulinogenic Index in ALMS patients and controls
Alström subjects are indicated by white bars, control subjects by black bars. Values of HOMA-IR (a), HOMA-βcell (b), Insulin Sensitivity Index (c) and Insulin ogenic Index (d) are reported as median ±SEM. * P< 0,05); ** P< 0,01
NIH-PA Author Manuscript
NIH-PA Author Manuscript
Figure 3. Hepatic and lipid profile in ALMS patients
Hepatic (a) and lipid (b) profile in ALMS patients considered by three different classes of age: <7 y (white bars), 7-18 y (dashed bars), > 18 y (black bars). Values are expressed as mean ± SEM. The dotted lines (a) indicate the upper limit of normal values of patients < 7 y, the dashed lines (a, b) indicate the upper limit for normal values of patients > 7 y. AST, aspartate aminotransferase; ALT, alanine aminotransferase; gGT, gamma glutamyl
transpeptidase; TOT-C, total cholesterol; HDL-C, high density lipoprotein-cholesterol; TG, triglycerides; LDL-C, low density lipoprotein-cholesterol.
NIH-PA Author Manuscript
NIH-PA Author Manuscript
NIH-PA Author Manuscript
NIH-PA Author Manuscript
NIH-PA Author Manuscript
Table 1
Genetic and clinical features of ALMS population
Patient # 1 2 3 4 5 6 7 8 9 10 11 12 13 14 15 Age 3 5 6 7 8 13 21 27 29 29 32 41 42 43 51 Sex M M F M F F M F M F M M F M F Mutation ALMS1 ex 8 ex 8,16 ex 8 ex 8,16 ex 8 ex 10 ex 10,12 ex 8,16 ex 8 ex 8,16 ex 8,16 ex 8 ex 10 ex 8 ex 8 Weight (kg) 19,8 36,7 37,5 46,2 36,5 53 82 54,7 66 74,5 83,5 73 47 69,9 60,5 BMI (kg/m 2) 23,4 26,4 24 27,5 21,6 26,7 25 25 25,8 30,65 31,8 28,5 21,7 26,6 28 Height (cm) 92 118 125 130 130 141 181 148 160 156 162 160 147 162 147 Glucose metabolism N N N N N N IGT IGT N N DM IGT DM IGT N Dyslipidemia / / / Yes Yes Yes / Yes Yes Yes Yes Yes Yes Yes Yes Dilatated cardiomyopathy / / / / Yes Yes * Yes / / / / / / Yes * Yes * Renal dysfunction ** / / / / / Yes Yes / / / Yes / Yes Yes Yes Liver dysfunction *** / / / / / / Yes Yes / Yes Yes / Yes Yes / Pulmonary disease **** Yes / / / Yes Yes Yes Yes / / / / / / Yes Retinal dystrophy Yes Yes Yes Yes Yes Yes Yes Yes Yes Yes Yes Yes Yes Yes Yes Hearing impairment / / Yes / / Yes Yes Yes Yes Yes Yes Yes Yes Yes Yes Hyothyroidism / / / / / Yes Yes Yes / Yes / / / / / GH-deficiency / / / / / Yes / Yes / / / Yes Yes / / Hypogonadism / / / / / / Yes / Yes / Yes / / / / Orthopedic disease ***** / Yes Yes Yes / Yes Yes Yes / / Yes Yes Yes / /
N= normal glucose tolerance; IGT= impaired glucose tolerance; DM= Type 2 diabetes mellitus * restrictive cardiomyopathy; **
microalbuminuria and elevation of BUN and creatinine in two different samples;
***
AST and ALT mild elevation (less than two fold increased);
****
relapsing bronchitis;
*****
NIH-PA Author Manuscript
NIH-PA Author Manuscript
NIH-PA Author Manuscript
Table 2
Number of observations for metabolic investigations Patient # ≤ 6 yrs (3-6 y) 7-18 yrs (8-18 y) >18 yrs (19-51 y)
1 X 2 X 3 X 4 X 5 X 6 X 7 XX X 8 XXX 9 X 10 X X 11 X XX 12 X X 13 X 14 X 15 XXX tot patients 5 5 9 tot observations 5 6 14
NIH-PA Author Manuscript
NIH-PA Author Manuscript
NIH-PA Author Manuscript
Table 3
Correlation of the anthropometric parameters with age
Whole group Males Females h SDS r= -0,554 p= 0,0001 r= -0,64 p= 0,0001 r= -0,41 p=0,03 w SDS r= -0,43 p=0,001 r= -0,64 p= 0,0002 r= -0,17 p= ns BMI SDS r= -0,36 p= 0,006 r= -0,6 p= 0,0005 r= -0,12 p= ns FM% r= -0,26 p= ns r= -0,67 p=0,006 r= 0,20 p= ns FFM% r= 0,26 p= ns r= 0,67 p=0,006 r= -0,20 p= ns