IFAC PapersOnLine 53-2 (2020) 16581–16586
ScienceDirect
ScienceDirect
2405-8963 Copyright © 2020 The Authors. This is an open access article under the CC BY-NC-ND license.
Peer review under responsibility of International Federation of Automatic Control. 10.1016/j.ifacol.2020.12.784
Copyright © 2020 The Authors. This is an open access article under the CC BY-NC-ND license (http://creativecommons.org/licenses/by-nc-nd/4.0)
Vehicle fleet electrification: impacts on energy demand, air quality and GHG
emissions. An integrated assessment approach
De Angelis, E. * Turrini, E. * Carnevale, C.* Volta, M. *
*Department of Mechanical and Industrial Engineering, University of Brescia, via Branze, 38, 25123 Brescia, Italy (e-mail: [email protected])
Abstract: Transport sector is responsible for 25% of European GHG emissions, furthermore it has high impacts on air pollution at various scales. Electric mobility is growing fast and it could be effective in reducing road transport GHGs and pollutant emissions, but its potential depends on the energy mix used to produce electricity. In this paper an Integrated Assessment Model is proposed to analyze the energetic transition to an electric vehicle fleet at regional scale. Two scenarios are proposed to assess at the same time which are the impacts of the electric power sources and of the reduced road transport emissions. Results are presented in terms of CO2 emissions, air quality indexes, energy savings and health impacts.
Keywords: Integrated Assessment Modelling, Environmental decision support systems, Air quality
planning and control, Impact evaluation
1. INTRODUCTION
Air pollution and climate change are two among the main environmental problems that our society is facing. The World Health Organization estimates 4.2 million/yr premature deaths worldwide due to high pollutant concentrations exposure (WHO, 2015). The links between air pollution and climate change have been widely studied and the mitigation of air pollution can have positive effects also on climate if policies are defined in a win-win perspective (von Schneidemesser et
al., 2015; Maione et al., 2016).
Around 25% of EU’s greenhouse gases (GHG) emissions come from the transport sector and even if in the past decades data showed a decrease of total European CO2 emissions in most sectors, road transport is an exception with GHG emissions being 26.1% (2016) higher with respect to 1990 (European Environment Agency, 2018b). Therefore, to meet the Paris Agreement targets (limiting the global warming to 2° C) a rapid decarbonization of transport sector is required (European Commission, 2016). Besides this, vehicles are also an important source of air pollutants, especially nitrogen dioxide and particulate matter, that have impacts at local and regional scale (Pirovano et al., 2015). Vehicle fleet emissions can be reduced through technological improvements (e.g. introduction of EURO emission standards, reduction in the average fleet weight (Cecchel et al., 2018)) or implementing behavioral measures (e.g. lower speed on highways, soft mobility (Carnevale et al., 2018)). Electric vehicles can be a key component of European mobility strategies, in fact electric mobility is growing fast: in 2018 the global electric car fleet was around 5.2 million units and Europe is the second largest electric car market (International Energy Agency, 2019). Studies have been made to assess the potential impact of
vehicle fleet electrification at European scale, for example Höltl, Macharis and De Brucker, 2017 applied a backcasting approach to identify energy efficiency technologies and CO2 emission reductions that are needed to reach the EU targets for road transport sector. Pautasso, Osella and Caroleo, 2019, defined a modelling approach (integrating LCA analysis and scenario analysis) for the evaluation of environmental, social, and economic impacts at regional scale. Fernández, 2019 defined a set of indicators to help policymakers in designing strategies towards electromobility.
If the adoption of electric vehicles will become widespread, problems could rise in the increase of energy demand. The charging of an electric vehicle requires for additional distribution capacity, especially during peak loads. Therefore, energy demand management is also a topic under study (Said,
Cherkaoui and Khoukhi, 2015).
This study doesn’t take into account the scheduling protocols aimed at managing the increased energy demand but focuses on the energy mix used to produce electricity and the resulting emission variations. In fact, vehicle fleet electrification can have a large potential on GHG and pollutant emission reduction, but it is strongly related to the energy sources used. In Europe, the Renewable Energy Sources (RES) account for the 29% of the electricity production and in 2017 the most important RES in the EU-28 were wood and other solid biofuels (European Environment Agency, 2018a), that can have a detrimental impact on air quality, especially on particulate matter (PM) concentrations, although their GHG emissions are low.
The definition of policies for PM concentration reduction is a complex task because of its secondary component and the non-linear processes of accumulation, transport and diffusion.
Furthermore, policy makers need support in the evaluation of the costs and savings that an emission abatement policy can ensure in the long term. Savings can result from a reduction in fuel consumption or a substitution of a fuel with a more efficient one (energy savings). Savings can also come from health impacts, as a reduction in costs due to a reduced population exposure to high PM concentrations. Integrated Assessment Models (Guariso, Maione and Volta, 2016; Thunis et al., 2016)are addressed to environmental authorities that need to design effective air quality plans to reduce the concentrations of atmospheric pollutants. In this work, the Multi-scale Air Quality (MAQ) system has been used (Turrini
et al., 2018). MAQ model supports the decision makers in
assessing costs and impacts due to the adoption of different emission abatement strategies and it allows the evaluation of co-benefits on health impacts and GHG emissions linked to the energy transition, such as the vehicle fleet electrification. The model can perform both optimization approach (multi-objective or cost-effectiveness optimization (Carnevale et al., 2014)) and scenario analysis.
In this paper scenario analysis of vehicle fleet electrification is performed considering two different energy sources mixes. Impacts in terms of GHG emissions, air quality, health and energy savings are discussed. In section 2 the MAQ model is described and the methodology used, the scenario analysis, is formalized. Furthermore, it is reported the computation of the health impacts and external costs according to the ExternE methodology (European Commission, 2005). In section 3 the case study set up and the assumptions made to define the future scenarios are also explained and the methodology presented is tested on Lombardy Region, a highly polluted area in Northern Italy. In section 4 conclusions and further developments of this study are reported.
2. METHODOLOGY
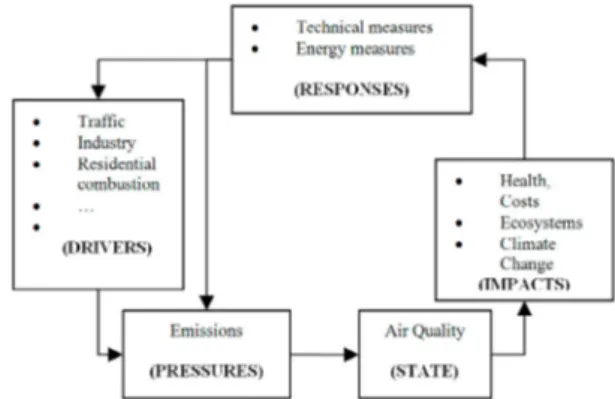
MAQ model is a decision support systems (DSS) oriented to regional decision makers, often in the need to select air quality control policies with economic constraints and to evaluate impacts on human health and greenhouse gas emissions. The methodology implemented can be interpreted starting from the DPSIR scheme (Drivers-Pressures-State-Impacts-Responses), adopted by the EU (EEA, 1999) as presented in Fig.1.
MAQ allows both optimization and scenario analysis approach. It defines the emission abatement measures (RESPONSES) that directly affect human activities (DRIVERS), reducing emissions (PRESSURES). Modification in air quality (STATE) leads to a variation of IMPACTS.
In this study MAQ is not used in optimization mode, but a scenario analysis is implemented, defining a priori the policy (vehicle fleet electrification).
In the scenario analysis the variation of the Air Quality Indexes (e.g. PM10 and NO2 yearly average concentration) is computed applying a set of a priori defined decision variables Θ. The problem is formalized as follows:
𝐴𝐴𝐴𝐴𝐴𝐴𝑛𝑛= 𝑓𝑓(𝐸𝐸(Θ)) 𝑤𝑤𝑤𝑤𝑤𝑤ℎ 𝑛𝑛 = 1, … , 𝑁𝑁
where Θ is the set of the feasible decision variables, meaning the entity of the emission reduction measures. The AQI dependence on Θ is defined as:
𝜕𝜕𝜕𝜕𝜕𝜕𝜕𝜕 𝜕𝜕Θ
=
𝜕𝜕𝜕𝜕𝜕𝜕𝜕𝜕 𝜕𝜕𝜕𝜕(Θ)∙
𝜕𝜕𝜕𝜕(Θ) 𝜕𝜕ΘThe first term of the equation 𝜕𝜕𝜕𝜕(Θ)𝜕𝜕𝜕𝜕𝜕𝜕𝜕𝜕 represents the link between emission and AQI variation. It can be computed by a deterministic Chemical Transport Model or by computationally faster surrogate models. For this work, surrogate models based on artificial neural networks are used. Details on implementation and validation for this class of models are given in (Carnevale et al., 2012).
The second term 𝜕𝜕𝜕𝜕(Θ)𝜕𝜕Θ describes the emission abatement due to the application of measures. The emission abatement measures can be end-of-pipe measures (𝛾𝛾), energy efficiency measures (𝜓𝜓) or switch measures (𝜙𝜙). End-of-pipe technologies reduce the pollutant emission before it is released in atmosphere without changes in fuel consumption; energy efficiency measures reduce the level of activity and therefore fuel use; switch measures replace part of an activity with a more efficient one.
The reduced emission of a pollutant 𝑝𝑝 in the cell 𝑑𝑑 is computed as: 𝐸𝐸(Θ)𝑑𝑑𝑝𝑝= ∑ 𝐴𝐴𝐴𝐴𝑘𝑘∙ 𝑒𝑒𝑓𝑓𝑘𝑘𝑝𝑝(1 − (∑ 𝜙𝜙𝑠𝑠 𝑠𝑠∈𝑆𝑆𝑘𝑘 + ∑ 𝜓𝜓𝑓𝑓 𝑓𝑓∈𝐹𝐹𝑘𝑘 )) ∙ (1 − ∑ 𝑟𝑟𝑒𝑒𝑡𝑡𝑝𝑝∙ 𝛾𝛾𝑡𝑡 𝑡𝑡∈𝑇𝑇𝑘𝑘 ) 𝑘𝑘
where 𝛾𝛾, 𝜓𝜓 and 𝜙𝜙 are the application rates of respectively end-of-pipe, energy efficiency and switch measures. 𝑒𝑒𝑓𝑓𝑘𝑘𝑝𝑝 is the emission factor of the pollutant 𝑝𝑝 for the activity 𝑘𝑘 and 𝑟𝑟𝑒𝑒𝑡𝑡𝑝𝑝 is the removal efficiency of the end-of-pipe technology 𝑤𝑤. 𝐴𝐴𝐴𝐴𝑘𝑘 is the activity level of the activity 𝑘𝑘. Emissions are computed for greenhouse gases in terms of equivalent CO2 and for the air pollution precursors: nitrogen oxides (NOx), volatile organic compounds (VOC), ammonia (NH3), primary particulate matter (PM2.5 and PM10) and sulphur dioxide (SO2).
Detailed information about the MAQ model methodology can be found in (Turrini et al., 2018).
Fig. 1: DPSIR Scheme for adopted in the MAQ system. The decision support system estimates also the health impacts and external costs caused by exposure to PM10 concentrations (particulate matter with an aerodynamic diameter smaller than 10 μm). The health impacts evaluation is computed applying
Furthermore, policy makers need support in the evaluation of the costs and savings that an emission abatement policy can ensure in the long term. Savings can result from a reduction in fuel consumption or a substitution of a fuel with a more efficient one (energy savings). Savings can also come from health impacts, as a reduction in costs due to a reduced population exposure to high PM concentrations. Integrated Assessment Models (Guariso, Maione and Volta, 2016; Thunis et al., 2016)are addressed to environmental authorities that need to design effective air quality plans to reduce the concentrations of atmospheric pollutants. In this work, the Multi-scale Air Quality (MAQ) system has been used (Turrini
et al., 2018). MAQ model supports the decision makers in
assessing costs and impacts due to the adoption of different emission abatement strategies and it allows the evaluation of co-benefits on health impacts and GHG emissions linked to the energy transition, such as the vehicle fleet electrification. The model can perform both optimization approach (multi-objective or cost-effectiveness optimization (Carnevale et al., 2014)) and scenario analysis.
In this paper scenario analysis of vehicle fleet electrification is performed considering two different energy sources mixes. Impacts in terms of GHG emissions, air quality, health and energy savings are discussed. In section 2 the MAQ model is described and the methodology used, the scenario analysis, is formalized. Furthermore, it is reported the computation of the health impacts and external costs according to the ExternE methodology (European Commission, 2005). In section 3 the case study set up and the assumptions made to define the future scenarios are also explained and the methodology presented is tested on Lombardy Region, a highly polluted area in Northern Italy. In section 4 conclusions and further developments of this study are reported.
2. METHODOLOGY
MAQ model is a decision support systems (DSS) oriented to regional decision makers, often in the need to select air quality control policies with economic constraints and to evaluate impacts on human health and greenhouse gas emissions. The methodology implemented can be interpreted starting from the DPSIR scheme (Drivers-Pressures-State-Impacts-Responses), adopted by the EU (EEA, 1999) as presented in Fig.1.
MAQ allows both optimization and scenario analysis approach. It defines the emission abatement measures (RESPONSES) that directly affect human activities (DRIVERS), reducing emissions (PRESSURES). Modification in air quality (STATE) leads to a variation of IMPACTS.
In this study MAQ is not used in optimization mode, but a scenario analysis is implemented, defining a priori the policy (vehicle fleet electrification).
In the scenario analysis the variation of the Air Quality Indexes (e.g. PM10 and NO2 yearly average concentration) is computed applying a set of a priori defined decision variables Θ. The problem is formalized as follows:
𝐴𝐴𝐴𝐴𝐴𝐴𝑛𝑛= 𝑓𝑓(𝐸𝐸(Θ)) 𝑤𝑤𝑤𝑤𝑤𝑤ℎ 𝑛𝑛 = 1, … , 𝑁𝑁
where Θ is the set of the feasible decision variables, meaning the entity of the emission reduction measures. The AQI dependence on Θ is defined as:
𝜕𝜕𝜕𝜕𝜕𝜕𝜕𝜕 𝜕𝜕Θ
=
𝜕𝜕𝜕𝜕𝜕𝜕𝜕𝜕 𝜕𝜕𝜕𝜕(Θ)∙
𝜕𝜕𝜕𝜕(Θ) 𝜕𝜕ΘThe first term of the equation 𝜕𝜕𝜕𝜕(Θ)𝜕𝜕𝜕𝜕𝜕𝜕𝜕𝜕 represents the link between emission and AQI variation. It can be computed by a deterministic Chemical Transport Model or by computationally faster surrogate models. For this work, surrogate models based on artificial neural networks are used. Details on implementation and validation for this class of models are given in (Carnevale et al., 2012).
The second term 𝜕𝜕𝜕𝜕(Θ)𝜕𝜕Θ describes the emission abatement due to the application of measures. The emission abatement measures can be end-of-pipe measures (𝛾𝛾), energy efficiency measures (𝜓𝜓) or switch measures (𝜙𝜙). End-of-pipe technologies reduce the pollutant emission before it is released in atmosphere without changes in fuel consumption; energy efficiency measures reduce the level of activity and therefore fuel use; switch measures replace part of an activity with a more efficient one.
The reduced emission of a pollutant 𝑝𝑝 in the cell 𝑑𝑑 is computed as: 𝐸𝐸(Θ)𝑑𝑑𝑝𝑝= ∑ 𝐴𝐴𝐴𝐴𝑘𝑘∙ 𝑒𝑒𝑓𝑓𝑘𝑘𝑝𝑝(1 − (∑ 𝜙𝜙𝑠𝑠 𝑠𝑠∈𝑆𝑆𝑘𝑘 + ∑ 𝜓𝜓𝑓𝑓 𝑓𝑓∈𝐹𝐹𝑘𝑘 )) ∙ (1 − ∑ 𝑟𝑟𝑒𝑒𝑡𝑡𝑝𝑝∙ 𝛾𝛾𝑡𝑡 𝑡𝑡∈𝑇𝑇𝑘𝑘 ) 𝑘𝑘
where 𝛾𝛾, 𝜓𝜓 and 𝜙𝜙 are the application rates of respectively end-of-pipe, energy efficiency and switch measures. 𝑒𝑒𝑓𝑓𝑘𝑘𝑝𝑝 is the emission factor of the pollutant 𝑝𝑝 for the activity 𝑘𝑘 and 𝑟𝑟𝑒𝑒𝑡𝑡𝑝𝑝 is the removal efficiency of the end-of-pipe technology 𝑤𝑤. 𝐴𝐴𝐴𝐴𝑘𝑘 is the activity level of the activity 𝑘𝑘. Emissions are computed for greenhouse gases in terms of equivalent CO2 and for the air pollution precursors: nitrogen oxides (NOx), volatile organic compounds (VOC), ammonia (NH3), primary particulate matter (PM2.5 and PM10) and sulphur dioxide (SO2).
Detailed information about the MAQ model methodology can be found in (Turrini et al., 2018).
Fig. 1: DPSIR Scheme for adopted in the MAQ system. The decision support system estimates also the health impacts and external costs caused by exposure to PM10 concentrations (particulate matter with an aerodynamic diameter smaller than 10 μm). The health impacts evaluation is computed applying
the ExternE procedure (European Commission, 2005) and using concentration-response relations and economic values given by (Friederich, 2004).
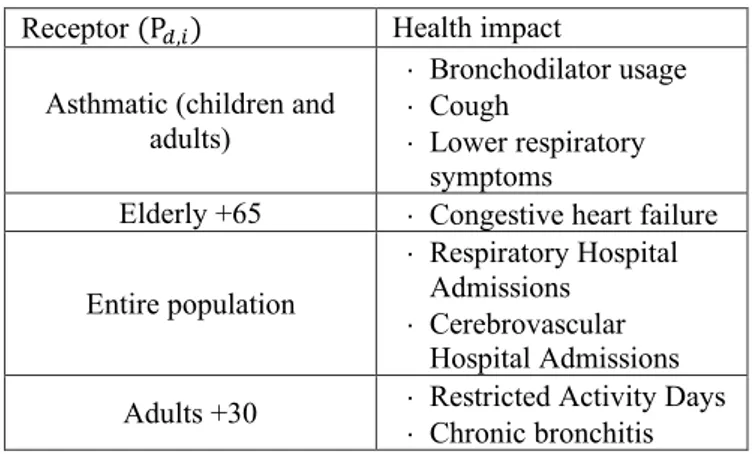
The health impact indicator hi is computed for each cell of the domain multiplying the AQI by the slope of the concentration-response function of the i-th health impact indicator and the population exposed, that depends on the selected health impact, as shown in Table 1.
hi,d= sCRFi∙ P𝑖𝑖,𝑑𝑑∙ Xd
Table 1: Receptor exposed to each analysed morbidity impact Receptor (P𝑑𝑑,𝑖𝑖) Health impact
Asthmatic (children and adults)
Bronchodilator usage Cough
Lower respiratory symptoms
Elderly +65 Congestive heart failure Entire population
Respiratory Hospital Admissions
Cerebrovascular Hospital Admissions Adults +30 Restricted Activity Days Chronic bronchitis where:
• sCRFi is the dose-response function coefficient of the health impact 𝑖𝑖 related to PM10 long term exposure;
• P𝑑𝑑,𝑖𝑖 is the population exposed to health impact 𝑖𝑖 in the
domain cell 𝑑𝑑;
• Xd is the average annual concentration of PM10 in the domain cell 𝑑𝑑.
External costs related to health impacts are computed separately for morbidity and mortality (expressed in Years of Life Lost, YOLL).
Morbidity costs MC for the domain is computed as: MC = ∑ ∑ ℎ𝑖𝑖
𝑖𝑖 𝑑𝑑
∙ 𝑒𝑒𝑣𝑣𝑖𝑖
Mortality cost YC is computed as: YC = ∑ 𝑌𝑌𝑌𝑌𝑌𝑌𝑌𝑌𝑑𝑑 𝑑𝑑∙ 𝑒𝑒𝑣𝑣𝑦𝑦𝑦𝑦𝑦𝑦𝑦𝑦
where ev is the economic value associated to the health impact indictor. 𝑒𝑒𝑣𝑣𝑦𝑦𝑦𝑦𝑦𝑦𝑦𝑦 is assumed equal to 50000 €2000/YOLL.
3. RESULTS AND DISCUSSION
1.1 Scenario set-up and results analysis
The MAQ model, is applied to a case study on Lombardy region (Northern Italy). Lombardy is located in the Po valley, one of the most polluted areas in the European continent. The MAQ model domain is composed by 5890 cell 6x6 km2.
Emission reductions due to the application of the fleet electrification are applied in the Northern Italy domain, impacts are evaluated only in Lombardy region as shown in Fig. 2.
Fig. 2: MAQ model domain, scenario analysis results are evaluated over Lombardy region (pink cells). The policy is applied in the whole Northern Italy (green cells)
In this work, the electrification of the vehicle fleet (including cars, light duty vehicles and buses) is studied in order to understand how much the electric energy demand will increase and which are the impacts considering the regional energy production sources. The basecase scenario is the Current LEgislation scenario of 2020 (CLE2020), that is the application of European, national and regional regulation in terms of emission control. Moreover, the basecase describes the electric energy production sources. Data provided by the Region (Regione Lombardia, 2018) show that in Lombardy electric energy is produced by fossil fuels, mainly natural gas (61.5%), by Renewable Energy Sources (RES) for 20.8% and the remaining 17.7% is imported (Fig. 3). In the future (CLE2030), according to the EU Energy & Climate framework, RES share will increase to 30% of the production. The electrification scenarios are built under three hypotheses: 1. The RES production is 30% of the total energy
production, and the distribution of electric power production over the available sources within the region is as shown in Fig. 4.
2. The total amount of energy produced within the Region is equal to CLE 2020 scenario;
3. The percentage of imported electric power remain constant (17.7%), meaning that the amount of imported energy will increase due to energy demand for the vehicle fleet electrification.
Two electric vehicles scenarios are defined. In both cases the whole vehicles fleet (excluding only heavy-duty vehicles and motorcycles) becomes electric. In the first scenario (Electric vehicles - RES) the surplus in energy demand is equally distributed on all the sources (RES, fossil fuels, imported energy). Renewable Energy Sources include hydroelectric and photovoltaic production that has no emission. In the second case (Electric vehicles - GAS) the energy needed for the electrification is produced with natural gas only. According to the formalization explained in the Methodology section, the definition of the scenarios can be computed considering the
variation in Activity Level (AL) of road transport CORINAIR macrosector (M7) and combustion in energy and transformation industries CORINAIR macrosector (M1) (European Environment Agency, 2016).
Fig. 3: Electric power production in Lombardy – CLE2020
Fig. 4: Electric power production in Lombardy - CLE2030 The increase of power production (Δ𝐴𝐴𝐴𝐴𝑀𝑀1) is computed starting from the AL reduction in each modified sector-activity in the road transport macrosector, which is added to the energy already produced (𝐴𝐴𝐴𝐴𝑝𝑝𝑝𝑝), considering the efficiencies of both the vehicle engine and the energy distribution and production: Δ𝐴𝐴𝐴𝐴𝑀𝑀7= ∑ ∑ 𝐴𝐴𝐴𝐴𝑠𝑠,𝑘𝑘∙ 𝜂𝜂𝑠𝑠,𝑘𝑘
𝑘𝑘 𝑠𝑠
𝐴𝐴𝐴𝐴𝑀𝑀1= 𝐴𝐴𝐴𝐴𝑝𝑝𝑝𝑝+Δ𝐴𝐴𝐴𝐴𝜂𝜂𝑀𝑀7 𝑒𝑒
where 𝜂𝜂𝑠𝑠,𝑘𝑘 is the internal combustion engines efficiency for each sector-activity s,k, reported in Table 2 (sectors: urban, extraurban and highways transport; activity: natural gas, LPG, diesel, gasoline). 𝜂𝜂𝑒𝑒 includes the electric vehicle efficiency (Table 2) and the electric energy distribution and production efficiency, that is equal to 0.46, according to the Italian authority for electricity and gas (ARERA, 2008).
The resulting activity levels in PJ are reported in Table 3. Table 2: Vehicle efficiency
Type of vehicle η
Electric vehicle 0.9 Diesel vehicles 0.4 Gasoline vehicles 0.3
LPG vehicles 0.3
Natural gas vehicles 0.3
Table 3: Activity levels in M1 and M7 for each scenario [PJ]
Macrosector CLE2020 Electric vehicles - RES Electric vehicles - GAS Combustion in energy and transformation industries 429.0 553.5 553.5 Road transport 227.3 39.5 39.5 The percentage emission variation (computed as ∆𝐸𝐸%=
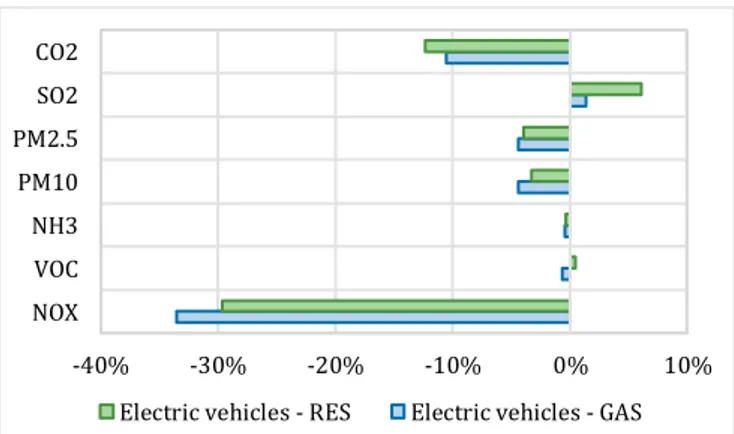
(𝐸𝐸𝑠𝑠𝑠𝑠𝑒𝑒𝑠𝑠− 𝐸𝐸2020)100/𝐸𝐸2020) in Fig. 5 shows a decrease in
NOx emissions due to reduction in internal combustion engine vehicles, especially diesel cars and LDV. Producing the electric vehicles energy with RES also means an increase in the use of biomass and waste. These have higher emission factors for PM, VOC and SO2 with respect to natural gas, therefore emissions are higher. On the other hand, the use of biomass and waste causes a lower equivalent CO2 emission (Table 4).
Fig. 5: Percentage emission variation with respect to 2020 Based on the emission variation, impacts on air quality in terms of PM10 and NO2 concentrations can be studied. Results are reported in Table 5 and concentration maps are shown in Fig. 6. Higher impacts are visible on NO2 concentrations where there is a spatial average reduction of 2.9 and 3.5 µg/m3. The metropolitan area of Milan is estimated to
be affected by poor air quality, mainly because of intense emissions in the residential heating sector, which is overlooked in the abatement strategies analyzed in this work.
Table 4: Emission in kt/yr for each scenario
CLE2020 Electric vehicles - RES Electric vehicles - GAS NOx 103.4 72.8 68.8 VOC 214.5 215.5 213.1 NH3 101.7 101.3 101.2 PM10 14.2 13.8 13.6 PM2.5 12.6 12.1 11.9 7.5% 1.5% 10.9% 0.8% 61.5% 17.7% Hydroelectric Photovoltaic Biomass Waste Fossil fuels Electric power import
9.5% 1.9% 13.8% 1.1% 56.0% 17.7% Hydroelectric Photovoltaic Biomass Waste Fossil fuels Electric power import
-40% -30% -20% -10% 0% 10% NOX VOC NH3 PM10 PM2.5 SO2 CO2
variation in Activity Level (AL) of road transport CORINAIR macrosector (M7) and combustion in energy and transformation industries CORINAIR macrosector (M1) (European Environment Agency, 2016).
Fig. 3: Electric power production in Lombardy – CLE2020
Fig. 4: Electric power production in Lombardy - CLE2030 The increase of power production (Δ𝐴𝐴𝐴𝐴𝑀𝑀1) is computed starting from the AL reduction in each modified sector-activity in the road transport macrosector, which is added to the energy already produced (𝐴𝐴𝐴𝐴𝑝𝑝𝑝𝑝), considering the efficiencies of both the vehicle engine and the energy distribution and production: Δ𝐴𝐴𝐴𝐴𝑀𝑀7= ∑ ∑ 𝐴𝐴𝐴𝐴𝑠𝑠,𝑘𝑘∙ 𝜂𝜂𝑠𝑠,𝑘𝑘
𝑘𝑘 𝑠𝑠
𝐴𝐴𝐴𝐴𝑀𝑀1= 𝐴𝐴𝐴𝐴𝑝𝑝𝑝𝑝+Δ𝐴𝐴𝐴𝐴𝜂𝜂𝑀𝑀7 𝑒𝑒
where 𝜂𝜂𝑠𝑠,𝑘𝑘 is the internal combustion engines efficiency for each sector-activity s,k, reported in Table 2 (sectors: urban, extraurban and highways transport; activity: natural gas, LPG, diesel, gasoline). 𝜂𝜂𝑒𝑒 includes the electric vehicle efficiency (Table 2) and the electric energy distribution and production efficiency, that is equal to 0.46, according to the Italian authority for electricity and gas (ARERA, 2008).
The resulting activity levels in PJ are reported in Table 3. Table 2: Vehicle efficiency
Type of vehicle η
Electric vehicle 0.9 Diesel vehicles 0.4 Gasoline vehicles 0.3
LPG vehicles 0.3
Natural gas vehicles 0.3
Table 3: Activity levels in M1 and M7 for each scenario [PJ]
Macrosector CLE2020 Electric vehicles - RES Electric vehicles - GAS Combustion in energy and transformation industries 429.0 553.5 553.5 Road transport 227.3 39.5 39.5 The percentage emission variation (computed as ∆𝐸𝐸%=
(𝐸𝐸𝑠𝑠𝑠𝑠𝑒𝑒𝑠𝑠− 𝐸𝐸2020)100/𝐸𝐸2020) in Fig. 5 shows a decrease in
NOx emissions due to reduction in internal combustion engine vehicles, especially diesel cars and LDV. Producing the electric vehicles energy with RES also means an increase in the use of biomass and waste. These have higher emission factors for PM, VOC and SO2 with respect to natural gas, therefore emissions are higher. On the other hand, the use of biomass and waste causes a lower equivalent CO2 emission (Table 4).
Fig. 5: Percentage emission variation with respect to 2020 Based on the emission variation, impacts on air quality in terms of PM10 and NO2 concentrations can be studied. Results are reported in Table 5 and concentration maps are shown in Fig. 6. Higher impacts are visible on NO2 concentrations where there is a spatial average reduction of 2.9 and 3.5 µg/m3. The metropolitan area of Milan is estimated to
be affected by poor air quality, mainly because of intense emissions in the residential heating sector, which is overlooked in the abatement strategies analyzed in this work.
Table 4: Emission in kt/yr for each scenario
CLE2020 Electric vehicles - RES Electric vehicles - GAS NOx 103.4 72.8 68.8 VOC 214.5 215.5 213.1 NH3 101.7 101.3 101.2 PM10 14.2 13.8 13.6 PM2.5 12.6 12.1 11.9 7.5% 1.5% 10.9% 0.8% 61.5% 17.7% Hydroelectric Photovoltaic Biomass Waste Fossil fuels Electric power import
9.5% 1.9% 13.8% 1.1% 56.0% 17.7% Hydroelectric Photovoltaic Biomass Waste Fossil fuels Electric power import
-40% -30% -20% -10% 0% 10% NOX VOC NH3 PM10 PM2.5 SO2 CO2
Electric vehicles - RES Electric vehicles - GAS
CLE2020 Electric vehicles - RES Electric vehicles - GAS SO2 10.3 10.9 10.4 CO2 79501 69693 71112 In Table 6, energy savings with respect to CLE2020 are shown for M1, where there is an increase of production, resulting in a rise in fuel consumption and for M7, where 83% of the activities are shifted towards M1. Energy savings depend on electric power production: the RES scenario has higher savings because part of the demand is covered by photovoltaic and hydroelectric sources, which have no direct emissions. The first scenario has lower health savings (3.6% with respect to the basecase, while the GAS scenario is 4.0%) because PM yearly average concentration is slightly higher if compared to the GAS scenario. Morbidity and mortality costs due to PM10 concentration exposure are also reported in Table 4.
Table 5: Impacts on air quality, in terms of PM10 and NO2 yearly average concentration
Scenario PM10 [μg/m3] NO2 [μg/m3] CLE2020 20.37 23.90 Electric vehicles - RES 19.65 19.58 Electric vehicles - GAS 19.57 18.76
Table 6: Costs (-) and savings (+) due to fuel consumption variation (energy) and health impacts [M€/yr]
Electric vehicles - RES Electric vehicles - GAS Energy savings MS1 -1019 -1257 MS7 +5236 +5236 Health savings +215 +233
Fig. 6: PM10 [µg/m3] and NO2 [µg/m3] concentration maps for each analysed scenario
4. CONCLUSIONS
The steps and details for the complete fleet electrification are still uncertain: the electric vehicles scenarios proposed in this work are artificial projections aimed at understanding the importance of developing alternative electric power sources. The use of RES is still limited, furthermore, they include biomass and waste emitting less CO2 with respect to natural gas but more PM, VOC and SO2. This contributes to stress the importance of tools that allow energetic transition analyses and help in the definition of win-win mitigation policies for air quality and climate change.
An Integrated Assessment methodology based on MAQ system is proposed in this paper to compute energy demand, impacts on air quality and human health, cost and energy savings. The MAQ system allows to evaluate the energy variation in the different sector-activities and therefore to compute emission and impacts. The results show, for both scenarios, a reduction in average concentrations of PM10 and NO2 as well as an improvement in CO2 emission reduction and health and energy savings, with the former that is higher in the scenario switching the energy production to natural gas and the latter higher if the switch includes renewable sources. Further developments of this study can analyse different electricity production sources and implement several energy projections. Furthermore, a cost analysis of the electric fleet implementation, not only of the fuel savings, can be explored.
ACKNOLEWGEMENTS
This paper is based on the activities carried out within the ATHLETIC H&W project, University of Brescia.
PM10 C LE 2 0 2 0 NO2 E le ctr ic V ehi cl es -R E S E lec tr ic V ehi cl es -G A S
REFERENCES
ARERA (2008) ARERA - Aggiornamento del fattore di
conversione dei kWh in tonnellate equivalenti di petrolio connesso al meccanismo dei titoli di efficienza energetica.
Available at: https://www.arera.it/it/docs/08/003-08een.htm (Accessed: 14 November 2019).
Carnevale, C. et al. (2012) ‘Surrogate models to compute optimal air quality planning policies at a regional scale’,
Environmental Modelling and Software. Elsevier Ltd, 34, pp.
44–50.
Carnevale, C. et al. (2014) ‘Exploring trade-offs between air pollutants through an Integrated Assessment Model’, Science
of the Total Environment. Elsevier B.V., 481(1), pp. 7–16.
Carnevale, C. et al. (2018) ‘Evaluating economic and health impacts of active mobility through an integrated assessment model’, IFAC-PapersOnLine. Elsevier, 51(5), pp. 49–54. Cecchel, S. et al. (2018) ‘Impact of reduced mass of light commercial vehicles on fuel consumption, CO2 emissions, air quality, and socio-economic costs’, Science of the Total
Environment. Elsevier B.V., 613–614, pp. 409–417.
EEA (1999) ‘Environmental indicators : Typology and overview’, European Environment Agency, 25(25), p. 19. European Commission (2005) ExternE Externalities of
Energy; Methodology 2005 Update, Reproduction.
European Commission (2016) The Road from Paris:
assessing the implications of the Paris Agreement and accompanying the proposal for a Council decision on the signing, on behalf of the European Union, of the Paris agreement adopted under the United Nations Framework Convention on Cl.
European Environment Agency (2016) EMEP/EEA air
pollutant emission inventory guidebook 2016.
European Environment Agency (2018a) Indicator Assessment
| Data and maps Overview of electricity production and use in Europe.
European Environment Agency (2018b) ‘Progress of EU transport sector towards its environment and climate objectives’, pp. 1–13.
Fernández, R. Á. (2019) ‘Method for assessing the
environmental benefit of road transport electrification and its influence on greenhouse gas inventories’, Journal of Cleaner
Production. Elsevier Ltd, 218, pp. 476–485.
Friederich, R. (2004) New Elements for the Assessment of
External Costs from Energy Technologies.
Guariso, G., Maione, M. and Volta, M. (2016) ‘A decision framework for Integrated Assessment Modelling of air quality at regional and local scale’, Environmental Science &
Policy. Elsevier, 65, pp. 3–12.
Höltl, A., Macharis, C. and De Brucker, K. (2017) ‘Pathways to Decarbonise the European Car Fleet: A Scenario Analysis Using the Backcasting Approach’, Energies, 11(1), p. 20. International Energy Agency (2019) Global EV Outlook 2019
to electric mobility. Available at:
www.iea.org/publications/reports/globalevoutlook2019/. Maione, M. et al. (2016) ‘Air quality and climate change: Designing new win-win policies for Europe’, Environmental
Science and Policy. Elsevier Ltd, 65, pp. 48–57.
Pautasso, E., Osella, M. and Caroleo, B. (2019) ‘Addressing the Sustainability Issue in Smart Cities: A Comprehensive Model for Evaluating the Impacts of Electric Vehicle Diffusion’, Systems, 7(2), p. 29.
Pirovano, G. et al. (2015) ‘PM2.5 source apportionment in Lombardy (Italy): Comparison of receptor and chemistry-transport modelling results’, Atmospheric Environment. Elsevier Ltd, 106, pp. 56–70.
Regione Lombardia (2018) Produzione di Energia Elettrica -
Infrastrutture Lombarde S.p.A. Available at:
http://www.energialombardia.eu/produzione_energia_elettric a (Accessed: 14 November 2019).
Said, D., Cherkaoui, S. and Khoukhi, L. (2015) ‘Multi-priority queuing for electric vehicles charging at public supply stations with price variation’, Wireless
Communications and Mobile Computing.
von Schneidemesser, E. et al. (2015) ‘Chemistry and the Linkages between Air Quality and Climate Change’. Thunis, P. et al. (2016) ‘Overview of current regional and local scale air quality modelling practices : Assessment and planning tools in the EU’, Environmental Science and Policy. Elsevier Ltd, 65, pp. 13–21.
Turrini, E. et al. (2018) ‘A non-linear optimization programming model for air quality planning including co-benefits for GHG emissions’, Science of The Total
Environment. Elsevier, 621, pp. 980–989.
WHO (2015) Economic cost of the health impact of air
pollution in Europe: Clean air, health and wealth. Copenhagen: WHO Regional Office for Europe.