UNIVERSITÀ degli STUDI di ROMA
“TOR VERGATA”
DOTTORATO di RICERCA in
"BIOCHIMICA E BIOLOGIA MOLECOLARE”
2006/2009-XXII CICLOTESI
BIOTIN-ANANDAMIDE: A NEW TOOL
TO VISUALIZE ANANDAMIDE INSIDE
THE CELLS
Dott.ssa Chiara De Simone
Docente Guida prof. Alessandro Finazzi-Agrò Correlatore prof. Mauro Maccarrone
Esaminatori proff. P Sarti, R Knight, V De Laurenzi Coordinatore prof. Alessandro Finazzi-Agrò
DIPARTIMENTO DI MEDICINA SPERIMENTALE E SCIENZE BIOCHIMICHE VIA MONTPELLIER, 1, 00133 ROMA
RIASSUNTO ……….5
ABSTRACT………..…….6
INTRODUCTION……….7
CHAPTER 1. THE ENDOCANNABINOID SYSTEM……..….12
1.1 Molecular targets………..…….12
1.2 AEA metabolism………17
1.2.1 AEA biosinthesis………17
1.2.2 AEA degradation and uptake………..18
1.3 2-AG metabolism………...23
1.3.1 2-AG biosithesis……….23
1.3.2 2-AG degradation and uptake……….24
CHAPTER 2. FLUORESCENT LIPID PROBES………27
CHAPTER 3. OBJECTIVES OF THE RESEARCH…………..30
CHAPTER 4. RESULTS………31
4.1 Characterization of b-AEA………31
4.2 Metabolism of AEA and b-AEA in HaCaT cells………..33
4.3 Inhibition assays of AEA and b-AEA………35
4.4 Immunofluorescence studies of b-AEA accumulation………..37
4.6 [3H]AEA accumulation in lipid droplets………...40
4.7 Morpho-functional overlap between LDs and FAAH………...41
4.8 Storage of [3H]AEA in adiposome-rich fractions of HaCaT cells……43
4.9 Identification of AEA-binding activity within the cytosol………45
4.10 Gel filtration and [3H]AEA-binding activity………..46
4.11 Nano-LC ESI-MS/MS identification of affinity-purified AEA binding proteins……….48
4.12 In vitro analysis of Hsp70-AEA interaction………50
4.13 Effect of Hsp70 overexpression on AEA uptake in SH-SY5Y cells...51
CHAPTER 5. DISCUSSION………..53
CHAPTER 6. EXPERIMENTAL PROCEDURES……….58
6.1 Materials………58
6.2 Cell culture and treatments………59
6.3 Biochemical analyses……….59 6.3.1 FAAH assay………...……….59 6.3.2 NAPE-PLD assay………...……….59 6.3.3 AMT assay………..60 6.3.4 DAGl assay……….60 6.3.5 MAGl assay………....60
6.3.6 Receptor binding assay………...61
6.4 Synthesis of b-AEA………...61
6.5 Western blot analyses………61
6.6 Subcellular fractionation of [3H]AEA-treated cells………..62
6.8 Fractionation by gel filtration………63
6.9 Biotin-affinity chromatography……….64
6.10 Nano-LC ESI-MS/MS……….64
6.11 [3H]AEA-binding assay by DEAE………..64
6.12 Fluorescence microscopy studies……….65
6.13 Statistical analysis………65
REFERENCES………66
SHORT CURRICULUM VITAE………..85
LIST OF PUBLICATIONS………86
RIASSUNTO
RIASSUNTO
L’endocannabinoide anandamide è un lipide neuromodulatorio non carico che è inattivato grazie al suo assorbimento cellulare e successivo catabolismo. Mentre la biosintesi e la degradazione dell’anandamide sono state chiarite in dettaglio, il meccanismo attraverso cui essa entra all’interno della cellula rimane ancora non chiaro. Vi è un generale accordo solo sul fatto che il movimento dell’anandamide attraverso la membrana plasmatica è rapido, ha una cinetica di saturazione ed è temperatura dipendente. Mentre molti sono gli studi che descrivono un assorbimento mediato da uno specifico trasportatore di questo endocannabinoide, solo pochi lavori hanno proposto che il trasporto avvenga attraverso semplice diffusione passiva o attraverso endocitosi mediata da caveolae/lipid rafts. L’unica cosa certa però ad oggi è che, la mancanza del clonaggio e dell’espressione di questa ipotetica proteina trasportatrice, ha impedito lo sviluppo di strumenti molecolari che potrebbero dare una definitiva risposta della reale presenza di un trasportatore sulla superficie cellulare. Allo stesso tempo, non sono ancora stati messi a punto analoghi dell’anandamide che ci consentano di visualizzare i suoi movimenti attraverso la membrana plasmatica e di conseguenza il suo destino all’interno della cellula.
Il nostro gruppo ha sintetizzato e caratterizzato un analogo dell’anandamide (b-AEA) che possiede la stessa lipofilia del composto madre. Abbiamo usato metodi biochimici e di microscopia impiegando la b-AEA come strumento per visualizzare l’accumulo, la distribuzione ed i movimenti intracellulari dell’anandamide.
Abbiamo scelto di modificare la testa polare della molecola poiché questo cambiamento strutturale non influenza la cinetica del trasporto. I nostri studi ci hanno consentito di chiarire la presenza di strutture intracellulari dette adiposomi, che possono accumulare anandamide e che potrebbero essere coinvolti nel suo trasporto verso la FAAH. Usando la nostra molecola biotinilata abbiamo inoltre identificato due proteine citosoliche, l’albumina e la Hsp70.2, come potenziali trasportatori che legano l’anandamide e che potrebbero formare un sistema di trasporto in grado di consentire, in modo veloce ed efficiente, il movimento dell’anandamide all’interno della cellula.
ABSTRACT
ABSTRACT
The endocannabinoid anandamide is an uncharged neuromodulatory lipid that is inactivated through its cellular uptake and subsequent catabolism. While the biosynthesis and degradation of AEA have been clarified in considerable detail, the mechanism of AEA uptake has remained elusive. There is a general consensus only on the fact that AEA movement through the plasma membrane is rapid, saturable, temperature-dependent. While many studies describe a transporter-mediated uptake of AEA via a selective “anandamide membrane transporter”, only a few papers proposed that the transport occurs by simple diffusion or endocytosis via caveolae/lipid rafts. As a matter of fact, the lack of cloning and expression of the purported transporter protein has prevented the development of molecular tools which could give definitive proof of the presence of a true transporter on the cell surface. In the same line, AEA analogs able to visualize AEA movement across the plasma membrane and its subsequent fate within the cell, are still missing.
We synthesized and characterized a biotinylated analog of AEA (biotin-AEA) that has the same lipophilicity of the parent compound. We used biochemical assays and fluorescence microscopy employing b-AEA as a tool to visualize accumulation, intracellular distribution and trafficking of AEA inside the cells. We chose to modify the polar head of AEA because this structural change does not influence the kinetics of AEA uptake. Our studies led us to clarify the presence of molecular structures, the adiposomes, as a
way to accumulate AEA and that could be involved in its delivery to FAAH. Using our biotinylated probe, we also identified two cytosolic proteins
(albumin and Hsp70.2) as potential AEA-binding carriers which might form a delivery system to rapidly and efficiently assist the intracellular trafficking of AEA.
INTRODUCTION
INTRODUCTION
In the last decades a growing interest was focused on the study of a particular family of endogenous lipids named endocannabinoids, raising the fate of an otherwise mistreated class of biomolecules.
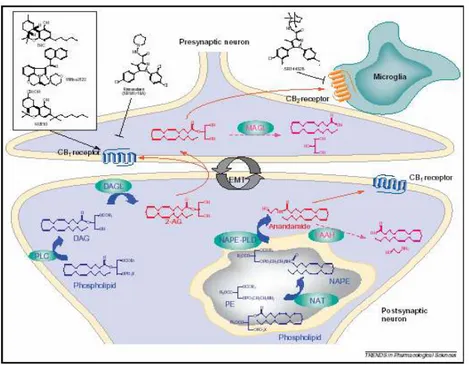
The discovery of the major psychotropic component of the preparations from Cannabis sativa, the lipophilic compound ∆9- tetrahydrocannabinol (THC) (Gaoni and Mechoulam, 1964), was not immediately followed by the molecular characterization of the corresponding receptor in the mammalian brain (Di Marzo, 2009). The stringent structural characteristics that cannabinoid compounds must possess in order to exert their psychotropic effects and the important observation that cannabinoids inhibit adenylate cyclase (Howlett and Fleming, 1984) was the strong evidence for the presence of a specific, high-affinity binding site for those lipids. More than two decades had to be waited until the first THC-specific receptor, named cannabinoid receptor type-1 (CB1), could be first identified (Devane at al., 1988) and then cloned after the screening of several previously characterized orphan G-protein-coupled receptors (GPCRs) for their affinity for THC (Matsuda et al., 1990). The second cannabinoid receptor, named CB2, identified by means of homology cloning, turned out to be rather different from CB1 both in its amino acid sequence and its localization in mammalian tissues (Munro et al., 1993).Whilst CB1 was shown to be extremely abundant in the brain, and hence suggested to be responsible for THC psychoactivity, CB2 was expressed in its highest levels in immune cells. The cloning of the cannabinoid receptors opened the way to the identification of their endogenous ligands (Fig. 1). The first endocannabinoid to be discovered was anandamide (AEA, N-arachidonoyl-ethanolamine) (Devane et al., 1992), a finding soon to be followed by the observation that an already known endogenous metabolite, 2-arachidonoyl-glycerol (2-AG), also exhibits high affinity for CB1 and CB2 receptors (Mechoulam et al., 1995; Sugiura et al., 1995). Other endocannabinoids (Fig. 2) have also been proposed during the last 10 years, including 2-arachidonyl-glycerol ether (noladin ether) (Hanus et al., 2001), N-arachidonoyl-dopamine (NADA) (Bisogno et al., 2000; Huang et al., 2002) and virodhamine (Porter et al., 2002), but their pharmacological activity
and metabolism has not yet been thoroughly investigated. Therefore, anandamide and 2-AG are still referred to as the “major” endocannabinoids. The catabolic pathways and enzymes for anandamide and 2-AG have been largely investigated and partly identified. N-Arachidonoyl-phosphatidylethanolamine (NArPE) and diacylglycerols (DAGs) with arachidonic acid on the 2-position act as the major biosynthetic precursors of anandamide (Di Marzo et al., 1994) and 2-AG (Di Marzo et al., 1996a; Bisogno et al., 1997; Stella et al., 1997), respectively. NArPE is produced from the transfer of arachidonic acid from the sn-1 position of phospholipids to the nitrogen atom of phosphatidylethanolamine (Cadas et al., 1997), whereas DAG precursors for 2-AG derive mostly from the phospholipase C-catalysed hydrolysis of phosphatidylinositol (Stella et al., 1997) and, in certain cells, from the hydrolysis of phosphatidic acid (Bisogno et al., 1999). The two endocannabinoids are inactivated essentially by enzymatic hydrolysis of their amide and ester bonds, and the major enzymes responsible for these reactions have been cloned from several mammalian species and are known as fatty acid amide hydrolase (FAAH) (Cravatt et al., 1996) and monoacylglycerol lipase (MAGL) (Karlsson et al., 1997; Dinh et al., 2002), for anandamide and 2-AG, respectively. Biosynthetic enzymes for endocannabinoids have been also cloned. Two sn-1-selective DAG lipases, named DAGL-α and DAGL-β, are responsible for 2-AG biosynthesis in cells and tissues (Bisogno et al., 2003), whereas the enzyme catalysing the direct conversion of NArPE into anandamide is known as N-acylphosphatidyl-ethanolaminespecific phospholipaseD (NAPE-PLD) (Okamoto et al., 2004). Finally, a specific process through which endocannabinoids, according to the direction of their gradient of concentrations across the plasma membrane, are either taken up by cells following cannabinoid receptor activation, or released from cells following endocannabinoid biosynthesis, has been proposed by some authors (Di Marzo et al., 1994; Beltramo et al., 1997; Beltramo and Piomelli, 2000; Bisogno et al., 2001), but not others (Glaser et al., 2003; Bracey et al., 2002). This mechanism appears to be pharmacologically distinct from FAAH or MAGL (Maione et al., 2008; Fowler and Ghafouri, 2008) or CB1 receptors (Ortega-Gutiérrez et al., 2004), although it not yet been identified from a molecular point of view. Several alternative enzymes for the biosynthesis of anandamide from NArPE, and for the inactivation of 2-AG to glycerol and arachidonic acid, have been recently proposed. Since NAPE-PLD “knock-out” mice do not exhibit reduced levels of anandamide in most tissues (Leung et al., 2006) this endocannabinoid was suggested to
be formed also from the sequential cleavage of the two sn-1 and 2- acyl groups of NArPE, catalysed by α/β-hydrolase 4, followed by the phosphodiesterase-mediated hydrolysis of glycerophosphoanandamide (Simon and Cravatt, 2006). The formation of phospho-anandamide from the hydrolysis of NArPE catalysed by phospholipase C enzyme(s), followed by its conversion into anandamide, is another possible biosynthetic route (Liu et al., 2006; Liu et al., 2008). Finally, the biosynthesis of anandamide might also occur via conversion of NArPE into 2-lyso-NArPE by a soluble form of phospholipase A2, followed by the action of a lysophospholipase D (Sun et al., 2004).
Moreover anandamide, but not 2-AG, has been found to be a ligand for transient receptor potential channel vanilloid type-1 (TRPV1) (De Petrocellis et al., 2001), supporting the involvement of cannabinoid and vanilloid receptors-indipendent pathways in various biological actions of endocannabinoids. The cannabinoid receptors, endocannabinoids and the proteins for their synthesis and inactivation constitute the “Endocannabinoid System” (ES).
Whilst the biosynthesis and degradation of AEA have been clarified in considerable detail, leading to the molecular cloning and characterization of the AEA hydrolase FAAH (McKinney and Cravatt, 2004) and of the AEA synthetase NAPE-PLD (Okamoto et al., 2004), the mechanism of AEA uptake has remained elusive, and to date a general consensus has been reached only on the fact that AEA movement through the plasma membrane is rapid, saturable, temperature-dependent, and energy (supplied as ATP or ion gradients)-independent (Battista et al., 2005; Glaser et al., 2005; Hillard and Jarrahian, 2005). Against >100 papers describing a transporter-mediated uptake of AEA via a selective “anandamide membrane transporter,” a few papers recently proposed that the transport occurs by simple diffusion or endocytosis via caveolae/lipid rafts Glaser et al., 2005; McFarland et al., 2004a). As a matter of fact, the lack of cloning and expression of the purported transporter protein has prevented the development of molecular tools like oligonucleotides or antibodies, which are able to give definitive proof of the presence of a true transporter on the cell surface. In the same line, AEA analogs able to visualize AEA movement across the plasma membrane and its subsequent fate within the cell, are still missing.
We synthesized and characterized a biotinylated analog of AEA (b-AEA) that has the same lipophilicity of the parent compound. We used
biochemical assays and fluorescence microscopy employing b-AEA as a tool to visualize accumulation, intracellular distribution and trafficking of AEA inside the cells. We chose to modify the polar head of AEA because this structural change does not influence the kinetics of AEA uptake (Piomelli et al., 1999). We used human keratinocyte cells (HaCaT) and human neuronal SH-SY5Y because they have a full and functional endocannabinoids system (Maccarrone et al., 2003a; Pasquariello et al., 2009) and are suitable for immuno-microscopy studies (Maccarrone et al., 2003a).
Figure 1. Major breakthroughs in the recent history of cannabis, cannabinoid and
endocannabinoid research.
INTRODUCTION CHAPTER 1. THE ENDOCANNABINOID SYSTEM 1.1 Molecular targets
CHAPTER 1. THE ENDOCANNABINOID SYSTEM
1.1 Molecular targets
AEA and the other endocannabinoids act at first binding or interacting with cannabinoid receptors. The most important of them are CB1 and CB2 receptors (Pertwee and Ross, 2002). There is some evidence that endocannabinoids induce a biological activity via other CB receptors, like a purported CB3 (GPR55) receptor (Sawzdargo et al., 1999; Backer et al., 2006; McPartland et al., 2006; Ryberg et al., 2007), via non-CB1/non-CB2 receptors, or via non-cannabinoid receptors. In the latter group, transient receptor potential vanilloid 1 (TRPV1) has emerged as an important target of AEA, but remarkably not of 2-AG. Moreover AEA can act on a members of nuclear receptor superfamily, the peroxisome proliferator-activated receptors-γ (PPARγ) (Bouaboula et al., 2005).
Type-1 cannabinoid receptor (CB1) and type-2 cannabinoid receptor (CB2) are seven trans-membrane spanning receptors. The CB1R, cloned in 1990 (Matsuda et al., 1990), is expressed highly in those regions of the brain that correlate with the observed effects of cannabinoids impairment in cognition, memory and motor coordination. Hence, CB1R have been isolated in hippocampus, basal ganglia, cerebral cortex, amygdala and cerebellum (Glass et al., 1997). In the periphery the CB1R has been identified in the pituitary gland, immune cells reproductive tissues, gastrointestinal tissues, sympathetic ganglia, heart, lung, urinary bladder and adrenal gland (Galiegue et al., 1995).
The CB2R was cloned from human promyelocytic leukaemia cells (HL-60 cells) (Munro et al., 1993). It has 68% of amino acid sequence homology to the CB1 receptor within the transmembrane domains and only 44% of homology throughout the total protein (Munro et al., 1993) (Fig. 3). The CB2 receptor is restricted to the periphery where it has been observed in the spleen (Munro et al., 1993, Schatz et al., 1997), in tonsils and on immune cells (B-cells, monocytes, T-cells) (Munro et al., 1993, Galiegue et al., 1995, Schatz et al., 1997). Yet, it has been found in the retina of adult rats (Lu et la., 2000) and it can be expressed in brain microglial cells (Franklin and Stella, 2003).
Other data suggest the presence of novel, uncloned cannabinoid receptors. Using the brains of CB1 knockout mice (CB1-/-) it was shown that there was significant binding of the cannabinoid agonist [3H]WIN 55,212-2 (Breivogel et al., 2001). Moreover, both WIN55,212-2 and the endogenous cannabinoid anandamide were still able to stimulate some labelled non-hydrolysable GTP ([35S]GTPgS) binding in CB1-/- brain, an indicator of GPCR activation. This effect was not blocked by the CB1 receptor antagonist SR141716 (Breivogel et al., 2001). These data are supported by the observation that three typical cannabimimetic effects of AEA, the inhibition of spontaneous activity in an ‘open field’, the induction of immobility on a ‘ring’ and the antinociception in the ‘hot plate’ test, can still be observed in transgenic mice lacking the CB1 receptor (Di Marzo et al., 2002)
More results obtained from experiments with tissues containing naturally expressed cannabinoid receptors and with cells that have been transfected with CB1 or CB2 receptors indicate that both these receptor types can couple through Gi/o proteins.
The first characterised CB1 receptor signal transduction response was the inhibition of adenylyl cyclase by micromolar concentrations of ∆9-THC in N18TG2 neuroblastoma cells (Howlett and Fleming, 1984). This response was blocked by pertussis toxin (PTX) suggesting the involvement of Gi/o proteins (Howlett et al., 1986).
The CB1 receptor can interact with Gs under conditions of PTX treatment that prevents the receptor’s interaction with Gi/o proteins. (Howlett et al., 1986). Since nine distinct isozymes of adenylyl cyclase have been identified, categorised into six distinct classes based on sequence and functional similarities (Patel et al., 2001), it is possible that the dual coupling of cannabinoid receptors to Gs and Gi/o and so the contrasting effects of cannabinoids on adenylyl cyclase activity, could be attributed to the specific isoform present in different cellular preparations. CB1 receptors have been shown to link positively to mitogen-activated protein kinase (MAPK). In CHO cells, expressing CB1 receptors, the cannabinoid agonist CP 55,940 activated a p42/p44 MAP kinase (Galve-Roperh et al., 2002). These effects were PTX- and SR141716-sensitive (Bouaboula et al., 1995).
CB1 receptors are also coupled through Gi/o proteins to ion channels, positively to A-type and inwardly rectifying potassium channels and negatively to N-type and P/Q type calcium channels and to D-type potassium channels (Pertwee, 1997; 2001; Howlett and Mukhopadhyay, 2000). In addition, there is evidence that CB1 receptors are negatively coupled to
postsynaptic M-type potassium channels in rat hippocampal CA1 pyramidal neurons and to voltage gated L-type calcium channels in cat cerebral arterial smooth muscle cells and in retinal bipolar cell axon terminals of larval tiger salamanders (Pertwee, 2001; Howlett and Mukhopadhyay, 2000).
Similar to CB1, CB2 receptors can modulate adenylyl cyclase and MAPK activity through their ability to couple to Gi/o proteins (Felder et al., 1995; Kobayashi et al., 2001). However, in contrast to CB1, CB2 receptor stimulation is believed not to modulate ion channel function, as seen in AtT-20 cells transfected with CB2 receptors (Felder et al., 1995) and Xenopus oocytes transfected with CB2R and GIRK1/4 (McAllister et al., 1999). A number of investigations have demonstrated the ability of anandamide to activate the TRPV1 receptor (Fig. 4), although it is thought to do so by binding to sites on the cytosolic side of the receptor (De Petrocellis et al., 2001).
TRPV1 is a six trans-membrane spanning protein with intracellular N- and C-terminals and a pore-loop between the fifth and sixth transmembrane helices (Jung et al., 1999). This ligand-gated and non-selective cationic channel is activated by molecules derived from plants, such as the pungent component of ‘hot’ red peppers capsaicin, by noxious stimuli like heat and protons (Jordt and Julius, 2002) [38] and by peptides contained in spider toxins (Siemens et al., 2006) [39]. Also AEA is considered a true ‘endovanilloid’ (van der Stelt and Di Marzo, 2004; Starowicz et al., 2007), that behaves as an authentic (though weak) ligand of TRPV1. It evokes vascular relaxation in arteries of the guinea-pig, in a capsazepine-sensitive manner (Zygmunt et al., 1999), indicating that AEA could activate TRPV1 channels in physiological preparations. This response could not be attributed to cannabinoid receptors because neither WIN 55,212-2 nor HU-210 were able to evoke the response while SR141716 failed to attenuate the vasodilatory actions of anandamide. Anandamide has also been shown to activate TRPV1 receptors in rat hippocampal slices (Al-Hayani et al., 2001). One activity of AEA that has attracted interest is its ability to induce apoptosis in neuronal and peripheral cells (Maccarrone and Finazzi-Agrò, 2003b). This observation could have therapeutic potential in cancer (Guzman, 2003) and neurodegenerative diseases (Cravatt and Lichtman, 2003; Piomelli, 2003). In a previous study we have shown that the pro-apoptotic activity of AEA occurs through activation of TRPV1 (Maccarrone et al., 2000a). We showed that AEA is a physiological agonist of TRPV1 (De Petrocellis et al., 2001) so can be also considered a true endovanilloid (van der Stelt and Di Marzo, 2004). But activation of CB1R protects cells
against AEA-induced apoptosis, suggesting that vanilloid and cannabinoid receptors regulate in opposite ways the apoptotic potential of AEA (Maccarrone et al., 2000a; Yamayi et al., 2003)
Figure 3. Schematic representation of cannabinoid receptors and thei homology
INTRODUCTION CHAPTER 1. THE ENDOCANNABINOID SYSTEM 1.2 AEA metabolism
1.2 AEA metabolism 1.2.1 AEA biosynthesis
AEA was originally isolated from porcine brain as the first endogenous cannabinoid (Devane et al., 1992). Ligand binding studies have suggested that it can act at both the CB1 (Ki 61 nM) and the CB2 (Ki 1930 nM) receptors, although it may be more efficacious at CB1 (Felder et al., 1995). AEA behaves as an affinity-driven CB1 receptor agonist. Thus its efficacy at CB1 receptors, although higher than that of ∆9- THC, is often found to be lower than those of other cannabinoid agonists [e.g., (+)-WIN55212-2 or CP-55940]. AEA biosynthesis has been demonstrated in neurons (Di Marzo et al., 1994), macrophages (Di Marzo et al., 1996b), and many other tissues and cell types. Unlike other mediators, this compound is not stored in secretory vesicles but is formed “on demand” in a Ca2+-dependent manner (Di Marzo et al., 1994) and in a two-step process: (i) first the N-acylation of phosphatidylethanolamine (PE) by an acyltransferase named NAT, generates N-arachidonoyl-phosphatidylethanolamine (NArPE), (ii) then an hydrolase converts NArPE into AEA.
(i) In the first step, NAT catalyzes direct transfer of arachidonic acid from
the sn-1 position of phosphatidylcholine (PC), generating
N-arachidonoylphosphatidylethanolamine (NArPE), the AEA precursor. This biosynthetic pathway is in agreement with the observation that AEA levels are lower than those of the other NAEs in most of the tissues analyzed because the arachidonic acid levels in position 1 of phospholipids are very low. (ii) In the last step NArPE is hydrolyzed by NAPE-PLD which releases AEA and phosphatidic acid (PA). This enzyme has been cloned and purified from rat heart and classified as a member of the zinc metallo-hydrolase family of the β-lactamase fold (Okamoto et al., 2004). NAPE-PLD does not recognize phosphatidylcholine and phoshatidylethanolamine as substrates, and it is widely distributed in mouse organs with highest concentrations in brain, kidney and testis (Okamoto et al., 2004). The same group who characterized NAPE-PLD also suggested that several PLA1/A2 isozymes can generate N-arachidonoyl-lysoPE (NAr-lysoPE) from NArPE, and that a lysoPLD may release AEA from NAr-lysoPE. Therefore, the sequential
action of PLA1/A2 and lysoPLD may represent an alternative biosynthetic pathway for NAEs, including AEA (Sun et al., 2004).
The wide distribution of NAPE-PLD in various brain regions further supports its central role in the formation of AEA and other N-acylethanolamines in the CNS (Morishita et al., 2005).
However, two more mechanisms have been recently described to occur in macrophages and brain homogenates, respectively, for the transformation of NArPE into AEA (Starowicz et al. 2007): (i) the phospholipase C-dependent conversion to phospho-AEA, followed by the hydrolysis of the latter to AEA by PTPN22, a tyrosine phosphatase enzyme (Liu et al., 2006) and (ii) the action of alpha/beta-hydrolase 4 (Abh4) as a lysophospholipase/phospholipase B for the formation of glycerol-phospho-AEA, which is then converted into AEA by an as-yet-unidentified phosphodiesterase (Simon and Cravatt, 2006) (Fig. 5A).
1.2.2 AEA degradation and uptake
As a putative neuromodulator, AEA that is released into the synaptic cleft is expected to be rapidly inactivated. In general, two mechanisms are known to remove endocannabinoids from the synaptic cleft to ensure rapid signal inactivation: re-uptake mediated by a putative transporter that promotes the cellular uptake of AEA (AMT) (Fig. 6) or enzymatic degradation by fatty acid amide hydrolase (FAAH) which hydrolyzes AEA to arachidonic acid and ethanolamine. Whereas the role of FAAH in AEA metabolism is well characterized, the existence of the putative AEA membrane transporter remains controversial. Since AEA is a lipophilic compound, it can diffuse passively through lipid membranes and this process can be accelerated by a rapid and selective mechanism, both in neurons and glial cells (Di Marzo et al., 1994; Beltramo et al., 1997; Hillard et al., 1997). Although Glaser et al. (2003) proposed that AEA cellular uptake is facilitated uniquely by the intracellular hydrolysis by FAAH, other studies (Ligresti et al. 2004, Fegley et al. 2004) using preparations from FAAH null mice, demonstrated that FAAH alone does not account for the facilitated diffusion of AEA across the cell membrane. That at least one protein different from FAAH is required to facilitate AEA transport across the plasma membrane in a selective and bidirectional way was also indirectly suggested by the fact that AEA uptake (and possibly its release) can be stimulated by NO (Maccarrone et al., 1998) and blocked by selective inhibitors (De Petrocellis et al., 2001;
Lopez-Rodriguez et al., 2003; Ortar et al., 2003; Ligresti et al., 2004) with no concomitant effect on FAAH. However, the elusive nature of the putative protein responsible for endocannabinoid transport across the plasma membrane initiated a discussion that is still debating (Hillard and Jarrahian, 2003). After internalization, AEA is hydrolyzed to arachidonic acid and ethanolamine by FAAH, an intracellular membrane-bound serine hydrolase (Hillard et al., 1995; Ueda et al., 1995a). This enzyme was cloned in 1996 (Cravatt et al., 1996) and its X-ray structure has been characterized in detail a few years later (Bracey et al., 2002). FAAH is mainly expressed in microsomial membranes and has an alkaline optimal pH. Extensive SAR studies for the interaction of fatty acid long chain derivatives with FAAH have been reported suggesting that both the alkyl chain and the polar ‘‘head’’ of AEA are important for interaction with the active site. Another amidase, seemingly located in lysosomes, and playing a major role in the inactivation of the AEA congener, N-palmitoyl-ethanolamine, has been also characterized (Ueda et al., 2001). FAAH is wideley distribued in the rat brain, where it is expressed at high concentrations in cell bodies and dendrites of several neurons (Tsou et al., 1998; Egertova et al., 2003). Interestingly, in brain areas such as hippocampus, neocortex and cerebellum, FAAH-immunoreactive (ir) cell bodies are exposed to CB1-positive axon terminals, indicating that FAAH not only regulates inactivation of AEA but also that this process is mostly postsynaptic (Fig. 6). Since AEA activates TRPV1 by acting at an intracellular site, its degradation by FAAH should limit its activity at this target (De Petrocellis et al., 2001).
Recent proteomic data suggest the existence of a second mammalian AS enzyme with FAAH activity, called 2 (Wei et al., 2006). The FAAH-2 gene was found in primates and in distantly related vertebrates but not in rodents like mice and rats. This enzyme exhibits an overlapping but distinct tissue distribution, substrate selectivity, and inhibitor sensitivity compared to the original FAAH enzyme. Both FAAH-1 and FAAH-2 share 20% amino acid sequence identity. Comparison of the enzymatic properties of FAAH-1 and FAAH-2 revealed that FAAH-1 has much higher hydrolytic activity than FAAH-2, with AEA (C20:4) as substrate. This differential activity contrasted with the similar rates of hydrolysis displayed by the two enzymes with oleamide (C18:10) and linoleamide (C18:1) FAAs. FAAH-2 thus appears to prefer monounsaturated over polyunsaturated acyl chains, while FAAH-1 exhibits the opposite selectivity. These observations indicate that FAAH-2 may be important for the regulation of monounsaturated lipid
amides in the CNS and peripheral tissues; however, further investigation is needed (Wei et al., 2006).
In addition to its hydrolysis by FAAH, AEA is metabolized by COX-2, lipoxygenase (LOX) and cytochrome P450 (Fig. 5B). COX-2 has been shown to metabolize AEA in to PGE2-ethanolamide (PGE2-EA) (Ross et al., 2002). 12- and 15-LOX, non-heme iron-containing enzymes convert AEA into 12- and 15-hydroxy-AEA (12- and 15-HAEA) in vitro, respectively (Kozak et al., 2002; Ueda et al., 1995b). Cytochrome P450 also metabolizes AEA into several polar lipids (Burstein et al., 2000). cDNA cloning and functional expression of the enzyme termed “N-acylethanolaminehydrolyzing acid amidase (NAAA)” from human, rat, and mouse has been reported and had no homology to FAAH but belonged to the choloylglycine hydrolase family (Tsuboi et al., 2005). NAAA was revealed to be a glycoprotein localizing mainly in lysosomes (Tsuboi et al., 2005). Recently, in the absence of FAAH, exogenously injected AEA was shown to be converted into o-phosphorylcholine (o-PC)-AEA in the brain and spinal cord. The choline-specific phosphodiesterase (NPP6) was found to convert PC-NAE into NAE (Mulder and Cravatt, 2006). Further research is required to elucidate the exact mechanism and enzymes involved in this pathway of AEA metabolism.
INTRODUCTION CHAPTER 1. THE ENDOCANNABINOID SYSTEM 1.3 2-AG metabolism
1.3 2-AG metabolism 1.3.1 2-AG biosynthesis
2-AG has been characterized as a unique monoacylglycerol species isolated from the canine gut (Mechoulam et al., 1995) and rat brain (Sugiura et al., 2000) and as an endogenous cannabinoid receptor ligand. According to its chemical structure, this endocannabinoid is an arachidonyl ester rather than an amide (Basavarajappa et al., 2007; Basavarajappa et al., 2006; Howlett et al., 2002); it was found to bind to both CB1 (Ki 2.4 µM) and CB2 receptors. The CB1 receptor binding activity of 2-AG was 24-times less potent than that of AEA. 2-AG caused the typical effects of ∆9-THC, such as antinociception, immobility, immunomodulation, and inhibition of electrically evoked contractions of the mouse vas deferens (Mechoulam et al., 1995; Sugiura et al., 1996; Sugiura et al., 1995). The levels of 2-AG in tissue and cells are usually much higher than those of AEA and are sufficient in principle to activate both cannabinoid receptor subtype (Sugiura et al., 1995).
2-AG biosynthesis occurs by two possible routes in neurons. Phospholipase C (PLC)-mediated hydrolysis of membrane phospholipids may produce diacylglycerol (DAG), which may be subsequently converted to 2-AG by a sn-1-DAG lipase (Stella et al., 1997; Bisogno et al., 2003). Alternatively, phospholipase A1 (PLA1) may generate a lysophospholipid, which may be hydrolyzed to 2- AG by lyso-PLC activity (Sugiura et al., 1995). LysoPI-specific PLC is distinct from various other types of PLCs that act on other inositol phospholipids and is located in the synaptosomes (Tsutsumi et al., 1994; Ueda et al., 1993a; Ueda et al., 1993b). Under certain conditions, AG can also be synthesized through the conversion of 2-arachidonyl lysophosphatidic acid (LPA) by a phosphatase to yield 2-AG (Nakane et al., 2002).
Two sn-1-specific DAG lipases responsible for the synthesis of 2-AG have been cloned by comparing human genome with Penicillium DAGL sequence (Bisogno et al., 2003). Both proteins were found to have four transmembrane domains, and are members of the serine-lipase family with Ser443 and Asp495 participating in the enzymatic catalytic triad. DAGLα (120 kDa) and β (70 kDa) have shown an optimum at pH 7 and are
differentially regulated in the brain depending on the area. For example during the embryonic development they facilitate axonal growth (Williams et al., 2003). In addition the α isoform seems to be predominant in the adult brain, while the β isoform is expressed in developing brain (Bisogno et al., 2003).
DAGL appears to be targeted to postsynaptic spines; it is highly enriched at the base of the spine neck and in the adjacent somatodendritic membrane but is excluded from the main body of the spines and the excitatory synapses in cerebellar Purkinje cells. In hippocampal pyramidal cells, DAGL is distributed at the spine head or neck or at both structures (Katona et al., 2006; Yoshida et al., 2006). The different localizations in different neuron types suggest that the specificity and efficiency of endocannabinoid-mediated retrograde suppression of neurotransmission depend not only on CB1 expression levels in presynaptic elements but also on the distance between the postsynaptic site of 2-AG production and the presynaptic CB1 receptor.
Recently, it has been demonstrated that in primary cultures of mouse microglial cells and astrocytes, millimolar concentrations of ATP significantly increase 2-AG synthesis without acting on AEA production. ATP enhances 2-AG levels in a time-dependent manner by activating purinergic P2X7 receptors (Witting et al., 2004). These ionotropic receptors are permanently permeable to Ca2+ (James and Butt, 2002), confirming the relevant role of calcium in the biosynthesis of endocannabinoids (Stella and Piomelli, 2001). Interestingly DAGL activity may be enhanced in peripheral systems by the potent bioactive phospholipid, platelet-activating factor (PAF) (Berdyshev et al., 2001).
1.3.2 2-AG degradation and uptake
It has been suggested that 2-AG can be re-uptaked by the same transporter used by anandamide, i.e. AMT (Beltramo and Piomelli, 2000; Bisogno et al., 2001) (Fig. 7). Human astrocytoma cells, like primary neuronal cell cultures, have been shown to accumulate radioactive 2-AG through an Na+- and ATP-independent process (Hajos et al., 2004). This accumulation is tightly temperature- and concentration- dependent and is reduced by AM404 (N-(4-hydroxyphenyl)-arachidonamide), an AMT inhibitor, and indirectly by high concentrations of arachidonic acid (Beltramo and Piomelli, 2000). The effect
of AM404 is due to the inhibition of AMT and not to the blocking of FAAH activity, because using two strong FAAH inhibitors like URB597 and AM374, the concentration of 2-AG remained unaltered (Hajos et al., 2004). Once inside the cell AG is degradated. Although FAAH can catalyze 2-AG hydrolysis (Di Marzo and Deutsch, 1998), its levels are not increased in FAAH ‘‘knockout’’ mice, unlike those of AEA (Lichtman et al., 2002). This observation is in agreement with the previously reported evidence regarding the existence of other enzymes catalyzing 2-AG inactivation different from FAAH (Di Marzo et al., 1999; Goparaju et al., 1999). 2-AG is predominantly degradated by monoacylglycerol lipase (MAGL) in the same manner as other monoacylglycerols (Konrad et al., 1994). A MAG lipase, inactive on AEA and with high homology with other human and mouse MAGLs, has been cloned from human, mouse and rat (Karlsson et al., 2001; Ho et al., 2002; Dinh et al., 2002). In rat brain, this MAGL is present with the highest levels in regions where CB1 cannabinoid receptors are expressed (hippocampus, cortex, anterior thalamus and cerebellum). Furthermore, immunohistochemical studies in the hippocampus suggested a presynaptic localization of the enzyme, supporting the role of rat MAGL in the degradation of 2-AG as retrograde messenger, and supplementing the data showing that the DAGLs responsible for 2-AG production are instead postsynaptic in the adult brain (Dinh et al., 2002; Bisogno et al., 2003). Recent studies have confirmed the complementary localization in the brain for the MAGL and FAAH, pre-synaptic and post-synaptic, respectively, suggesting different roles for the two endocannabinoids in the CNS (Gulyas et al., 2004). 2-AG is metabolized to 2-arachidonyl LPA through the action of monoacyl glycerol kinase(s). 2-Arachidonyl LPA is then converted into 1-steroyl-2-arachidonyl PA (Simpson et al., 1991). 1-Steroyl-2-arachidonyl PA is further utilized in the “PI cycle” or is used in the de novo synthesis of phosphatidylcholine (PC) and phosphatidylethanolamine (PE). Furthermore, 2-AG is metabolized by enzymatic oxygenation by cyclooxygenase-2 (COX-2) into prostaglandin H2 (PGH(COX-2) glycerol esters. The biological activity and the role of oxygenated 2-AG have yet to be determined. Inhibition of COX-2 prolongs DSI, suggesting that COX-2 limits endocannabinoid action in retrograde signaling and synaptic plasticity (Kim and Alger, 2004; Sang et al., 2006; Slanina et al., 2005).
INTRODUCTION CHAPTER 2. FLUORESCENT LIPID PROBES
CHAPTER 2. FLUORESCENT LIPID PROBES
Cells contain an enormous variety of biomolecules. The concentrations,
chemical modifications and interactions of these molecules are generally precisely controlled, both spatially and temporally. Deciphering this complex system of interacting molecules inside and among the cells is one of the final goals of biology (Terai, 2008).
Fluorescence based on small organic compounds used as probes themselves or on modification of cellular molecules that can be tied to fluorescent proteins, has become an important tool in modern biology because it allows to have informations about localization and quantity of the molecules of interest. All without the need of genetic engineering of the sample.
Compared to other technologies like radioisotope labelling, fluorescence imaging has many advantages for this purpose, as it enables highly sensitive, non-invasive, and safe detection using readily available instruments. Another advantage of fluorescence imaging is that the fluorescence signal of a molecule can be modulated, so that sensors relying on ‘activation’, not just accumulation, can be utilized. Until the 1980s, however, fluorescence imaging was mainly applied to fixed samples owing to the lack of fluorescent chemosensors, or probes, suitable for imaging in living cells (Terai, 2008).
In lipid research, the last two decades of the previous century were highlighted by rapid developments in the recognition of the role of lipids in a great variety of cellular processes, ranging from membrane fusion, involvement in microdomain formation and transport, to signal transduction (Hoekstra et al., 1994). So they were elevated from only dangerous dietary molecules to essential compounds of body’s health and function.
Lipids are amphiphilic in nature and consist of a hydrophobic chain and a hydrophilic head group region. So there are in principle two regions within the molecule to which fluorescent dyes can be covalently coupled. The intramolecular localization of the dye as well as the chemical nature of the dye itself (Fig. 8) are highly relevant: they will determine the (biophysical) properties of the final fluorescent lipid and subsequently the
assay in which the probes will be used. The majority of the fluorescent dyes that have been used in lipid derivatization, especially those emitting in the visible light region, are hydrophilic. When they are attached in the chain region, the dye will change the hydrophilic/hydrophobic balance of the lipid molecule. Evidently, such a perturbation may have considerable implications for the lipid’s ability to integrate into membranes (Maier et al., 2002) and to interact with the proteins of interest. Histochemistry is the microscopical study of the distribution of substances in tissues using chemical reactions that generate visible products. In the middle years of the twentieth century many histochemical methods were devised for localising enzymatic activities in cells and tissues. Typically, a section of tissue is incubated with an artificial substrate for the enzyme. A product of the enzyme-catalysed reaction is immediately trapped by reaction with another compound in the incubation medium, generating a visible product that either is insoluble or binds firmly to the structural proteins of the cell. Because enzymes are catalysts, many molecules of visible product are produced by each molecule of enzyme in a histochemical reaction. This is a form of amplification. Some enzymes are used as reagents to amplify the histochemical detection of many substances in tissues (Kiernan, 2006). An example is given by the strong and specific affinity of biotin for avidin (Guesdon et al., 1979) or streptavidin. Biotin, a vitamin synthesised by microorganisms in the intestine, is not coloured or fluorescent, but it can be localised with great sensitivity and specificity on account of its high affinity for avidin, a basic glycoprotein component of egg white. Streptavidin is a neutral biotin-binding protein produced by Streptomyces avidinii. It is not a glycoprotein. Immunostaining methods using avidin sometimes give non-specific background colour; this artefact is less when streptavidin, a more expensive reagent, is used (Kiernan, 2006).
Figure 8. Basic structures of fluorescent dyes used for coupling to lipidic
CHAPTER 3. OBJECTIVES OF THE RESEARCH
CHAPTER 3. OBJECTIVES OF THE RESEARCH
The aim of our studies was to characterize a biotinylated analog of AEA (b-AEA) designed to visualize the intracellular accumulation of this endocannabinoid through immunomicroscopy techniques. By means of biochemical assays and morphological analysis we wanted to demonstrate that biotinylation of the polar head of AEA doesn’t affect its accumulation by the cells but prevents its interaction with FAAH, NAPE-PLD, CB1R, CB2R and TRPV1.
Moreover, using this tool, we focused our attention on intracellular accumulation, trafficking and protein-binding of AEA, the most important endocannabinoid.
CHAPTER 4. RESULTS 4.1 Characterization of b-AEA
CHAPTER 4. RESULTS
4.1 Characterization of b-AEAWe designed an analog of AEA, the biotin-AEA (b-AEA) that could be a new tool to visualize AEA inside the cells. Since previous studies have indicated that the kinetic parameters of AEA uptake are sensitive to modification of the arachidonate moiety, whereas changes in the ethanolamide region are well tolerated (Muthian et al., 2000; Di Marzo et al., 2004), we synthesized b-AEA in which the biotin tag was attached to the polar head of AEA through a spacer arm (Fig. 9A). The synthetic route of b-AEA allowed us to produce both b-AEA and its tritium-labeled analog ([3H]b-AEA) with a yield of ~50%. The identity and purity of b-AEA was checked by HPLC-ESI-MS and by 1H NMR. HPLC ESI- MS was performed with a Waters apparatus (Milford, MA), and 1H NMR was recorded on a Bruker AM series spectrometer (Rheinstetten, Germany) at 300 K and 300 MHz. Biotin-AEA showed an MS spectrum (Fig. 9B) with m/z 5 661.8 [M1H]1 and a 1H NMR (CD3CN) spectrum (Fig. 9C) with y: 0.88 (3H, t, J 5 5.1 Hz), 1.24– 1.47 (6H, m), 1.49–1.74 (8H, m), 2.06–2.31 (8H, m, partially under water residual peak), 2.66 (1H, d, J 5 12.9 Hz), 2.77–2.96 (7H, m), 3.14–3.23 (1H, m), 3.26–3.36 (4H, m), 3.46–3.55 (4H, m), 3.58 (4H, s), 4.18–4.29 (1H, m), 4.40– 4.46 (1H, m), 5.26–5.48 (8H, m), 6.51–6.56 (bs, 2H). Interestingly, the addition of the biotin tag did not yield any major change in lipophilicity, expressed as logarithm of the partition coefficient in n-octanol/water (LogP in Fig. 10), calculated through the HyperChemTM 6.03 Molecular Modeling System (Hypercube, Inc., Gainesville, FL). Also the analysis of low-energy conformations of AEA and b-AEA showed similar electrostatic potentials on the acyl chain moiety (Fig. 10). These conformations were obtained using molecular mechanics geometry optimization with the AMBER94 force field, followed by single-point calculations (HyperChemTM 6.03), as reported (Dainese et al., 2007).
Figure 9. Chemical structure (A), MS spectrum (B), and 1HNMR spectrum (C) of the
biotinylated analog of N-arachidonoylethanolamine (b-AEA)
Figure 10. Molecular properties of AEA versus b-AEA. The molecular weight,
lipophilicity (LogP), and electrostatic potential of AEA are compared with those of b-AEA. Low-energy conformations of AEA and b-AEA are reported in the bottom panel and show the electrostatic potential on the molecular surface (violet, 21; green, 11).
CHAPTER 4. RESULTS 4.2 Metabolism of AEA and b-AEA in HaCaT cells
4.2 Metabolism of AEA and b-AEA in HaCaT cells
We sought to test the similarities in accumulation of AEA and b-AEA in HaCaT cells because they possess a full and functional endocannabinoid system (Maccarrone et al., 2003a) and are suitable for immune-microscopy studies (Oddi et al., 2005). We found that intact HaCaT cells were able to accumulate [3H]b-AEA in a concentration-dependent manner, typical of a saturable process (Fig. 11A). Accumulation of [3H]b-AEA was similar to that of [3H]AEA (Fig. 11A) with apparent Km and Vmax values of 421 ± 88 nM and 116 ± 10 pmol/min*mg of protein, respectively (Table 1). These kinetic constants are typical of AEA transport in HaCaT cells (Maccarrone et al., 2003a) as well as in other cell types (Battista et al., 2005; Glaser et al., 2005; Hillard and Jarrahian, 2005). In addition, 5 µM OMDM-1, a selective AEA uptake inhibitor (Ortar et al., 2003), minimized the uptake of [3H]b-AEA (Fig. 3A) in much the same way as it inhibited that of [3H]AEA in the same cells (Oddi et al., 2005). Unlike [3H]AEA, which was hydrolyzed in a concentration-dependent manner (Fig. 11B) and with kinetic constants (Table 1) typical of FAAH in HaCaT cells (Maccarrone et al., 2003a), [3H]b-AEA was not a substrate for FAAH (Fig. 11B). In particular, we found only intact [3H]b-AEA when we analyzed by RP-HPLC the organic extract of the enzymatic reaction, demonstrating that b-AEA is metabolically stable (data not shown). Furthermore, [3H]b-b-AEA did not bind to CB1R of HaCaT cells (Fig.11C), at variance with [3H]AEA, which bound to these receptors (Fig. 11C) with apparent Kd and Bmax values (Table 1) close to those already found in HaCaT cells (Maccarrone et al., 2003a). Likewise, SR141716 (0.5 µM), but not SR144528 (0.5 µM), which are selective antagonists of CB1 or CB2 receptors, respectively (Howlett et al., 2002; Pertwee and Ross, 2002), reduced the binding of 400 nM [3H]AEA to HaCaT cell membranes to ~15% of control values, corroborating previous data (Maccarrone et al., 2003a).
Table 1. Kinetic constants of AEA uptake, FAAH activity, or CB1R binding in HaCaT
cells using AEA or b-AEA as substrate or ligand
Figure 11. Metabolism of AEA versus b-AEA in HaCaT cells. A: Transport of [3H]AEA
and [3H]b-AEA alone. The effect of 5 µM (S)-1’-(4-hydroxybenzyl) oleoylethanolamide (OMDM-1) refers to the uptake of [3H]b-AEA and was superimposable on the effect on the uptake of [3H]AEA (omitted for the sake of clarity). B: Hydrolysis by fatty acid amide hydrolase (FAAH). C: CB1R binding. Error bars represent SD values.
Parameter Kinetic constant
AEA uptake Km (nM) Vmax (pmol/min per mg protein)
AEA 353 ± 60 124 ± 8
b-AEA 421 ± 88 116 ± 10
FAAH Km
(µM)
Vmax (pmol/min per mg protein)
AEA 13 ± 2 385 ± 25
b-AEA ____ ____
CB1R Kd (nM) Bmax (fmol per mg protein)
AEA 173 ± 38 926 ± 63
CHAPTER 4. RESULTS 4.3 Inhibition assays of AEA and b-AEA
4.3 Inhibition assays of AEA and b-AEA
To further characterize the biochemical profile of biotin-AEA, we performed inhibition assays aimed at calculating the concentration of b-AEA able to reduce by half (IC50) the transport, hydrolysis and biosynthesis of [3H]AEA. The results (Table 2) demonstrate that b-AEA does not affect FAAH activity or NAPE-PLD activity of HaCaT cells when used at concentrations up to 10 µM; yet, it does reduce the uptake of 0.5 µM AEA, with an IC50 value of 0.5 ± 0.1 µM, indicating very similar affinities of the transport machinery toward AEA and its biotinylated derivative (Table 2). We also tested the ability of b-AEA to inhibit the binding of [3H]CP55.940, a synthetic agonist of CBRs. To this end, membrane preparations from mouse brain or mouse spleen were used as sources of authentic type-1 and type-2 CB receptors, respectively (Howlett et al., 2002; Pertwee and Ross, 2002). As expected, we detected by Western blot immunoreactivity for CB1R in the mouse whole brain and for CB2R in the spleen; conversely, we did not observe any immunoreactivity for CB1R in the spleen and for CB2R in the brain (data not shown). We also investigated the ability of b-AEA to bind to TRPV1 by performing competition assays with the specific receptor agonist [3H]RTX (Van der Stelt and Di Marzo, 2004; Szallasi et al., 1999). The results (Table 2) demonstrate that b-AEA was inactive toward CB2 or TRPV1 receptors at concentrations up to 10 µM, whereas it was able to inhibit by 50% CB1R binding at 5 ± 0.7 µM (Table 2). In order to analyze the interaction of b-AEA with CB1R, we calculated the Kd and Bmax values for CP55.940 (concentration range, 0–1 nM) in the absence or presence of 10 µM b-AEA. We found that b-AEA did not affect Kd (720 ± 100 vs. 734 ± 110 pM of controls) but reduced Bmax almost by half (517 ± 72 vs. 1150 ± 200 fmol/mg of protein of controls). The biochemical data suggest that b-AEA is not a substrate for FAAH, does not interfere with NAPE-PLD, and is not efficiently recognized by the AEA binding receptors. However, b-AEA is transported by the same machinery, and with the same efficiency, as AEA.
Table 2. IC50 values of b-AEA toward uptake, hydrolysis, and biosynthesis of AEA and
toward CB1R, CB2R, and TRPV1 binding
Data are means 6 SD of three independent experiments.
a Uptake was measured in intact HaCaT cells with 400 nM [3H] AEA as substrate (control=80 ± 9 pmol/min*mg protein).
b Activity was measured in HaCaT cell extracts with 10 µM [3H] AEA as substrate (control=170 ± 18 pmol/min*mg protein).
c Activity was measured in HaCaT cell extracts with 100 µM [3H] N-arachidonoylphosphatidylethanolamine as substrate (control=12 ± 3 pmol/min*mg protein). d Binding was measured in mouse brain membrane fractions with 400 pM [3H]CP55.940 as ligand (control= 82 ± 8 fmol/mg protein).
e Binding was measured in mouse spleen membrane fractions with 400 pM [3H]CP55.940 as ligand (control= 58 ± 4 fmol/mg protein).
f Binding was measured in C6 cell membrane fractions with 500 pM [3H]resinferatoxin as ligand (control= 141 ± 22 fmol/mg protein).
Parameter IC50 (µM) Uptakea 0.5 ± 0.1 FAAHb > 10 NAPE-PLDc > 10 CB1Rd 5 ± 0.7 CB2Re > 10 TRPV1f > 10
CHAPTER 4. RESULTS 4.4 Immunofluorescence studies of b-AEA accumulation
4.4 Immunofluorescence studies of b-AEA accumulation
To ascertain whether b-AEA can be used as a probe to visualize the internalization of AEA by intact cells, we next performed immunofluorescence microscopy studies in human HaCaT keratinocytes. b-AEA was detected by indirect immunofluorescence using an anti-biotin monoclonal antibody and an anti-mouse secondary antibody conjugated with a green fluorescent dye. The immunostaining revealed that cells quickly (within 5 min) took up b-AEA, which appeared to accumulate both in the cytosol and in the nucleus (Fig. 12, b-AEA). Interestingly, the biotin tag per se was not taken up by the cells under the same experimental conditions (Fig. 12, Ctrl). In line with this, we found that biotinyl-arachidic acid, a saturated analogue of b-AEA, was not transported inside the cells (data not shown), further supporting that it is the arachidonic moiety and not the biotin-tag of b-AEA that is the crucial portion for a correct transport of the molecule across the cell membranes. In addition, we tested the specificity of b-AEA immunostaining in the presence of 5 µM OMDM-1 or 0.1 µM URB597. A remarkable decrease in immunostaining was observed only in HaCaT cells pretreated with OMDM-1, strongly indicating that b-AEA was indeed taken up by a transporter-dependent process (Fig. 12). Instead, the inhibition of FAAH activity by 0.1 µM URB597 did not affect the intracellular accumulation of b-AEA, nor did 0.5 µM SR144528 (Fig. 4) or 10 µM capsazepine, a selective antagonist of TRPV1 (data not shown) (Van der Stelt and Di Marzo, 2004; Szallasi et al., 1999). On the other hand, 0.5 µM SR141716 was able to decrease the fluorescence intensity by ~35% of the control (Fig. 12), indicating a contribution of CB1R to AEA uptake (Oddi et al., 2005; Maccarrone et al., 2000b; Ortega-Gutierrez et al., 2004).
Figure 12. Fluorescence microscopy studies of the distribution of b-AEA in HaCaT cells.
No green fluorescence could be detected in negative controls, demonstrating that the biotin tag was not able per se to cross the plasma membrane (Ctrl). Instead, 5 µM b-AEA was internalized, and this process was minimized by 5 µM OMDM-1 and partly by 0.5 µM N-piperidino-5-(4-chlorophenyl)-1-(2,4-dichloro-phenyl)-4-methyl-3-pyrazole carboxamide (SR141716), but not by 0.1 µM cyclohexylcarbamic acid 3’-carbamoyl-biphenyl-3-yl ester (URB597) or 0.5 µM N-[1(S)-endo-1,3,3-trimethyl-bicyclo [2.2.1]heptan-2-yl]5-(4-chloro-3-methylphenyl)-1-(4-methyl-benzyl)-pyrazole-3-carboxa-mide (SR144528). Images are representative of at least three independent experiments, and five fields were examined for each treatment. Fluorescence intensity (AU, arbitrary units) was quantified by ImageJ software, and values represent means 6 SD.
CHAPTER 4. RESULTS 4.5 Visualization of b-AEA accumulation in lipid droplets
4.5 Visualization of b-AEA accumulation in lipid droplets
We found that once accumulated inside the cells, b-AEA shows a spotted pattern throughout the cytosol with a particular intensity around the nucleus. A considerable part of the vesicular-like staining of b-AEA was associated with cytosolic compartments called lipid droplets (LDs, lipid bodies or adiposomes) (Martin and Parton, 2006). These are cytosolic organelles ubiquitously present in eukaryotic cells, where they act as a storage compartment for neutral lipids (Martin and Parton, 2006). LDs, also called lipid bodies or adiposomes, contain a neutral lipid core of triacylglycerols and sterol esters, and are selectively stained by the phenoxazine dye Nile Red (Gocze and Freeman, 1994). Their lipid core is surrounded by a phospholipid monolayer that interacts with LDs-associated proteins. We found that b-AEA staining was diffused throughout the cytoplasm (Fig. 3A), and that it formed rings surrounding the Nile-Red positive central core of adiposomes (Fig. 13A, inset). These observations suggest that intracellular b-AEA reaches the adiposomes and is stored on their surface. In addition to HaCaT cells (Fig. 13A, inset), b-AEA colocalized with adiposomes also in human neuronal SH-SY5Y cells (Fig. 13D).
To further investigate the functional link between b- AEA and LDs, the dimension of the adiposome compartment was reduced by cell starvation. In fact, the amount of oleic acid present in the medium, and hence the adiposome size, is reduced as a consequence of starvation (Wolins et al., 2001). In serum-starved cells we observed a marked reduction of b-AEA accumulation, which paralleled the reduction of number and size of LDs (Fig. 13C). On the other hand, feeding HaCaT cells with an additional supply of oleic acid considerably increased the uptake of b-AEA, again paralleling the increase in size and number of LDs (Fig. 13B).
CHAPTER 4. RESULTS 4.6 [3H]AEA accumulation in lipid droplets
4.6 [3H]AEA accumulation in lipid droplets
We confirm the dependence of AEA accumulation on the dimension of LDs by examining the uptake of 400 nM [3H]AEA by HaCaT cells grown with an excess of oleic acid. The net uptake of [3H]AEA in oleic acid-treated cells was approximately threefold higher than that of controls (Fig. 13E). Since the internalization of AEA is thought to be the result of two different processes, i.e., accumulation through saturable intracellular components and FAAH-mediated hydrolysis, we sought to estimate the contribution of AEA hydrolysis by inactivating FAAH with 100 nM URB597 (Kathuria et al., 2003). The enzymatic activity of FAAH in living cells was measured using 400 nM [ethanolamine-1-3H]AEA as substrate under the same conditions used for the assay of AEA transport. The addition of URB597 did not abolish completely FAAH activity, which remained ~40% and ~35% of that of oleate-treated and untreated cells (Fig. 13E, white bars); yet, the partial inhibition of AEA degradation reduced the net uptake of [3H]AEA by ~30% of the controls, both in oleate-treated and untreated cells (Fig. 13E). This observation suggests that FAAH activity, although not a requisite for AEA accumulation, does contribute to this process by maintaining a concentration gradient across the plasma membrane. The contribution of AEA hydrolysis was estimated by the difference between the AEA uptake in the absence and in the presence of URB597, corrected for residual FAAH activity. On this basis, we found that AEA catabolism by FAAH was approximately fivefold faster in oleate-treated cells than in controls, and that the intracellular accumulation of AEA was approximately twofold higher in LDs-enriched cells than in controls (Fig. 13E, hatched bars). These data further indicate that adiposomes are directly involved in the intracellular accumulation of AEA. Since FAAH activity in oleate-treated cell homogenates was comparable to that of controls (122 ± 17 versus 116 ± 10 pmol/min per mg of protein), we also speculated that the higher catabolism of AEA observed in treated cells might be due to a faster shuttling of AEA from plasma membrane to intracellular degradation sites, made possible by adiposomes.
CHAPTER 4. RESULTS 4.7 Morpho-functional overlap between LDs and FAAH
4.7 Morpho-functional overlap between LDs and FAAH
Treating the cells with our tool b-AEA, we found by immunofluorescence experiments that it internalized in HaCaT cells reached the endoplasmic reticulum near the nucleus, where it partially colocalized with FAAH staining (Fig. 13G, yellow arrows in inset). Furthermore, the existence of a morpho-functional overlap between LDs and FAAH was ascertained by co-fractionation studies, which revealed a small but significant amount of FAAH activity associated with adiposome-rich fraction derived from mouse liver (Fig. 13F). Additional co-localization studies revealed that FAAH-positive dots (Fig. 13H, green) were partly associated with the periphery of LDs in HaCaT cells (Fig. 3H, white arrows in inset). Incidentally, these findings confirm the results of a recent proteomic study, which demonstrated the presence of FAAH in purified LDs from Drosophila embryos (Cermelli et al., 2006).
Figure 13. Immunocytochemical localization of b-AEA and FAAHto cytoplasmic lipid
droplets (LDs) in human HaCaT cells. (A) LDs in HaCaT cells were stained with Nile Red (red). Cells grown in normal (i.e., low-lipid containing)medium showed colocalization of b-AEA (green) with the rim of the round-shaped lipid bodies (magnified box, yellow arrows). A residual staining seems to be distinct from LDs having a more undefined cytosolic distribution (magnified box; white arrows). (B) Cells treated overnight with 100 µM oleic acid/BSA displayed a significant increase in b-AEA staining, which paralleled the increase of LDs size. (C) Serum-starved cells (i.e., low oleic acid condition) showed a significant reduction of the LDs compartment and a parallel reduction in the accumulation of b-AEA. (D) Immunodetection of b-AEA in SH-SY5Y cells. Images are representative of at least three independent experiments, and five fields were examined for each treatment. (E)Effect of oleic acid treatment (OA) versus control (ctrl) on [3H]AEAuptake byHaCaTcells, grown in the absence or in the presence of 100 nM URB597. In (E), * p<0.05 versus ctrl, and # p<0.05 versus ctrl + URB597 (n=4). (F)Analysis of the FAAH-specific activity in the adiposome fraction and microsome fraction obtained by mouse liver subfractionation. (G) Co-staining of HaCaTcells with anti-FAAH(green) and anti-biotin (red) antibodies.The superimposition of the two stainings revealed that FAAHand b- AEA colocalize only in dot structures near to the perinuclear region (yellow arrows in the inset). (H) Co-staining of HaCaT cells with anti- FAAH antibodies (green) and Nile red staining for adiposomes (red). The superimposition of the two stainings revealed that several FAAH-positive dots are associated to the periphery of the LDs (white arrows in the inset). Bars, 10 mm.
CHAPTER 4. RESULTS 4.8 Storage of [3H]AEA in adiposome-rich fractions of HaCaT cells
4.8 Storage of [3H]AEA in adiposome-rich fractions of HaCaT cells
The relationship between AEA and LDs was also investigated by analyzing the intracellular distribution of [3H]AEA after its uptake. We made subcellular fractionation of HaCaT cells grown in the presence of an excess of oleic acid and incubated for 15 min with [3H]AEA. To prevent the degradation of AEA, FAAH was inactivated by preincubating the cells for 10 min with 100 nM URB597. LDs were isolated by flotation (Yu et al., 2000) and characterized by fluorescence staining and Western blotting (Yu et al., 2000). The two top fractions of the gradient (1 and 2), containing only 1% of the total proteins, were positive for adipophilin, an LD-specific protein, and were devoid of markers of caveolae (caveolin-1), endoplasmic reticulum (ER), cytosol (actin) and plasma membranes (Na+/K+-ATPase) (Fig. 14A). Fluorescence microscopy of Nile Red-stained fractions showed bright, spotted and spherical lipid bodies in all fractions of the gradient, the greatest amount being present in fraction 1 and the smallest amount in fractions 4–8 (Fig. 14B). The distribution of [3H]AEA in these fractions was quantified by radioactivity, normalized to the protein content. We found that the two fractions containing LDs (1 and 2) were also the richest in [3H]AEA (Fig. 14C), further suggesting that adiposomes were important sites for the accumulation of AEA. The [3H]AEA subcellular profile was mirrored by that obtained with [3H]oleic acid, a lipid molecule that is known to specifically accumulate in LDs (Fig. 14D). In addition, to exclude nonspecific associations with LDs, we also analyzed the subcellular distribution of nonyl acridine orange. This fluorescent dye associates with cardiolipin, an anionic phospholipid abundant in mitochondria. As expected, fluorescence of nonyl acridine orange was primarily enriched in the microsomal fraction and was virtually absent from LDs (Fig. 14D). Moreover, by means of radiochromatography we found that ~85% of radioactivity in fractions 1 and 2 was due to intact [3H]AEA whereas only ~15% of radioactivity was [3H]AA (data not shown). To further support the functional interaction between AEA storage, LDs and FAAH, we demonstrated that in the absence of the FAAH inhibitor URB597 the distribution of [3H]AEA markedly changed, with a reduction of radioactivity in the adiposome fraction and a parallel increase in the microsomal fraction (Fig. 14C).
Figure 14. Subcellular distribution of internalized [3H]AEA in human HaCaT cells.
(A) The subcellular fractions obtained from HaCaT cells were analyzed byWestern blotting using different markers for cytoplasm (actin), endoplasmic reticulum (ER), caveolae (caveolin-1, cav-1), plasma membrane (Na+/K+-ATPase, Na/K) and lipid droplets (adipophilin, adip). (B) Staining of fraction 1 (LDs) and fraction 5 (cytosol) with Nile Red. (C) Enrichment of [3H]AEA in the subcellular fractions was expressed as percentage of the total specific activity. The radioactivity of accumulated [3H]AEA was measured in the presence (black bars) or in the absence (white bars) of 100 nM URB597 (black bars: 100%= 430 ± 30 dpm/mg protein; white bars: 100%= 1180 ± 50 dpm/mg protein). (D) Content of 3H-labeled oleate (open bars; 100%= 1400 ± 200 dpm/mg protein), and fluorescence of nonyl acridine orange (hatched bars; 100%= 15 ± 20 fluorescence arbitrary units) in subcellular fractions of HaCaT cells.
![Figure 14. Subcellular distribution of internalized [3H]AEA in human HaCaT cells.](https://thumb-eu.123doks.com/thumbv2/123dokorg/7605398.114781/44.892.232.693.293.615/figure-subcellular-distribution-internalized-aea-human-hacat-cells.webp)
