Functional correlates of TSH, fT3
and fT4 in Alzheimer disease: a F-18
FDG PET/CT study
Agostino Chiaravalloti
1,2, Francesco Ursini
3, Alessandro Fiorentini
1, Gaetano Barbagallo
4,
Alessandro Martorana
5,6, Giacomo Koch
5,6, Mario Tavolozza
1& Orazio Schillaci
1,2The present study was aimed to investigate the relationships between thyroid stimulating hormone (TSH), freeT3 (fT3) and freeT4 (fT4) and brain glucose consumption as detectable by means of 2-deoxy-2-(F-18) fluoro-D-glucose (F-18 FDG) Positron Emission Tomography/Computed Tomography (PET/ CT) in a selected population with Alzheimer disease (AD). We evaluated 87 subjects (37 males and 50 females, mean age 70 (±6) years old) with AD. All of them were subjected to TSH, fT3 and fT4 assay and to cerebrospinal fluid amyloid (Aβ1-42) and tau [phosphorylated-tau (p-tau) and total-tau (t-tau)] assay prior PET/CT examination. Values for TSH, fT3 and fT4 were in the normal range. The relationships were evaluated by means of statistical parametric mapping (SPM8) using age, sex, MMSE, scholarship and CSF values of amyloid and tau as covariates. We found a significant positive correlation between TSH values and cortical glucose consumption in a wide portion of the anterior cingulate cortex bilaterally (BA32) and left frontal lobe (BA25) (p FWE-corr <0.001; p FDRcorr <0.000; cluster extent 66950). No significant relationships were found between cortical F-18 FDG uptake and T3 and T4 serum levels. The results of our study suggest that a cortical dysfunction in anterior cingulate and frontal lobes may affect serum values of TSH in AD patients.
Alzheimer’s disease (AD) is a neurodegenerative disorder leading to cognitive decline and dementia. The path-ogenic mechanisms are still under study. However, the leading hypothesis postulates that metabolic change of a membrane protein, the amyloid precursor protein, could be reasonably responsible for most of the pathological changes observed in course of AD (amyloid hypothesis)1. Paired-helical filaments of hyper-phosphorylated Tau compose the neuro-fibrillary tangles2, 3. These pathological structures are usually located inside dendrites and linked from the neuropil through dendritic shafts to the neuronal cell bodies which contain the neuro-fibrillary tangles4. It is suggested that the pathological aggregation of these proteins is related to neuronal toxicity and cell loss, since Tau aggregate spreading in AD brain increases with cognitive decline5.
In the functioning of human brain, normal thyroid status is essential for the maintenance of optimal cognitive performance6. The “classical” concept of an inverse relation between thyroid function and cognitive abilities has been claimed for decades7 and an inverse correlation between thyroid stimulating hormone (TSH) and mild cognitive impairment (MCI) has been inconsistently demonstrated8, 9. However, novel evidence reappraised this milestone concept and large, well-designed studies have voided the theory that subtle thyroid abnormalities, such as subclinical hypothyroidism, could cause cognitive impairment10. From the other side, some evidence points to a beneficial effect of L-thyroxine supplementation in cognitive function11.
To complicate matters, the link between AD and thyroid function is a much more complicated story. Early evi-dences suggested a perturbation of thyrotropin-releasing hormone (TRH)-TSH axis, characterized by a blunted response of TSH levels after stimulation with exogenous TRH12–14. However, a number of other studies failed to confirm this association15, 16. More recently, an epidemiological link between thyroid function and AD devel-opment was emphasized from different groups. For example, in the Rotterdam study, a large population-based longitudinal study, patients with low baseline TSH levels had higher risk of dementia and AD17. Also in patients with MCI, low TSH correlated with the risk of developing AD in a 6-years follow-up study18. Similar findings 1Department of Biomedicine and Prevention, University Tor Vergata, Rome, Italy. 2IRCCS Neuromed, Pozzilli (IS), Italy. 3Department of Health Sciences, University Magna Graecia, Catanzaro, Italy. 4Institute of Neurology, University Magna Graecia, Catanzaro, Italy. 5Department of Neurosciences, University Tor Vergata, Rome, Italy. 6IRCCS Santa Lucia, Rome, Italy. Correspondence and requests for materials should be addressed to A.C. (email: agostino. [email protected])
Received: 20 March 2017 Accepted: 8 June 2017 Published: xx xx xxxx
were confirmed in different populations19. In addition to baseline levels, also the normal circadian rhythm of TSH release seems to be disrupted in AD20.
The usefulness of 2-deoxy-2-(F-18) fluoro-D-glucose (F-18 FDG) Positron Emission Tomography/Computed Tomography (PET/CT) in the diagnosis of AD an in its differential diagnosis from other neurodegenerative dis-eases has been widely investigated showing a good sensitivity, specificity, and diagnostic accuracy in the detection of bilateral temporo-parietal hypometabolism associated with AD21–23.
Aim of this study was to investigate the relationships among TSH, fT3 and fT4 and brain glucose consumption as detectable by means of F-18 FDG PET/CT in a population with clinical diagnosed AD.
Materials and Methods
Informed consent was obtained from all of the patients and procedures followed were in accordance with the eth-ical standards of the responsible committee on human experimentation (institutional and national) and with the Helsinki Declaration of 1975, as revised in 200824. The Ethics Committee of the Policlinico Tor Vergata approved the protocol research.
AD Patients.
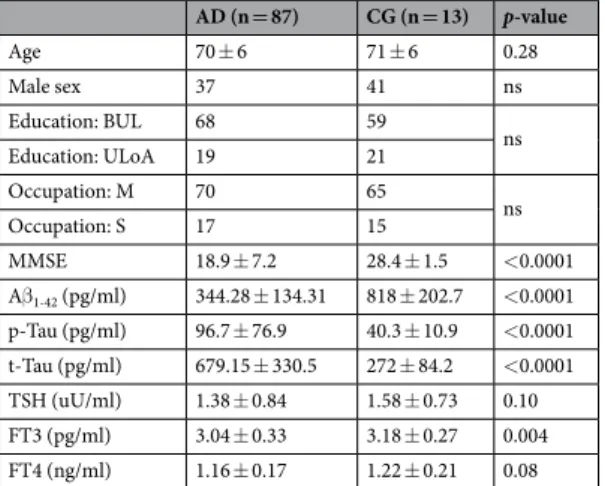
For the present study, we examined 87 newly clinical-diagnosed AD patients according to the NINCDS-ADRDA criteria25. An outline of the patients examined is provided in Table 1. All patients underwent a complete clinical investigation, including medical history and neurological and neuropsychological examination, laboratory evaluation26. Structural Magnetic Resonance (MR) was performed within 1 month prior F-18-FDG PET/CT brain scan in order to exclude any possible brain lesion and to aid in image analysis (when required, PET and MR data were co-registered in order to exclude any artifact, partial volume effect as in the case of an expanded cerebral sulcus27). Exclusion criteria were the following: 1) patients with isolated deficits and/or unmodified MMSE (≥25/30) on revisit (6, 12 and 18 months follow-up); 2) patients with clinically manifest acute stroke in the last 6 months showing an Hachinsky scale >4 and a radiological evidence of sub-cortical lesions; 3) patients with known history of hypothalamus disease, appendices suprasphenoidalis disease, or thyroid disease or taking L-tiroxine substitution therapy or anti-thyroid therapy. None of patients revealed pyramidal and/or extrapyramidal signs at the neurological examination. Moreover, patients with a past history of diabetes, cancer, HIV or with previous brain surgery, radiation or trauma were excluded from the study. Accordingly 102 patients were evaluated and 15 were excluded because presented one or more exclusion criteria or refused to give informed consent.All AD patients showed a cognitive profile consistent with dementia, as assessed by a neuropsychological evaluation including the MMSE and a standardized neuropsychological battery (see below).
We did not consider patients undergoing treatment with drugs that could interfere with F-18-FDG uptake and distribution in the brain and, in particular, all AD patients were discontinued cholinesterase inhibitor treatment throughout the study28.
Control group.
For comparison, we enrolled a group of 80 age- and sex- matched euthyroid control subjects (CG) aged >65 years in whom AD was clinically excluded by extensive evaluation from an experienced neurolo-gist (A.M.). All the CG patients underwent TSH, fT3 and fT4 measurements. Of them, only thirteen underwent CSF collection and analysis and aF-18 FDG PET/CT scan (see Table 1). In particular all of them were chemother-apy naïve. Before their inclusion in our study, all control subjects underwent MRI evaluation, performed 7 ± 2 days before PET/CT examination, in order to exclude brain injury.Cognitive Evaluation.
At the time of enrollment, all recruited patients underwent a neuropsychological bat-tery including the following cognitive domains: general cognitive efficiency: MMSE29; verbal episodic long-term memory: Rey auditory verbal long term memory (RAVLT) (15-Word List Immediate and 15-min Delayed recall)30; visuo-spatial abilities and visuo-spatial episodic long-term memory: Complex Rey’s Figure (copy andAD (n = 87) CG (n = 13) p-value Age 70 ± 6 71 ± 6 0.28 Male sex 37 41 ns Education: BUL 68 59 ns Education: ULoA 19 21 Occupation: M 70 65 ns Occupation: S 17 15 MMSE 18.9 ± 7.2 28.4 ± 1.5 <0.0001 Aβ1-42 (pg/ml) 344.28 ± 134.31 818 ± 202.7 <0.0001 p-Tau (pg/ml) 96.7 ± 76.9 40.3 ± 10.9 <0.0001 t-Tau (pg/ml) 679.15 ± 330.5 272 ± 84.2 <0.0001 TSH (uU/ml) 1.38 ± 0.84 1.58 ± 0.73 0.10 FT3 (pg/ml) 3.04 ± 0.33 3.18 ± 0.27 0.004 FT4 (ng/ml) 1.16 ± 0.17 1.22 ± 0.21 0.08
Table 1. General overview of the AD population examined, including sociodemographic variables. BUL: below
10-min Delayed recall)31; executive functions: phonological word fluency (PWF)32; analogic reasoning: Raven’s Colored Progressive Matrices (RCPM)33. For all employed tests, we used the Italian normative data for both score adjustment (gender, age, and education) and to define cut-off scores of normality, determined as the lower limit of the 95% tolerance interval. For each test, normative data are reported in the corresponding references.
CSF collection and analysis.
All the CSF samples were obtained by lumbar puncture (LP) performed at rest, in decubit-position, between 9:00 and 10:00 AM, after overnight fasting, using an atraumatic needle. Blood specimens were also obtained at the same time of LP procedure. CSF samples were collected in polypropylene tubes using standard sterile techniques. The first 4 ml CSF sample was used for biochemistry routine analysis including total cell count and lactate levels. A second 4 ml CSF sample was centrifuged to eliminate cells and cellular debris and immediately frozen at −80 °C until the analysis to assess t-Tau, p-Tau and Aβ1-42 amounts, performed as previously described. Chemistry assays were carried out using commercially available kits follow-ing the manufacturer’s specifications (Innotest β-Amyloid 1–42, Innotest h-T-tau, InnotestPhospho-T-tau 181; Innogenetics, Ghent, Belgium).Laboratory evaluation.
Venous blood (5 mL) was collected in fasting state. Serum was prepared within 60 min of blood collection. Serum was store at −20 °C until analyzed for thyroid function test.These samples were analyzed within 24 h from blood collection time. Thyroid stimulating hormone (TSH), serum free 3,5,3′-triiodothyronine (fT3) and free 3,5,3′,5′-tetraiodothyronine (fT4) were analyzed. Measurements of fT3 and fT4 were based on a direct, labeled antibody, competitive immunoassay, while TSH assay was based on one-step immunoenzymatic sandwich principle in conjunction with biotin-streptavidin technology.
F-18 FDG injection and PET/CT scan.
The PET/CT system Discovery VCT (GE Medical Systems, Tennessee, USA) has been used to assess F-18 FDG brain distribution in all patients by means of a 3D-mode standard technique in a 256 × 256 matrix. Reconstruction was performed using the 3-dimensional reconstruction method of ordered-subsets expectation maximization (OSEM) with 20 subsets and with 4 iterations. The system combines a high-speed ultra 16-detector-row (912detectors per row) CT unit and a PET scanner with 13440 bismuth germanate crystals in 24 rings (axial full width at half-maximum 1-cm radius, 5.2 mm in 3D mode, axial field of view 157 mm). A low-ampere CT scan of the head for attenuation correction (40 mA; 120 Kv) was performed before PET image acquisition. All the subjects fasted for at least 5 h before intravenous injection of F-18 FDG; the serum glucose level was up to 95 mg/ml in all of them. All the subjects were injected intravenously with 185–210 MegaBequerels of F-18 FDG and hydrated with 500 ml of saline (0.9% sodium chloride). PET/CT acquisition was started 30 minutes after F-18 FDG injection34.Statistical analysis.
Correlations among brain F-18 FDG uptake, clinical and CSF data were analyzed using statistical parametric mapping (SPM8, Wellcome Department of Cognitive Neurology, London, UK) imple-mented in Matlab R2012b (Mathworks, Natick, Massachusset, USA). MMSE scores, sex, age and CSF biomark-ers were used as covariates in each correlation analysis. F-18 FDG PET data have been subjected to affine and non-linear spatial normalization into the Montreal Neurological Institute space. An aging and dementia-specific template for spatial normalization was used35. The spatially normalized set of images were then smoothed with a 8 mm isotropic Gaussian filter to blur for individual variations in gyral anatomy and to increase the signal-to-noise ratio. Images have been globally normalized to 50 using proportional scaling to remove confounding effects to global cerebral glucose consumption changes, with a masking threshold of 0.8. The resulting statistical parametric maps, SPM[t], have been transformed into normal distribution (SPM[z]) unit. Correction of SPM coordinates to match the Talairach coordinates was achieved by the subroutine implemented by Matthew Brett (http://www. mrc-cbu.cam.ac.uk/Imaging). Brodmann areas (BA) have been identified at a range from 0 to 3 mm from the cor-rected Talairach coordinates of the SPM output isocentres, after importing the corcor-rected coordinates, by Talairach client (http://www.talairach.org/index.html). According to Bennett et collegues36, SPM t-maps have been set at p < 0.05, corrected for multiple comparisons with the False Discovery Rate option at voxel level, and at p < 0.01 corrected for multiple comparison at cluster level. Only those clusters containing more than 100 (5 × 5 × 5 voxels, i.e. 11 × 11 × 11 mm) contiguous voxels have been accepted as significant. For correlation analyses in both AD and CG subjects, the voxel-based analyses have been performed using a ‘regression analysis’ design model using sex, age, MMSE and CSF parameters presented in Table 1 as covariates. In SPM maps, we searched the brain areas with a significant correlation using a statistical threshold of p = 0.001, family wise error-corrected for the problem of multiple comparisons, with an extent threshold of 100 voxels.The cluster obtained by this comparison has been exported and further analyzed after a normalization process. In particular, the mean signal intensities computed of each cluster have been normalized within each subject to the average intensities of the cerebellar Volume of Interest as defined by Schmahmann et al.37. For this purpose, WFU_Pickatlas was used38, 39. This choice was based on the knowledge that AD pathological processes poorly affect the cerebellum and on the evidence that, when using cerebellum instead of whole brain counts as the refer-ence region, accuracy in distinguishing AD patients from controls increases40. As proposed in another report of Pagani et al.41, a dataset including cerebellum-normalized F-18 FDG PET values relevant to the examined cluster has been exported. In order to assess that cerebellum-normalized F-18 FDG PET values for the cluster examined were of Gaussian distribution, D’Agostino K squared normality test has been applied (where the null hypothesis is that the data are normally distributed). Spearman’s correlation and linear regression were used in order to investi-gate the relationships among cerebellum-normalized F-18 FDG PET values, thyroid hormones (TSH, T3, T4) and CSF parameters. An hypothesis was considered valid when P-Value was less or equal than 0.05.
Differences in CSF parameters, thyroid hormone values and socio demographic variables in sex were evalu-ated by means of Mann Whitney U test or Two way ANOVA when appropriate (see Table 1).
A ‘two-sample t test’ design model was used for the following voxel-based comparisons between AD and CG: AD versus CG and vice versa.
Connectivity analysis.
Since according to Horowitz et al. all brain regions whose glucose metabolism is cor-related at rest are functionally associated42, a connectivity correlation analysis was performed based on voxel-wise interregional correlation analysis (IRCA) of SPM using resting F-18 FDG PET data using population-based cytoarchitectonic seed brain regions as proposed previously43. In particular, for IRCA, extracted mean regional VOI counts were then normalized (see above) and used as regression factor to find regions showing significant (corrected <0.05) voxel-wise correlations across scans (subjects) using SPM843.Results
General characteristics of AD patients and controls.
General characteristics of the study population are summarized in Table 1. AD patients and CG did not differed in age, sex, and education level. AD patients showed a trend towards reduced TSH (1.38 ± 0.84 vs 1.58 ± 0.73, p = 0.10) and fT4 (1.17 ± 0.17 vs 1.22 ± 0.21, p = 0.08) levels, although not reaching the statistical significance; in contrast fT3 was significantly lower (3.04 ± 0.33 vs 3.18 ± 0.27, p = 0.004).PET/CT scan in AD and controls.
When subtracting AD to CG subjects, SPM analysis showed a significant reduction of brain glucose consumption in a wide portion of right and left temporal, parietal and frontal cortex in AD patients (Table 2).Correlation analysis between TSH and clinical features.
In AD patients, no significant correlation were found between TSH and age, sex, MMSE, amyloid-β 1-42, Tau, and p-Tau. In particular, no correlation was found between TSH and fT3 (R = 0.05, p = 0.61) or fT4 (R = 0.03, p = 0.81). In CG, TSH was significantly corre-lated with fT3 (R = −0.24, p = 0.03) and fT4 (R = −0.26, p = 0.02), but not with age.Correlation between TSH and PET/CT scan in AD patients.
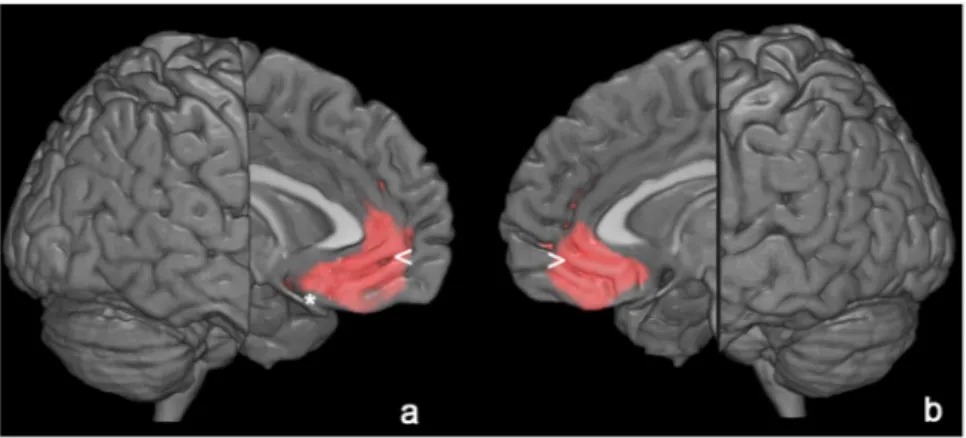
In AD patients, SPM analysis showed a significant positive correlation between serum TSH values and cortical glucose consumption in a wide portion of the anterior cingulate cortex bilaterally (BA 32) and left frontal lobe (BA25) (Table 3, Fig. 1). No significant correlations were found between cortical F-18 FDG uptake and fT3 and fT4 levels.Cerebellum-normalized F-18 FDG PET values for left BA32 were equal to 1.10 ± 0.09 (mean ± standard devi-ation) with a good correlation between TSH levels and normalized F-18 FDG uptake, with high levels of TSH being related to higher levels of F-18 FDG uptake (r = 0.26 and P = 0.01). As for right BA32, values for corti-cal glucose consumption resulted equal to 1.13 ± 0.1, with high levels of TSH being related to higher levels of F-18 FDG uptake (r = 0.27 and P = 0.01). As for left BA25, normalized F-18 FDG PET values resulted equal to 0.96 ± 0.1, with high levels of TSH being related to higher levels of F-18 FDG uptake (r = 0.29 and P = 0.005).
Correlation between CSF parameters and PET/CT scan in AD patients.
A significant correlation was found between CSF t-Tau levels and cortical metabolism in right BA32 (r = −0.25, P = 0.019) and left BA32 (r2 = 0.054 and P = 0.033) while no significant correlation was found in BA25 (r = −0.11; P = 0.29). We did not find significant correlation with p-Tau and cortical activity in right BA32 (r = −0.1; P = 0.34) and left BA32 (r2 = 0.054; P = 0.9) and BA25 (r = −0.12; P = 0.25). Similarly, we did not find significant correlation with Aβ1-42 and cortical activity in right BA32 (r = −0.09; P = 0.37) and left BA32 (r2 = 0.009; P = 0.38) and BA25 (r = −0.15; P = 0.16).Correlation between TSH and CSF parameters or PET/CT scan in controls.
In CG undergoing both CSF assay and PET/CT examination, (13 subjects, 7 women and 6 men) CSF values were in the normal range with t-Tau, p-Tau and Aβ1-42 being equal to 272 ± 84.2, 40.3 ± 10.9 and 818 ± 202.7 pg/ml respectively. In theseAnalysis
Cluster level Voxel level
cluster p
(FWE-corr) cluster p (FDR-corr) Cluster extent Cortical Region Z score of maximum Talairach coordinates Cortical region BA
CG - AD
0.000 0.000 17423 R Parietal 5.19 2, −48, 34 Precuneus 7 R Parietal 5.04 52, −50, 46 Inferior parietal lobule 40 R Temporal 5.00 62, −34, −2 Middle temporal gyrus 21 0.000 0.000 14169 L Parietal 5.35 0, −48, 34 Precuneus 31 L Temporal 5.17 −54, −28, −10 Middle temporal gyrus 21 L Temporal 5.05 −52, −54, −14 Inferior temporal gyrus 20 L Frontal 4.98 −8, 18, −14 Medial frontal gyrus 25 Table 2. Statistical parametric mapping comparisons between 18F-FDG uptake in CG and AD. In the ‘cluster level’ section on left, the number of voxels, the corrected P value of significance and the cortical region where the voxel is found, are all reported for each significant cluster. In the ‘voxel level’ section, all of the coordinates of the correlation sites (with the Z-score of the maximum correlation point), the corresponding cortical region and BA are reported for each significant cluster. L, left; R, right; BA, Brodmann’s area. In the case that the maximum correlation is achieved outside the grey matter, the nearest grey matter (within a range of 5 mm) is indicated with the corresponding BA.
subgroup, TSH, fT3 and fT4 were equal to 1.48 ± 0.38, 2.37 ± 1.02, 1.13 ± 0.12. No correlation was found between TSH, fT3 or fT4 and t-Tau, p-Tau or Aβ1-42.
For converse, SPM regression analysis showed a significant positive correlation (P FWE corr.: 0.004; P FDR corr: 0.004; cluster extent: 5129) between TSH levels and cortical metabolism in the left superior temporal gyrus (BA 39, Talairach coordinates: −44, −50, 28) and in the right precuneus (BA7, Talairach coordinates: 8, −56, 64). TSH was not negatively correlated with F-18 FDG consumption. We did not find any significant relationships with fT3 and fT4 and brain metabolism.
Connectivity analysis.
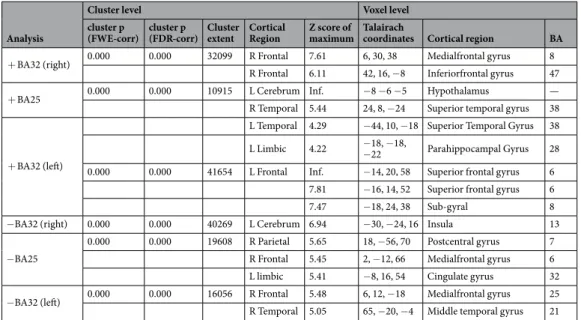
Connectivity analysis showed a significant positive correlation between glucose con-sumption in: a) right BA32 and a wide cortical area in frontal lobe (BA8 and 47); b) left BA25 and a left periven-tricular area (hypothalamus, see Fig. 2) and right temporal cortex (BA38) as shown in Table 3; c) left BA32 and a wide portion of left frontal cortex (BA6 and BA8). A significant negative correlation was found between: a) right BA32 and left BA13 (insula); b) BA25 and a wide portion of right parietal and frontal cortex (BA7 and BA6) and left limbic cortex (BA32); c) left BA32 and a wide portion of right frontal (BA25) and right temporal (BA21) cor-tex. Detailed results with Talairach coordinates are provided in Table 4.Discussion
The present study examined the correlation between TSH levels within the normal range and cerebral glucose metabolism in patients with AD, showing that serum TSH levels are positively correlated with glucose uptake in bilateral anterior cingulate cortex and left medial frontal gyrus. Although literature evidence extensively explored the relationship between TSH levels and cognitive function, results are still conflicting. Previous studies19, 44 reported that subclinical hypothyroidism is associated with cognitive impairment, and that even individuals whose TSH levels are only marginally reduced within the normal range have an increased risk of AD. Otherwise, other investigations45 did not find any relationship between thyroid hormones levels and cognitive function. This discrepancy may be due to variations in the clinical characteristics of participants and the different neuropsycho-logical measures targeting specific cognitive domains such as attention, executive function, and episodic memory. Similarly, our results showed no correlation between thyroid hormones levels and MMSE score. Hence, a more objective method than neuropsychological measures could be necessary to elucidate the influence of thyroid
Analysis
Cluster level Voxel level
cluster p
(FWE-corr) cluster p (FDR-corr) Cluster extent Cortical Region Z score of maximum Talairach coordinates Cortical region BA Positive correlation
0.001 0.000 66950 R Limbic 4.62 14, 46, −4 Anterior Cingulate 32 L Frontal 4.14 −8, 18, −14 Medial Frontal Gyrus 25 L Limbic 4.05 −2, 32, −10 Anterior Cingulate 32
Negative correlation — — — — — — — —
Table 3. Multiple regression analysis showing the TSH related areas of increased 18F FDG brain uptake. In the ‘cluster level’ section on left, the number of voxels, the corrected P value of significance and the cortical region where the voxel is found, are all reported for each significant cluster. In the ‘voxel level’ section, all of the coordinates of the correlation sites (with the Z-score of the maximum correlation point), the corresponding cortical region and Brodmann Area are reported for each significant cluster. L, left; BA, Brodmann’s area. In the case that the maximum correlation is achieved outside the grey matter, the nearest grey matter (within a range of 5 mm) is indicated with the corresponding BA.
Figure 1. 3D rendering of data presented in Table 3 in (a) showing the positive correlation between TSH and brain glucose consumption in left anterior cingulate cortex (<) and medial frontal gyrus (*) and in the right anterior cingulate cortex (b, >). Threshold P < 0.01 corrected for multiple comparisons with false discovery rate at the voxel level. Coordinate and other regional details are presented in Table 3.
Figure 2. T1 magnetic resonance imaging superimposition showing the significant (positive) relationship
between cortical activity in BA25 and that of the region corresponding to the hypothalamus. Since cluster was large as compared to the anatomical region here represented, for illustrative purposes a mask with WFU pickatlas was generated. Coordinates are shown in Table 4.
Analysis
Cluster level Voxel level
cluster p
(FWE-corr) cluster p (FDR-corr) Cluster extent Cortical Region Z score of maximum Talairach coordinates Cortical region BA + BA32 (right) 0.000 0.000 32099 R Frontal 7.61 6, 30, 38 Medialfrontal gyrus 8
R Frontal 6.11 42, 16, −8 Inferiorfrontal gyrus 47 + BA25 0.000 0.000 10915 L Cerebrum Inf. −8 −6 −5 Hypothalamus — R Temporal 5.44 24, 8, −24 Superior temporal gyrus 38
+ BA32 (left)
L Temporal 4.29 −44, 10, −18 Superior Temporal Gyrus 38 L Limbic 4.22 −18, −18, −22 Parahippocampal Gyrus 28 0.000 0.000 41654 L Frontal Inf. −14, 20, 58 Superior frontal gyrus 6
7.81 −16, 14, 52 Superior frontal gyrus 6
7.47 −18, 24, 38 Sub-gyral 8
−BA32 (right) 0.000 0.000 40269 L Cerebrum 6.94 −30, −24, 16 Insula 13 −BA25
0.000 0.000 19608 R Parietal 5.65 18, −56, 70 Postcentral gyrus 7 R Frontal 5.45 2, −12, 66 Medialfrontal gyrus 6 L limbic 5.41 −8, 16, 54 Cingulate gyrus 32 −BA32 (left) 0.000 0.000 16056 R Frontal 5.48 6, 12, −18 Medialfrontal gyrus 25 R Temporal 5.05 65, −20, −4 Middle temporal gyrus 21 Table 4. Regression analysis showing the areas of increased (positive correlation, + ) or decreased (negative
correlation, −) 18F FDG brain uptake related to Brodmann areas 32 (right, left) and 25. In the ‘cluster level’ section on left, the number of voxels, the corrected P value of significance and the cortical region where the voxel is found, are all reported for each significant cluster. In the ‘voxel level’ section, all of the coordinates of the correlation sites (with the Z-score of the maximum correlation point), the corresponding cortical region and BA are reported for each significant cluster. L, left; R, right; BA, Brodmann’s area. In the case that the maximum correlation is achieved outside the grey matter, the nearest grey matter (within a range of 5 mm) is indicated with the corresponding BA.
hormones on the pathology of AD. In this context, to objectively evaluate cerebral metabolism by using PET/TC may provide a more sensitive insight to understand the relationships between thyroid function and AD.
To the best of our knowledge, few studies have been carried out in order to investigate the relationship between thyroid hormones and brain metabolism. Interestingly, Kimura N. et al. found that serum levels of TSH, but not free T3 or free T4, were significantly inversely correlated with regional cerebral blood flow (rCBF) in the middle and inferior temporal regions of right cerebral hemisphere in patients with AD. Control subjects showed no sig-nificant correlation between thyroid hormone levels and rCBF46. The differences in the results from Kimura N. et al. with those of our paper could be explained with the differences in the imaging modalities used. Several studies report a superiority of PET as compared to Single Photon Emission Tomography (SPECT) in the diagnosis of AD. In example, O’Brien JT et al. reported that sensitivity and specificity for dementia/no-dementia was 85% and 90%, respectively, for 18F-FDG PET and 71% and 70%, respectively, for SPECT47. This difference is explained by the higher spatial resolution of PET as compared to SPECT, count sensitivity of detector configurations and by other instrumentation parameters, acquisition and processing techniques, methods and quality of image display48. These technical differences could affect the detection of abnormalities of the radiolabeled compounds distribu-tions especially in small mesial structures (BA32 and 25, Table 3) that are detectable by means of PET and not with SPECT. Moreover, despite both imaging techniques proved to be useful in the evaluation of neurodegenera-tive disorders as AD, the metabolic processes are widely different and to date F-18 FDG is considered as one of the earliest imaging biomarkers of the disease49 with changes in brain glucose metabolism being more pronounced than perfusion abnormalities in AD48. On the other hand, a possible relationship between the blood flow distri-bution changes described in the literature and a hypometabolism in the anterior cingulate cortex and left frontal lobe showed in our population should be considered. The demonstration of the hypothesis request an additional research aimed to investigate the relationships between SPECT and PET data in a selected cohort of AD subjects. As a previous study has shown50, also our AD patients displayed an abnormal biofeedback regulation in hypothalamic-pituitary-thyroid axis. Indeed, we found that AD patients showed a trend towards reduced TSH and fT4 levels, and significantly lower fT3 levels compared to controls. Moreover, we found also a loss of correlation between TSH and fT3 or fT4, with regard to the control subjects, further supporting the concept of an abnormal function of the hypothalamic-pituitary-thyroid axis in AD. Interestingly, the decreased glucose metabolism of anterior cingulate cortex and of the medial frontal gyrus correlated positively with variations in serum TSH levels. Several laboratory studies demonstrated a relationship between thyroid state and factors associated with the pathogenesis of AD, includ-ing beta-amyloid deposition and neuronal apoptosis51. Moreover, thyrotropin releasing hormone (TRH) may affect acetylcholine synthesis and release in the cholinergic neurons of basal forebrain, which are early affected in AD52. Furthermore, previous studies53 showed a reduction in hypothalamic neuronal populations, with shortened dendrites and dystrophic axons, suggesting that this decreased neural density might contribute not only to TRH release, but also to an alteration in circadian rhythms and instability of autonomic regulation. Experiments in animals have shown that after thyroxine application, the mRNA expression of neurotrophins of the nerve-growth-factor (NGF) family is signifi-cantly upregulated both in septum and hippocampus, thus suggesting that modulation of neurotrophin expression con-tributes to the morphological modifications within the hippocampal mossy fiber system and the septo-hippocampal cholinergic system54. From these and recent data, it could be speculated that a reduction of TRH and TSH and other thyroid hormones could affect the synaptic plasticity in AD subjects. Unfortunately, our study lack of a follow up PET/ CT examination (i.e. after 1 or 2 years) that could be helpful for a longitudinal assessment of cortical metabolism in relationship to baseline thyroid hormones concentration in our AD population.
The AD-related anterior cingulate cortex involvement was supported also by the negative correlation between its glucose metabolism and CSF t-Tau levels.
Nevertheless, it remains unclear whether altered TSH levels results from or contribute to the development of AD pathology. In this context, the results from our connectivity analysis may support the hypothesis that the abnormal function of the hypothalamic-pituitary-thyroid axis in AD patients reflect a consequence of impair-ment of the connectivity between medial frontal gyrus and hypothalamus, with a secondary dysfunction of syn-thesis and release thyrotropin releasing hormone (TRH). Although caution should be taken in attempting to relate these findings without further inquiry, this hypothesis seems to be in accordance with the evidence that a dysfunction of the hypothalamic-pituitary-thyroid axis could be associated to AD and further contribute to cognitive impairment in patients with this neurodegenerative disease.
Certainly, it is important to acknowledge the potential limitations of this study. First, no significant differences in TSH levels were found between AD and CG groups. However, the loss of correlation between TSH and fT3 or fT4 probably reflect an AD-related hypothalamic-pituitary-thyroid axis involvement. Further studies considering also the TRH measurements will be necessary to confirm our results in AD patients. Moreover, some endogenous factors are known to negatively affect TRH release. In particular, among these are the neurotransmitter dopa-mine, somatostatin and the cytokines IL 1-beta, IL 6 and TNF alpha55–57. It has been recently pointed out that neuroinflammation, especially in those subjects with external risk factors as systemic inflammation and obesity, is likely to interfere with immunological processes of the brain and further promote disease progression of AD58. More recently, it has been shown that blood brain barrier dysfunction (that has been reported to reflect neuroin-flammation in AD59) is related to a reduced cortical metabolism in left temporal lobe thus suggesting that a more severe cortical dysfunction occur in those AD subjects with neuroinflammation60. Moreover, glucocorticoids and estrogens are known to affect TSH release with stress-related cortisol increase playing a significant role on TSH secretion57. Future studies, possibly on a larger cohort of AD subjects, are necessary in order to evaluate the possible relationships of these biomarkers with TRH, TSH fT3 and fT4 levels in AD.
Our study is limited by the cross-sectional design. Future longitudinal studies should confirm our findings, in order to clarify the relationship between TSH and cerebral glucose metabolism in AD patients.
This study demonstrates that the combined use of thyroid hormones detection and PET/CT can help to better explore the biological correlates of hypothalamic-pituitary-thyroid axis dysfunction in AD patients. In particular,
our results suggest the involvement of the hypothalamic-pituitary-thyroid axis in the cerebral glucose metabolism changes. Therefore, future investigations considering TRH detection (e.g., internal and external parts) or exploit-ing also other structural imagexploit-ing techniques, as magnetic resonance spectroscopy, could add further information to the present findings.
As a last aspect, considering that lower TSH levels were found to be predictive factors of AD progression in subjects with Mild Cognitive Impairment18, from a more clinical point of view, the results of our study suggest that TSH levels within the normal range could be considered during the clinical visit and re-visit of the AD patient since this relatively cheap and widely used biomarker could represent a surrogate indicator of neurological estate of the patient and possibly of disease progression.
References
1. Selkoe, D. J. Deciphering the genesis and fate of amyloid beta-protein yields novel therapies for Alzheimer disease. J Clin Invest 110, 1375–1381 (2002).
2. Perl, D. P. Neuropathology of Alzheimer’s disease and related disorders. Neurol Clin 18, 847–864 (2000).
3. Stromer, T. & Serpell, L. C. Structure and morphology of the Alzheimer’s amyloid fibril. Microsc Res Tech 67, 210–217 (2005). 4. Ashford, J. W., Soultanian, N. S., Zhang, S. X. & Geddes, J. W. Neuropil threads are collinear with MAP2 immunostaining in
neuronal dendrites of Alzheimer brain. J Neuropathol Exp Neurol 57, 972–978 (1998).
5. Fagan, A. M. et al. Cerebrospinal Fluid tau/-Amyloid42 Ratio as a Prediction of Cognitive Decline in Nondemented Older Adults.
Arch Neurol 64, 343–349 (2007).
6. Loosen, P. T. Effects of thyroid hormones on central nervous system in aging. Psychoneuroendocrinology 17, 355–374 (1992). 7. Begin, M. E., Langlois, M. F., Lorrain, D. & Cunnane, S. C. Thyroid Function and Cognition during Aging. Current gerontology and
geriatrics research, 474868, doi:10.1155/2008/474868 (2008).
8. Winkler, A. et al. Thyroid-Stimulating Hormone and Mild Cognitive Impairment: Results of the Heinz Nixdorf Recall Study. Journal
of Alzheimer’s disease: JAD 49, 797–807, doi:10.3233/jad-150561 (2015).
9. Beydoun, M. A. et al. Thyroid hormones are associated with longitudinal cognitive change in an urban adult population.
Neurobiology of aging 36, 3056–3066, doi:10.1016/j.neurobiolaging.2015.08.002 (2015).
10. Roberts, L. M. et al. Is subclinical thyroid dysfunction in the elderly associated with depression or cognitive dysfunction? Annals of
internal medicine 145, 573–581 (2006).
11. Moon, J. H. et al. The effect of long-term thyroid-stimulating hormone suppressive therapy on the cognitive function of elderly patients with differentiated thyroid carcinoma. The Journal of clinical endocrinology and metabolism 99, 3782–3789, doi:10.1210/ jc.2013-4454 (2014).
12. Sunderland, T. et al. TRH stimulation test in dementia of the Alzheimer type and elderly controls. Psychiatry research 16, 269–275 (1985). 13. Lampe, T. H. et al. TSH responses to two TRH doses in men with Alzheimer’s disease. Psychoneuroendocrinology 13, 245–254 (1988). 14. Thomas, D. R. et al. Thyroid status in senile dementia of the Alzheimer type (SDAT). Acta psychiatrica Scandinavica 76, 158–163 (1987). 15. Christie, J. E. et al. Characteristic plasma hormone changes in Alzheimer’s disease. The British journal of psychiatry: the journal of
mental science 150, 674–681 (1987).
16. Gomez, J. M., Aguilar, M. & Soler, J. Growth hormone and thyrotropin hormone secretion in Alzheimer’s disease. The journal of
nutrition, health & aging 4, 229–232 (2000).
17. Kalmijn, S. et al. Subclinical hyperthyroidism and the risk of dementia. The Rotterdam study. Clinical endocrinology 53, 733–737 (2000). 18. Annerbo, S., Wahlund, L. O. & Lokk, J. The significance of thyroid-stimulating hormone and homocysteine in the development of
Alzheimer’s disease in mild cognitive impairment: a 6-year follow-up study. American journal of Alzheimer’s disease and other
dementias 21, 182–188, doi:10.1177/1533317506289282 (2006).
19. van Osch, L. A., Hogervorst, E., Combrinck, M. & Smith, A. D. Low thyroid-stimulating hormone as an independent risk factor for Alzheimer disease. Neurology 62, 1967–1971 (2004).
20. Agarwal, R. et al. A cross-sectional study on thyroid status in North Indian elderly outpatients with dementia. Annals of Indian
Academy of Neurology 16, 333–337, doi:10.4103/0972-2327.116916 (2013).
21. Hoffman, J. M. et al. FDG PET imaging in patients with pathologically verified dementia. J Nucl Med 41, 1920–1928 (2000). 22. Brown, R. K., Bohnen, N. I., Wong, K. K., Minoshima, S. & Frey, K. A. Brain PET in suspected dementia: patterns of altered FDG
metabolism. Radiographics 34, 684–701 (2014).
23. Bohnen, N. I., Djang, D. S., Herholz, K., Anzai, Y. & Minoshima, S. Effectiveness and safety of 18F-FDG PET in the evaluation of dementia: a review of the recent literature. J Nucl Med 53, 59–71 (2012).
24. Puri, K. S., Suresh, K. R., Gogtay, N. J. & Thatte, U. M. Declaration of Helsinki, 2008: implications for stakeholders in research. J
Postgrad Med 55, 131–134 (2009).
25. Varma, A. R. et al. Evaluation of the NINCDS-ADRDA criteria in the differentiation of Alzheimer’s disease and frontotemporal dementia. J Neurol Neurosurg Psychiatry 66, 184–188 (1999).
26. Pierantozzi, M. et al. Different TMS patterns of intracortical inhibition in early onset Alzheimer dementia and frontotemporal dementia. Clin Neurophysiol 115, 2410–2418 (2004).
27. Schillaci, O., Chiaravalloti, A., Travascio, L., Floris, R. & Simonetti, G. F-FDG PET/MR in herpes simplex virus encephalitis: A case study. Rev Esp Med Nucl Imagen Mol 2, 00183–00182 (2014).
28. Alessandrini, M. et al. Early and phasic cortical metabolic changes in vestibular neuritis onset. Plos One 8, 7 (2013).
29. Folstein, M. F., Folstein, S. E. & McHugh, P. R. “Mini-mental state”. A practical method for grading the cognitive state of patients for the clinician. Journal of psychiatric research 12, 189–198 (1975).
30. Schoenberg, M. R. et al. Test performance and classification statistics for the Rey Auditory Verbal Learning Test in selected clinical samples. Archives of clinical neuropsychology: the official journal of the National Academy of Neuropsychologists 21, 693–703, doi:10.1016/j.acn.2006.06.010 (2006).
31. Shin, M. S., Park, S. Y., Park, S. R., Seol, S. H. & Kwon, J. S. Clinical and empirical applications of the Rey-Osterrieth Complex Figure Test. Nature protocols 1, 892–899, doi:10.1038/nprot.2006.115 (2006).
32. Henry, J. D., Crawford, J. R. & Phillips, L. H. Verbal fluency performance in dementia of the Alzheimer’s type: a meta-analysis.
Neuropsychologia 42, 1212–1222, doi:10.1016/j.neuropsychologia.2004.02.001 (2004).
33. Bilker, W. B. et al. Development of Abbreviated Nine-item Forms of the Raven’s Standard Progressive Matrices Test. Assessment 19, 354–369, doi:10.1177/1073191112446655 (2012).
34. Chiaravalloti, A. et al. Functional correlates of t-Tau, p-Tau and Abeta(1)(−)(4)(2) amyloid cerebrospinal fluid levels in Alzheimer’s disease: a (1)(8)F-FDG PET/CT study. Nuclear medicine communications 36, 461–468, doi:10.1097/mnm.0000000000000272 (2015). 35. Della Rosa, P. A. et al. A standardized [18F]-FDG-PET template for spatial normalization in statistical parametric mapping of
dementia. Neuroinformatics 12, 575–593, doi:10.1007/s12021-014-9235-4 (2014).
36. Bennett, C. M., Wolford, G. L. & Miller, M. B. The principled control of false positives in neuroimaging. Social cognitive and affective
neuroscience 4, 417–422, doi:10.1093/scan/nsp053 (2009).
37. Schmahmann, J. D. et al. Three-dimensional MRI atlas of the human cerebellum in proportional stereotaxic space. NeuroImage 10, 233–260, doi:10.1006/nimg.1999.0459 (1999).
38. Lancaster, J. L. et al. Automated labeling of the human brain: a preliminary report on the development and evaluation of a forward-transform method. Human brain mapping 5, 238–242, doi:10.1002/(sici)1097-0193(1997)5:4<238::aid-hbm6>3.0.co;2-4 (1997). 39. Maldjian, J. A., Laurienti, P. J., Kraft, R. A. & Burdette, J. H. An automated method for neuroanatomic and cytoarchitectonic
atlas-based interrogation of fMRI data sets. NeuroImage 19, 1233–1239 (2003).
40. Soonawala, D. et al. Statistical parametric mapping of (99m)Tc-HMPAO-SPECT images for the diagnosis of Alzheimer’s disease: normalizing to cerebellar tracer uptake. NeuroImage 17, 1193–1202 (2002).
41. Pagani, M. et al. Volume of interest-based [18F]fluorodeoxyglucose PET discriminates MCI converting to Alzheimer’s disease from healthy controls. A European Alzheimer’s Disease Consortium (EADC) study. NeuroImage. Clinical 7, 34–42, doi:10.1016/j. nicl.2014.11.007 (2015).
42. Horwitz, B., Duara, R. & Rapoport, S. I. Intercorrelations of glucose metabolic rates between brain regions: application to healthy males in a state of reduced sensory input. Journal of cerebral blood flow and metabolism: official journal of the International Society of
Cerebral Blood Flow and Metabolism 4, 484–499, doi:10.1038/jcbfm.1984.73 (1984).
43. Lee, D. S. et al. Metabolic connectivity by interregional correlation analysis using statistical parametric mapping (SPM) and FDG brain PET; methodological development and patterns of metabolic connectivity in adults. European journal of nuclear medicine and
molecular imaging 35, 1681–1691, doi:10.1007/s00259-008-0808-z (2008).
44. Ganguli, M., Burmeister, L. A., Seaberg, E. C., Belle, S. & DeKosky, S. T. Association between dementia and elevated TSH: a community-based study. Biological psychiatry 40, 714–725, doi:10.1016/0006-3223(95)00489-0 (1996).
45. Stern, R. A. et al. Preliminary study of the relationship between thyroid status and cognitive and neuropsychiatric functioning in euthyroid patients with Alzheimer dementia. Cognitive and behavioral neurology: official journal of the Society for Behavioral and
Cognitive Neurology 17, 219–223 (2004).
46. Kimura, N. et al. Relationship between thyroid hormone levels and regional cerebral blood flow in Alzheimer disease. Alzheimer
disease and associated disorders 25, 138–143, doi:10.1097/WAD.0b013e3181f9aff2 (2011).
47. O’Brien, J. T. et al. 18F-FDG PET and perfusion SPECT in the diagnosis of Alzheimer and Lewy body dementias. Journal of nuclear
medicine: official publication, Society of Nuclear Medicine 55, 1959–1965, doi:10.2967/jnumed.114.143347 (2014).
48. Silverman, D. H. Brain 18F-FDG PET in the diagnosis of neurodegenerative dementias: comparison with perfusion SPECT and with clinical evaluations lacking nuclear imaging. Journal of nuclear medicine: official publication, Society of Nuclear Medicine 45, 594–607 (2004).
49. Aisen, P. S. et al. Clinical Core of the Alzheimer’s Disease Neuroimaging Initiative: progress and plans. Alzheimer’s & dementia: the
journal of the Alzheimer’s Association 6, 239–246, doi:10.1016/j.jalz.2010.03.006 (2010).
50. Yong-Hong, L., Xiao-Dong, P., Chang-Quan, H., Bo, Y. & Qing-Xiu, L. Hypothalamic-pituitary-thyroid axis in patients with Alzheimer disease (AD). Journal of investigative medicine: the official publication of the American Federation for Clinical Research 61, 578–581, doi:10.2310/JIM.0b013e318280aafb (2013).
51. Davis, J. D. et al. Thyroid hormone levels in the prefrontal cortex of post-mortem brains of Alzheimer’s disease patients. Current
aging science 1, 175–181 (2008).
52. Perry, E. K. The cholinergic system in old age and Alzheimer’s disease. Age and ageing 9, 1–8 (1980).
53. Baloyannis, S. J., Mavroudis, I., Mitilineos, D., Baloyannis, I. S. & Costa, V. G. The hypothalamus in Alzheimer’s disease: a Golgi and electron microscope study. American journal of Alzheimer’s disease and other dementias 30, 478–487, doi:10.1177/1533317514556876 (2015).
54. Roskoden, T., Heese, K., Otten, U. & Schwegler, H. Modulation of mRNA expression of the neurotrophins of the nerve-growth-factor family and their receptors in the septum and hippocampus of rats after transient postnatal thyroxine treatment. II. Effects on
p75 and trk receptor expression. Experimental brain research 127, 307–313 (1999).
55. Spangelo, B. L., Judd, A. M., Isakson, P. C. & MacLeod, R. M. Interleukin-6 stimulates anterior pituitary hormone release in vitro.
Endocrinology 125, 575–577, doi:10.1210/endo-125-1-575 (1989).
56. Haugen, B. R. Drugs that suppress TSH or cause central hypothyroidism. Best practice & research. Clinical endocrinology &
metabolism 23, 793–800, doi:10.1016/j.beem.2009.08.003 (2009).
57. Nussey, S. & Whitehead, S. In Endocrinology: An Integrated Approach (BIOS Scientific Publishers BIOS Scientific Publishers Limited., 2001).
58. Heneka, M. T. et al. Neuroinflammation in Alzheimer’s disease. The Lancet. Neurology 14, 388–405, doi: 10.1016/s1474-4422(15)70016-5 (2015).
59. de Vries, H. E. et al. Inflammatory events at blood-brain barrier in neuroinflammatory and neurodegenerative disorders: implications for clinical disease. Epilepsia 53(Suppl 6), 45–52, doi:10.1111/j.1528-1167.2012.03702.x (2012).
60. Chiaravalloti, A. et al. Is cerebral glucose metabolism related to blood–brain barrier dysfunction and intrathecal IgG synthesis in Alzheimer disease? A 18F-FDG PET/CT study. Medicine 95, doi:10.1097/md.0000000000004206 (2016).
Author Contributions
Agostino Chiaravalloti, Orazio Schillaci, Francesco Ursini, Alessandro Fiorentini: designed the research study. Agostino Chiaravalloti, Alessandro Martorana, Giacomo Koch, Mario Tavolozza, Gaetano Barbagallo: performed the research; wrote the paper. Agostino Chiaravalloti, Alessandro Fiorentini, Franceco Ursini: data analysis.
Additional Information
Competing Interests: The authors declare that they have no competing interests.
Publisher's note: Springer Nature remains neutral with regard to jurisdictional claims in published maps and
institutional affiliations.
Open Access This article is licensed under a Creative Commons Attribution 4.0 International
License, which permits use, sharing, adaptation, distribution and reproduction in any medium or format, as long as you give appropriate credit to the original author(s) and the source, provide a link to the Cre-ative Commons license, and indicate if changes were made. The images or other third party material in this article are included in the article’s Creative Commons license, unless indicated otherwise in a credit line to the material. If material is not included in the article’s Creative Commons license and your intended use is not per-mitted by statutory regulation or exceeds the perper-mitted use, you will need to obtain permission directly from the copyright holder. To view a copy of this license, visit http://creativecommons.org/licenses/by/4.0/.