2020-07-09T12:45:27Z
Acceptance in OA@INAF
Anatomy of the AGN in NGC 5548. IV. The short-term variability of the outflows
Title
Di Gesu, L.; Costantini, E.; Ebrero, J.; Mehdipour, M.; Kaastra, J. S.; et al.
Authors
10.1051/0004-6361/201525934
DOI
http://hdl.handle.net/20.500.12386/26411
Handle
ASTRONOMY & ASTROPHYSICS
Journal
579
Number
DOI:10.1051/0004-6361/201525934 c
ESO 2015
Astrophysics
&
Anatomy of the AGN in NGC 5548
IV. The short-term variability of the outflows
L. Di Gesu
1, E. Costantini
1, J. Ebrero
2, M. Mehdipour
1, J. S. Kaastra
1,3, F. Ursini
4,5,6, P. O. Petrucci
4,5, M. Cappi
7,
G. A. Kriss
8,9, S. Bianchi
6, G. Branduardi-Raymont
10, B. De Marco
11, A. De Rosa
12, S. Kaspi
13, S. Paltani
14,
C. Pinto
15, G. Ponti
11, K. C. Steenbrugge
16,17, and M. Whewell
101 SRON Netherlands Institute for Space Research, Sorbonnelaan 2, 3584 CA Utrecht, The Netherlands e-mail: [email protected]
2 XMM-Newton Science Operations Centre, ESA, PO Box 78, 28691 Villanueva de la Canada, Madrid, Spain 3 Leiden Observatory, Leiden University, Post Office Box 9513, 2300 RA Leiden, The Netherlands
4 Univ. Grenoble Alpes, IPAG, 38000 Grenoble, France 5 CNRS, IPAG, 38000 Grenoble, France
6 Dipartimento di Matematica e Fisica, Università degli Studi Roma Tre, via della Vasca Navale 84, 00146 Roma, Italy 7 INAF-IASF, Bologna, via Gobetti 101, 40129 Bologna, Italy
8 Space Telescope Science Institute, 3700 San Martin Drive, Baltimore, MD 21218, USA
9 Department of Physics and Astronomy, The John Hopkins University, Baltimore, MD 21218, USA
10 Mullard Space Science Laboratory, University College London, Holmbury St. Mary, Dorking, Surrey, RH5 6NT, UK 11 Max-Planck-Institute fur extraterrestrische Physik, Giessebachstrasse, 85748 Garching, Germany
12 INAF/IAPS, via Fosso del Cavaliere 100, 00133 Roma, Italy
13 Department of Physics, Technion-Israel Institute of Technology, 32000 Haifa, Israel
14 Department of Astronomy, University of Geneva, 16 Ch. d’Ecogia, 1290 Versoix, Switzerland 15 Institute for Astronomy, University of Cambridge, Madingley Rd, Cambridge, CB3 0HA, UK
16 Instituto de Astronomia, Universidad Catolica del Norte, Avenida Angamos 0610, 1280 Casilla, Antofagasta, Chile 17 Department of Physics,University of Oxford, Keble Road, Oxford, OX1 3RH, UK
Received 20 February 2015/ Accepted 5 May 2015
ABSTRACT
During an extensive multiwavelength campaign that we performed in 2013−2014, we found the prototypical Seyfert 1 galaxy NGC 5548 in an unusual condition of heavy and persistent obscuration. The newly discovered “obscurer” absorbs most of the soft X-ray continuum along our line of sight and lowers the ionizing luminosity received by the classical warm absorber. We present the analysis of the high resolution X-ray spectra collected with XMM-Newton and Chandra throughout the campaign, which are suitable to investigate the variability of both the obscurer and classical warm absorber. The time separation between these X-ray observations range from two days to eight months. On these timescales the obscurer is variable both in column density and in covering fraction. This is consistent with the picture of a patchy wind. The most significant variation occurred in September 2013 when the source brightened for two weeks. A higher and steeper intrinsic continuum and a lower obscurer covering fraction are both required to explain the spec-tral shape during the flare. We suggest that a geometrical change of the soft X-ray source behind the obscurer causes the observed drop in the covering fraction. Because of the higher soft X-ray continuum level, the September 2013 Chandra spectrum is the only X ray spectrum of the campaign in which individual features of the warm absorber could be detected. The spectrum shows absorption from Fe-UTA, O
, and O
, consistent with belonging to the lower-ionization counterpart of the historical NGC 5548 warm absorber. Hence, we confirm that the warm absorber has responded to the drop in the ionizing luminosity caused by the obscurer.Key words.Galaxy: abundances – quasars: absorption lines – X-rays: galaxies
1. Introduction
In the X-ray band, active galactic nuclei (AGN) are variable emitters. The origin of this variability, which can be even large and fast (e.g., Matt et al. 2003), is not fully understood yet (see e.g. McHardy et al. 2006;Turner et al. 2009;Ponti et al. 2012). Variable absorption of the X-ray radiation along the line of sight is one of the possible explanations. Indeed, many ab-sorbing components, spanning a broad range in ionization, can be detected in AGN X-ray spectra.
Cold neutral absorption is able to strongly suppress the soft X-ray flux and to change the curvature of the X-ray spec-trum. In recent years, evidence for variability due to cold X-ray
absorption in both type 1 and type 2 AGN has increased. In many cases, changes in the absorber column density and/or cov-ering fraction, on timescales of a few hours or a few years, have been reported, e.g., in NGC 4388 (Elvis et al. 2004), NGC 4151 (Puccetti et al. 2007), and 1H 0557-385 (Coffey et al. 2014). On these same timescales, the X-ray absorbing column density may even drastically switch from Compton thick to Compton thin as observed in several type 2 AGN, e.g., NGC 7582 (Piconcelli et al. 2007), UGC 4203 (Risaliti et al. 2010), and NGC 454 (Marchese et al. 2012). This rich phenomenology suggests that cold gas is present even in the innermost region of AGN (see
Bianchi et al. 2012). This material is probably patchy and may belong to the broad line region (BLR) or to a clumpy torus
0.1 0.2 0.3 0.4 count s −1 Swift XRT (0.3−1.5 keV) 0.2 0.4 0.6 0.8 count s −1 Swift XRT (1.5−10 keV) 0 50 100 150 200 Days (MJD) − 56465 0.0 1.0 2.0 3.0 4.0 10 −17 W m −2 AÅ
−1 Swift UVOT (UVW2)
Fig. 1.From top to bottom panel: observed light curves of NGC 5548 in
two X-ray bands and in the UV (λ = 2030 Å). These curves are ob-tained from the daily Swift monitoring performed during our campaign. In each panel, the pink horizontal dashed line marks the flux level measured by Swift at unobscured epochs (2005 and 2007). From left to right, vertical lines indicate first and last XMM-Newton observation of summer 2013 (dashed lines), the three Chandra observations of September 2013 (dotted lines), and the last two observations of the XMM-Newtonprogram (in December 2013 and February 2014, dashed lines).
(e.g.,Miniutti et al. 2014). In the best studied Seyfert 1.8 source, NGC 1365, a single cloud was monitored while eclipsing the central X-ray source for a few hours (Risaliti et al. 2009). In the last decade, this source was observed in a vast variety of spectral appearances, ranging from Compton thick (Risaliti et al. 2005) to an almost unobscured condition more reminiscent of a pure type 1 AGN (Walton et al. 2014).
Absorbers at higher ionization (the so-called warm ab-sorbers, WA) imprint discrete absorption lines on ∼50% of type 1 AGN spectra (Crenshaw et al. 2003b). These features, which fall mainly in the soft X-ray (e.g., from Ne
−Ne
, Fe
−Fe
, and O
−O
) and in the UV (e.g., O
, Mg
, C
−C
, and Si
−Si
) domain, are usually blueshifted with respect to the systemic velocity, therefore indicating a global outflow of the absorbing gas (Crenshaw et al. 2003b). In lo-cal Seyfert 1 galaxies, absorption lines usually have a narrow profile (FWHM ∼ 102 km s−1). In about 15% of optically se-lected quasars (Weymann et al. 1991), broad absorption lines (BAL) with a typical width of 104 km s−1have also beenob-served (Hamann & Sabra 2004). In the last ten years, obser-vational campaigns providing simultaneous high resolution UV and X-ray spectroscopy have been performed for a handful of local AGN (see Costantini 2010, for a review). In some cases (e.g., NGC 4151, Kraemer et al. 2005, Mrk 279, Arav et al. 2007;Costantini et al. 2007, 1H 0419-577Di Gesu et al. 2013), it has been established that X-ray and UV narrow absorption lines (NAL) may be the manifestation of the same outflow, even though it is not trivial to determine how the X-ray and UV ab-sorbing gas are physically and geometrically related. The UV and X-ray absorbing gas could be colocated (e.g., Mrk 509,
Ebrero et al. 2011), and the UV absorbing components could be denser clumps embedded in a more highly ionized wind (e.g., NGC 4051, Kraemer et al. 2012). The WAs complex multicom-ponent winds spanning a broad range in velocity and in ioniza-tion. The lower ionization components produce the UV lines,
while the higher ionization phases are only seen in the X-rays. An intermediate phase producing absorption lines in both bands may in some cases be present.
Variability in the warm absorption may in principle con-tribute to the overall X-ray variability of AGN on different timescales. To assess the WA variability on long (e.g., ∼years) timescales it is necessary that high quality multiepoch spec-troscopy is available, which is seldom the case. A multiepoch study of the WA was attempted, for instance, in Mrk 279 (Ebrero et al. 2010) without finding significant variability. In a
differ-ent case (Mrk 841,Longinotti et al. 2010), comparing two dif-ferent observations taken ∼4 years apart, a moderate decrease in the WA ionization as the continuum dims was observed. An even more noticeable long-term WA variability was reported in the case of Mrk 335 (Longinotti et al. 2013), where the emer-gence of an ionized outflow that was not historically present was observed in 2009. On shorter timescales, changes in the WA opacity or ionization were observed for instance in NGC 3783 (∼31 days,Krongold et al. 2005) and NGC 4051 (few ks−few months,Krongold et al. 2007;Steenbrugge et al. 2009).
The timescale over which absorption lines are observed to vary can be used to measure the distance of the absorbing gas from the ionizing source (seeCrenshaw et al. 2003b). Indeed, for photoionized gas in equilibrium, the recombination timescale depends on the gas number density n. Besides the distance r, the gas density is the only other unknown parameter in the definition of ionization parameter ξ= Lion/nr2(where Lionis the ionizing
luminosity in the 1−1000 Ryd band). Searching for absorption line variability on short timescales and thus constraining the lo-cation of the WA is the main motivation for conducting monitor-ing campaigns of AGN (e.g., Mrk 509, seeKaastra et al. 2012). The knowledge of the location is crucial to estimate the mass outflow rates and kinetic luminosities associated with these ab-sorbers (e.g.,Crenshaw & Kraemer 2012), and thus, to evaluate their potential impact on the host galaxy environment.
With this aim, during the summer of 2013 and the winter of 2013-14 we performed a large multiwavelength monitoring campaign on the bright Seyfert 1 NGC 5548. The overview of the campaign is presented inMehdipour et al.(2015, hereafter Paper I). NGC 5548 is a prototypical Seyfert 1 galaxy, which has been studied for decades from optical (e.g.,Peterson & Wandel 1999) to X-ray wavelengths (e.g.,Nandra et al. 1993;Iwasawa et al. 1999). From a dynamical modeling of the BLR (Pancoast et al. 2014), it is inferred that this source is observed at an in-clination angle of ∼30◦ and hosts a supermassive black hole
(SMBH) of ∼3 × 10⁷ M in its center. Previously, high
resolu-tion UV (Crenshaw & Kraemer 1999;Crenshaw et al. 2003a) and X-ray (Kaastra et al. 2000,2002;Steenbrugge et al. 2003,
2005) spectra have revealed several deep NAL that can be as-cribed to a moderate velocity (vout = 200−1200 km s−1) ionized
outflow.
Unexpectedly, throughout the whole 2013-14 campaign, NGC 5548 appeared dramatically different than it appeared in the past (e.g., from the Chandra observation of 2002,
Steenbrugge et al. 2005): the object was ∼25 times less lumi-nous in the soft X-rays. Moreover, NGC 5548 showed broad, asymmetric absorption troughs in the blue wings of the main UV broad emission lines (e.g., in Ly α, C
, N
). InKaastra et al.(2014, hereafter K14), we proposed that all these changes can be ascribed to the onset of a persistent, weakly ionized, fast (v ∼ 5000 km s−1), wind (hereafter “the obscurer”). The obscureris located within or just outside the BLR, at a distance of a few light days from the SMBH, and may have been launched from the accretion disk. It blocks ∼90% of the X-ray flux along our
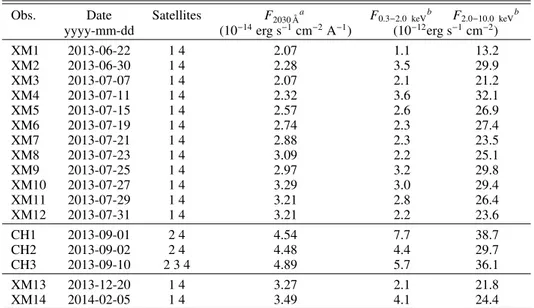
Table 1. List of XMM-Newton and Chandra data sets used for present analysis.
Obs. Date Satellites F2030 Åa F
0.3−2.0 keVb F2.0−10.0 keVb yyyy-mm-dd (10−14erg s−1cm−2A−1) (10−12erg s−1cm−2)
XM1 2013-06-22 1 4 2.07 1.1 13.2 XM2 2013-06-30 1 4 2.28 3.5 29.9 XM3 2013-07-07 1 4 2.07 2.1 21.2 XM4 2013-07-11 1 4 2.32 3.6 32.1 XM5 2013-07-15 1 4 2.57 2.6 26.9 XM6 2013-07-19 1 4 2.74 2.3 27.4 XM7 2013-07-21 1 4 2.88 2.3 23.5 XM8 2013-07-23 1 4 3.09 2.2 25.1 XM9 2013-07-25 1 4 2.97 3.2 29.8 XM10 2013-07-27 1 4 3.29 3.0 29.4 XM11 2013-07-29 1 4 3.21 2.8 26.4 XM12 2013-07-31 1 4 3.21 2.2 23.6 CH1 2013-09-01 2 4 4.54 7.7 38.7 CH2 2013-09-02 2 4 4.48 4.4 29.7 CH3 2013-09-10 2 3 4 4.89 5.7 36.1 XM13 2013-12-20 1 4 3.27 2.1 21.8 XM14 2014-02-05 1 4 3.49 4.1 24.4
Notes. Instruments are labeled with numbers, as followed: 1: XMM-Newton, 2: Chandra, 3: NUSTAR, and 4: Swift.(a) UV flux measured by Swift-UVOT, corrected for reddening.(b)Observed flux in the quoted bands, as derived from our best-fit model.
line of sight, thereby lowering the ionizing luminosity received by the WA. Indeed, in this obscured condition, the historical NGC 5548 WA is still present, but with a lower ionization. In the X-rays, the WA is consistent with being ∼3 times less ion-ized than what was observed in 2002 (K14), and, at the same time, in the UV it shows new lower-ionization NAL (from, e.g., C
and C
,Arav et al. 2015).In this paper, we use all the high resolution X-ray spectra collected during our campaign to assess what drives the spectral changes of NGC 5548 on timescales as short as few days. This is the typical time separation between the X-ray observations of the campaign. These spectra are suitable to investigate the absorption variability because they cover the energy band where the main ionized and neutral absorption features of, e.g., oxygen and iron, fall. During the campaign, the source was always weak in the soft X-rays, except for a sudden brightening in September 2013 (Fig.1). On that occasion, we triggered a Chandra-LETGS observation. In the following, we also investigate the possible causes and consequences of this sudden brightening.
The paper is organized as follows: in Sect. 2 we briefly present the data sets that we use in this analysis, and in Sect.3
we describe the template spectral model that we apply to all the data sets in Sect.4. Finally in Sect.5we discuss our results, and in Sect.6we outline the conclusions.
The C-statistic (Cash 1979) is used throughout the paper, and er-rors are quoted at 68% confidence level (∆C = 1.0). In all the spectral models presented in the following, we use the Galactic hydrogen column density fromWakker et al.(2011, NH=1.45×
1020 cm−2). The cosmological redshift that we adopted for
NGC 5548 is 0.017175 (de Vaucouleurs et al. 1991).The cosmo-logical parameters are set to: H0 = 70 km s−1Mpc−1,Ωm= 0.3
andΩΛ= 0.7. 2. The data
The XMM-Newton observed NGC 5548 between June 2013 and February 2014 using both the EPIC cameras (Turner et al. 2001;
Strüder et al. 2001) and the Reflection Grating Spectrometer
(RGS,den Herder et al. 2001). The core of the campaign con-sisted of 12, ∼50 ks long, XMM-Newton observations that were taken every ∼2−8 days in June and July 2013. After these, two other observations were acquired in December 2013 and February 2014, providing 14 XMM-Newton data sets in total. The details of all the observations, which we hereafter label in chronological order as XM1−XM14, are given in Table 1. During the entire campaign, the source was also monitored daily by Swift (Gehrels et al. 2004), both in the X-rays with the X-Ray Telescope (XRT,Burrows et al. 2005) and in the UV with the UV Optical Telescope (UVOT, Roming et al. 2005). Swift-UVOT flux measurements in the UVW2 (λ= 2030 Å) filter, corrected for reddening and for the host galaxy contribution as explained in Paper I, are also used in the present analysis.
In September 2013 we triggered a Chandra observation be-cause Swift observed a sudden brightening (Fig.1). The observa-tion was performed with the Low Energy Transmission Grating Spectrometer (LETGS,Brinkman et al. 2000) in combination with the High Resolution Camera (HRC-S). The observing time was split into three observations (Obs. CH1−CH3) of 30, 67, and 123 ks. The first two were taken on September 1st and 2nd, while the third and longest observation was taken a week later on September 10th. Simultaneously with this observation a higher energy spectrum was acquired with the Nuclear Spectroscopic Telescope Array (NuSTAR,Harrison et al. 2013) satellite. In the occasion of this flaring event, no XMM-Newton observation was available.
A detailed description of the data reduction procedure for all the instruments is given in Paper I. In the present analysis, we fit the high resolution RGS and LETGS spectra. The simultaneous EPIC-pn and NuSTAR spectra at higher, less absorbed energies provide the continuum baseline over which the absorption is su-perposed.Ursini et al.(2015, hereafter U15) provide a detailed modeling of the continuum at high energies.
As in K14, we fitted the EPIC-pn in the 1.03−10.0 Å ('1.24−12 keV) band together with the RGS in the 5.68−38.23 Å ('0.32−2.2 keV) band. Thus, the two instru-ments overlap in a small band allowing us to check for possible
intercalibration mismatches. In all our fits, the intercalibration factor used in K14 (∼1.027) was adequate. Because of an in-complete correction for the gain of the EPIC-pn (not corrected in the SAS v13 we used, see Paper I), the Fe Kα line appears blueshifted (see Cappi et al. in prep. for a detailed discussion), which we correct for with an artificial redshift for these spectra. However, this solution leads to a poor fit near the energy of the gold M-edge of the telescope mirror. For this reason, we omitted the interval 5.0−6.2 Å ('2.0−2.5 keV) from all our fits.
We fitted the Chandra-LETGS spectra between 2 and 40 Å ('0.3−6.2 keV). We used the NuSTAR spectrum simultaneous to CH3 in the 0.2−2.5 Å ('5−60 keV) band. Since Chandra-LETGS and NuSTAR were consistent in the overlapping band, we did not apply any intercalibration correction in the joint fit.
3. The template model
To assess the variability of NGC 5548, we used the same tem-plate model to fit all the spectra. This temtem-plate is close to the model adopted in K14, differing from it only in the modeling of the “soft-excess” (Arnaud et al. 1985) component. We per-formed all the spectral analysis with the latest version of SPEX (v. 2.05,Kaastra et al. 1996). In our template model, we consid-ered the cosmological redshift and the Galactic absorption. For the latter, we use a collisionally ionized plasma model (HOT), with a nominal temperature of 0.5 eV for a neutral gas.
Our continuum model includes a primary and reflected power law, on top of which lies a soft-excess component. In NGC 5548 the reflection is consistent with being constant (see U15), thus producing a steady narrow Fe Kα line (see Cappi et al., in prep.). In the present analysis we used the reflection pa-rameters obtained in U15, i.e.,Γ = 1.9 and Ecut = 300 keV for
the photon index and the high energy cutoff of the primary power law, in the SPEX reflection model REFL. This model includes both a Compton reflected continuum (Magdziarz & Zdziarski 1995) and the Fe Kα line (Zycki & Czerny 1994). To adjust the fit of the Fe Kα line, we allowed the normalization of REFL to be free to vary within the errors of the U15 model. When using EPIC-pn data, we applied to REFL an artificial blueshift (z= −1.25×10⁻²) to correct for an apparent centroid shift of the Fe Kα line (see also Sect.2).
The X-ray obscuration affects the spectrum mainly below 2.0 keV and therefore makes the detection of the soft excess from X-ray spectra elusive. Nevertheless, this component contributes to the continuum in the band where most of the absorption is seen, thus its modeling is critical for evaluating the absorption variability. In Paper I we show that the soft-excess component is likely to be the tail of a component extending from UV to soft X-rays, which is produced by Compton up-scattering of the disk photons in a warm, optically thick plasma. Therefore, in this framework, the UV emission (which is not affected by the obscuration) is a proxy for the X-ray soft excess. We used COMT (based onTitarchuk 1994) to model the soft-excess com-ponent and we used the UV flux (F2030 Å) listed in Table1for each observation to set the normalization. The 0.3−2.0 keV lu-minosity of the soft-excess is given by: (LCOMT0.3−2.0 keV/1034 W) = 2.093+ 2.893 × (F2030 Å/10−34 Jy), valid for the range of ob-served UV fluxes used here (Mehdipour, private communica-tion). Hence, consistent with the long-term variability analysis in Mehdipour et al. (in prep.), we kept the COMT component constant in shape in all the fits, with its 0.3−2.0 keV flux vary-ing accordvary-ing to the UV flux. We use the mean values given in Paper I for the other COMT parameters, namely the Wien
temperature of the incoming photons (T0 = 0.8 eV), the
tem-perature (T1 = 0.17 keV), and the optical depth (τ = 21) of the
plasma.
A detailed modeling of the X-ray emission features of NGC 5548 will be presented in Whewell et al, in preparation. The X-ray narrow emission lines are consistent with being con-stant during the XMM-Newton campaign, and thus could be kept frozen in all our fits. For the narrow lines, we obtained the values in the K14 fit, while for the broad emission features we used the fluxes given inSteenbrugge et al.(2005).
In K14, we found that the obscurer causing the persistent flux dimming of NGC 5548 comprises two ionization phases (here-after labeled as “warm” and “cold"). The warm phase is mildly ionized (log ξ= −1.25) and has a larger covering fraction (e.g., CV, warm ∼ 86%, CV, cold ∼ 30%, K14) and a lower column
density (e.g., NH, warm ∼ 1022 cm−2, NH, cold ∼ 1023 cm−2,
K14) than the cold phase, which is consistent with being neu-tral. In SPEX, we used a photoionized absorber model (XABS) for both the obscurer components and we adopted for them the same kinematics (outflow and broadening velocity) used in K14. The ionization balance for both the obscurer components is com-puted using the intrinsic, unabsorbed spectral energy distribution (SED).
Finally, we included six more XABS components in the tem-plate model to account for the lower ionized counterpart of the historical NGC 5548 warm absorber. The ionization balance for all the WA components is computed using a SED filtered by the obscurer. We label the WA components with capital letters, from A to F as the ionization increases. As in K14, we assumed that the WA varies only in ionization when the ionizing SED illu-minating it changes. Indeed, from UV spectra we know that the kinematics of the WA components has not changed over at least 16 years, and Ebrero et al. (in prep.) shows no historical evidence for total hydrogen column density variations. We kept therefore the kinematics and the equivalent hydrogen column density of all the WA components frozen to the parameters obtained from the unobscured 2002 spectrum (see the updated fit in Ebrero et al., in prep.).
In the following, we apply this template model to all the XMM-Newtonand Chandra data sets of our monitoring cam-paign. In all the fits, the free parameters are the slope and the normalization of the primary power law, column density, and covering fraction of the two obscurer phases. Besides these, in the fits of those data sets in which either the continuum or the obscurer parameters change significantly, we also allow the ion-ization parameters of the warm absorber to vary. The variability in flux of the soft excess component was determined directly from the Swift UV flux, as explained above.
4. Fitting the variability
4.1. The core of the campaign: from June to August 2013 The XMM-Newton monitoring campaign began on June 22nd, catching NGC 5548 at the lowest flux level observed in any of the high resolution spectra of the campaign (F0.3−2.0 keV∼ 1.1 ×
10−12 erg s−1cm−2, for Obs. XM1, see Table 1). Throughout all the summer of 2013, (Obs. XM2−XM12) the 0.3−2.0 keV flux remained quite stable (within a factor ∼1.3) around an average level of ∼2.7 × 10⁻¹² erg s−1cm−2. The stacked
XMM-Newtonspectrum of Obs. XM1−XM12 is published in K14. In that paper, we consistently determine both the average obscurer parameters and the average obscured SED illuminating
Table 2. Best-fit parameters and errors, for the individual XMM-Newton and Chandra observations.
Obscurer componentsa WA componentsb
Obs Γc N
H, warmd CV, warme NH, coldd CV, colde ξAf ξBf ξCf ξDf ξEf ξFf C/Expected Cg
(1022cm−2) (1022cm−2) (log erg cm s−1) XM1 1.5∗∗ 1.7 ± 0.1 0.86 ± 0.01 12 ± 1 0.47 ± 0.02 0.33∗ 1.06∗ 1.70∗ 1.91∗ 2.48∗ 2.67∗ 384/334 XM2 1.58 ± 0.03 1.04 ± 0.04 0.927 ± 0.005 10 ± 2 0.170 ± 0.03 422/345 XM3 1.5∗∗ 1.42 ± 0.06 0.909 ± 0.005 11 ± 3 0.18 ± 0.02 379/337 XM4 1.60 ± 0.03 1.17 ± 0.04 0.922 ± 0.004 14 ± 2 0.19 ± 0.03 406/346 XM5 1.57 ± 0.03 1.44 ± 0.05 0.915 ± 0.004 8 ± 1 0.24 ± 0.03 435/335 XM6 1.5∗∗ 1.4 ± 0.1 0.916 ± 0.005 5 ± 1 0.30 ± 0.08 415/341 XM7 1.5∗∗ 1.40 ± 0.05 0.909 ± 0.005 12 ± 2 0.27 ± 0.03 394/340 XM8 1.53 ± 0.03 1.62 ± 0.07 0.88 ± 0.05 9 ± 1 0.35 ± 0.03 389/339 XM9 1.64 ± 0.03 1.58 ± 0.05 0.896 ± 0.004 11 ± 2 0.24 ± 0.03 390/340 XM10 1.57 ± 0.03 1.43 ± 0.05 0.911 ± 0.004 9 ± 1 0.24 ± 0.03 434/344 XM11 1.56 ± 0.03 1.46 ± 0.05 0.902 ± 0.004 10 ± 2 0.23 ± 0.03 399/340 XM12 1.5∗∗ 1.43 ± 0.04 0.922 ± 0.005 12 ± 2 0.27 ± 0.03 447/338 CH1 1.83∗ 1.7 ± 0.2 0.74 ± 0.03 17∗ ≤0.23 0.38∗ 1.11∗ 1.75∗ 1.96∗ 2.53∗ 2.72∗ 149/152 CH2+3 1.83 ± 0.02 1.49 ± 0.08 0.79 ± 0.07 17 ± 3 0.35 ± 0.03 0.38 1.11 1.75 1.96 2.53 2.72 530/311 XM13 1.5∗∗ 1.7 ± 0.1 0.87 ± 0.02 9 ± 2 0.33 ± 0.03 0.33∗ 1.06∗ 1.70∗ 1.91∗ 2.48∗ 2.67∗ 415/340 XM14 1.59 ± 0.01 1.22 ± 0.03 0.917 ± 0.003 10∗ ≤0.003 0.39 1.12 1.76 1.97 2.54 2.73 485/342 K14∗∗∗ 1.566 ± 0.009 1.21 ± 0.03 0.86 ± 0.02 9.6 ± 0.5 0.30 ± 0.10 0.33 1.06 1.70 1.91 2.48 2.67
Notes. In the last row, we list also the parameters derived in K14 for the average XM1−12 spectrum for comparison.(a)For the warm obscurer: log ξ= −1.25. For the cold obscurer: log ξ = −4.(b)For Obs. CH2+3, XM14, and K14, the ionization parameters given the output of the iterative fitting procedure described in Sect.4.2.(c)Photon index of the primary continuum.(d)Column density of the obscurer components.(e)Covering fraction of the obscurer components.( f )Ionization parameters of the warm absorber components.(g)C-statistics of the final best-fit model.(∗)Frozen parameters.(∗∗)Lower limit of the fitting range.(∗∗∗)Best-fit parameters derived in K14 for the coadded XM1−12 spectrum.
the WA. Accordingly, we compute the ionization balance and the ionization parameters for all the WA components.
We fitted Obs. XM1−XM12 assuming the average WA deter-mined in K14. Hence, only the continuum and the two obscurer phases were left free in the fits. Furthermore, we set a lower limit for the continuum slope (Γ ≥ 1.5) in the fits to be consistent with what was observed during the campaign at higher energies and with the analysis repeated by Cappi et al, in preparation. Indeed, when fitting this absorbed spectra below ∼10 keV, a flatter intrin-sic continuum becomes degenerate with a stronger obscuration. The assumption on the slope aimed at minimizing this ambi-guity, however, did not affect the final results (as we checked a posteriori, see below).
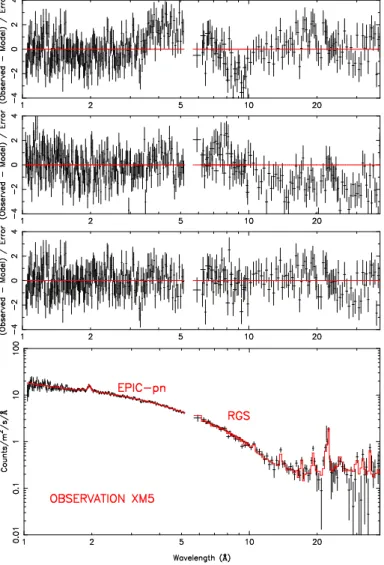
As a first step we fit the spectra, allowing for both the ob-scurer phases with just one of the parameters (column density, and covering factor) free. When only the covering fractions are allowed to vary, the fit displays strong residuals, for instance, the negative residuals just below ∼10 Å (See Fig.2, first panel). In the observation where they are more evident (Obs. XM5) the C-statistic is 600 for an expected value of 340. When we fixed the covering factors but instead allowed the column densities to vary, more systematic residuals between 10 and 20 A are appar-ent (Fig.2, second panel). Therefore, we conclude that the two phases of the obscurer have to be variable both in column den-sity and the covering fraction to adapt the template model to all the individual XMM-Newton observations.
We tested however the possibility that the obscurer varies in ionization rather than in covering fraction. For most of the data sets, a statistically acceptable fit can be achieved keeping the covering fraction of both the obscurer phases frozen to the av-erage values derived in K14, and allowing the ionization param-eter of the warm obscurer to vary instead. However, with these constraints the best fit prefers an almost neutral obscurer (e.g., log ξ ≤ −3.5), which would be too lowly ionized to produce, for
instance, the broad C
absorption lines that are seen in the UV. Hence, we discarded these fits.The final best-fit parameters are listed in Table2. In a couple of cases, the fit stopped at the lower limit we had imposed for Γ. We checked how much further the fit of these data sets could be improved allowing an even flatter continuum. In all cases, releasing the spectral index resulted in a negligible improvement of the fit (e.g., for Obs. XM1,∆C = −1 for Γ = 1.46).
The RGS spectra of the individual observations are rather noisy and the residuals do not show any hint of unaccounted WA features. However, as a final test, we checked how sensi-tive are the best fits to possible variations in the WA ioniza-tion. We attempted to refit each observation setting the WA ion-ization parameters according to the variation from the average of the continuum normalization. All the fits were insensitive to this variation, (e.g.,∆C ∼ −1) with the free parameters re-maining the same within the errors. Therefore, we concluded a posteriori that assuming a constant WA in the core of the XMM-Newtoncampaign was reasonable. We show in Fig. 2
(third and fourth panel) an example of best fit (Obs. XM5).
4.2. The flare of September 2013 as seen with Chandra-LETGS and NuSTAR
In September 2013 we triggered a series of 3 Chandra-LETGS observations because it seemed that NGC 5548 was recovering from the obscuration. Indeed, in a few days, the X-ray flux in both the Swift-XRT bands rose above the level measured at unobscured epochs and remained steady for about a week. This brightening was however a short-lived flare, and after a few days the source fell again to the typical low flux level of the XMM-Newton campaign (Fig. 1). Our triggered Chandra-LETGS observations missed the peak of the flare. The first two
Fig. 2.Examples of fits the XMM-Newton spectrum of Obs. XM5. From top to bottom panel: fit residuals when only the obscurers covering frac-tions are allowed to vary from the values obtained for the average spec-trum; fit residuals when only the obscurers column densities are allowed to vary from the values obtained for the average spectrum; fit residuals of the best-fit model where both column densities and covering frac-tions are permitted to vary freely; spectrum of observation XM5. The solid line represents the best-fit model. We rebinned the data for clarity.
observations were taken during its declining tail, while a week later the third one caught a smaller rebrightening.
To understand if and how the absorbing components had re-sponded to these continuum changes we needed to use in the photoionization modeling of the obscurer a SED representative of NGC 5548 during the flare (Fig.3, solid line). To construct it, we used the Comptonization model of Paper I, which extends from the UV to the soft X-rays. At the same time, NuSTAR pro-vided the continuum slope at high energies. In the UV, we took the model values corresponding to λ = 2987 Å, λ = 1493 Å λ = 909 Å. We then interpolated 20 data points in the model between 0.03 and 100 keV. Finally, we cut off the SED at low energies (below 0.01 Ryd).
We consistently derived the obscurer parameters and the WA ionization parameters using the same iterative method of K14. At each iteration of this fitting routine new obscurer parame-ters are fitted. Next, the new obscured continuum is used as the ionizing SED in the photoionization modeling of the six WA components. The new ionization parameters are assigned by
Fig. 3. Unobscured (solid line) and obscured (dashed line) spectral
energy distributions for NGC 5548 during the September 2013 flare, which were used for the photoionization modeling of the absorbers. The three data points in the UV (filled circles) are taken from the Comptonization model of Paper I. The data points from the EUV to hard X-rays (open squares) are also interpolated from the X-ray contin-uum model. See Sect.4.1for details.
rescaling those observed in the unobscured spectrum of 2002 to the level of the current obscured continuum. Explicitly, the ion-ization parameters at the Nth iteration are given by: ξN/ξ2002 ∼
Lion,N/Lion,2002. Finally, the ionization balances for the new
ion-ization parameters are recomputed before moving to the next iteration. The final outputs of this procedure are the obscurer parameters, the obscured SED illuminating the WA, and the rescaled WA ionization parameters.
At first, we dealt with the third and longest Chandra-LETGS spectrum (Obs. CH3) and we fitted it jointly with the simul-taneous NuSTAR spectrum. We started with a few iterations where only the continuum was allowed to vary. However, since in this way the fit was left with large residuals (C/Expected C = 846/307, Fig.4, first panel), we released first the covering frac-tions (Fig.4, second panel) and in turn the column densities of both the obscurer phases (Fig.4, third panel). Once we achieved the best fit, we applied it to the other two Chandra-LETGS spectra, for comparison. For obs. CH1, the fit tends to steepen the continuum up toΓ ∼ 2.2. In contrast, we could easily fit Obs. CH2 just by renormalizing the model. Therefore we decided that we can stack observations CH2 and CH3, and thus increase the signal-to-noise ratio of the spectrum.
We fitted this stacked spectrum (hereafter labeled as Obs. CH2+3) together with NuSTAR using the iterative procedure just described. The final best-fit model is shown in Fig.4(fourth panel) and the final obscured SED produced in the iterative fit-ting is plotted in Fig.3with a dashed line. Using the above best fit, we tested whether the difference in photon index for obser-vation CH1 could be due to changing properties of the obscurer. If we keep the continuum shape frozen, the best fit prefers zero covering fraction for the cold obscurer. For this data set, we fa-vor this solution because a large variation of the continuum slope would be inconsistent with what NuSTAR and INTEGRAL have shown for the whole campaign (see U15).
All the best-fit parameters for the Chandra observations are shown in Table2. Compared to the spectra of the core of the campaign, the Chandra spectra require both a steeper continuum (Γ ∼ 1.8) and a lower covering fraction of the warm obscurer
Fig. 4. Examples of fit for the Chandra-LETGS plus NuSTAR spec-trum of NGC 5548 during the September 2013 flare. From top to bot-tom panel: fit residuals when only the continuum is allowed to vary from the values obtained for the average spectrum; fit residuals when only the obscurers covering fraction is allowed to vary from the values obtained for the average spectrum; fit residuals for the final best-fit model. The solid line represents the best-fit model. We rebinned the data for clarity.
(CV, warm∼ 0.8). However, in principle, it is possible that a
change in the ionization state of the obscurer mimics a drop in the covering fraction. The data quality is not sufficient to fit the ionization parameter, therefore we refitted the spectrum with the ionization parameter of the warm obscurer expected if it re-sponds immediately to flux changes. We used the UVW2 flux to calculate the expected increase in ionization parameter. In the fit, we used the covering fractions as given in K14. With these con-straints, the resulting fit is statistically worse (C/Expected C = 647/311) and shows larger positive residuals in the Chandra-LETGS band. We derive a better fit by leaving the ionization parameter of the warm obscurer free, but the obtained ionization parameter (log ξ ∼ 0.9) is unrealistically high (∼100 times than the average value) considering the increase by only a factor 2 in the UVW2 flux during the flare. Therefore, we can exclude that a change in the ionization of the obscurer is the dominant cause of the observed flare.
During the XMM-Newton campaign, the discrete features of the WA are always blended with the obscured continuum and not detectable. During the Chandra observation the source was about twice as bright, and some WA signatures are visible in
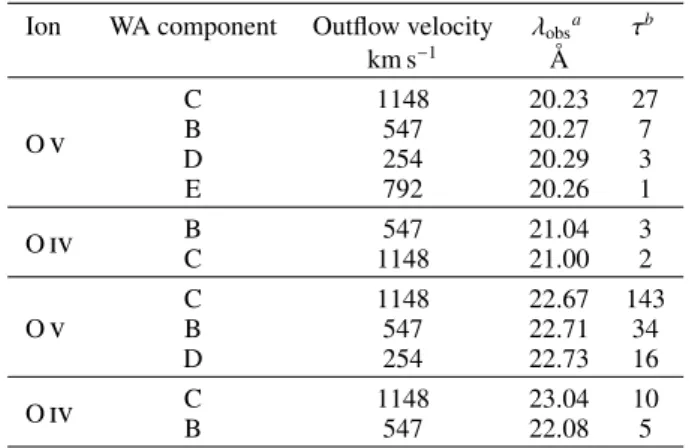
Fig. 5.Chandra-LETGS spectrum of NGC 5548 in the 15−24 Å
wave-length region. The solid line represents our best-fit model. The most prominent emission and absorption features are labeled. The spectrum shows some WA signatures (Fe-UTA, O
−O
) that were not detected during the XMM-Newton campaign.Table 3. List of the O
and O
lines predicted by our WA model that contributes to the features visible in Fig.5.Ion WA component Outflow velocity λobsa τb
km s−1 Å O
C 1148 20.23 27 B 547 20.27 7 D 254 20.29 3 E 792 20.26 1 O
BC 1148547 21.0421.00 32 O
C 1148 22.67 143 B 547 22.71 34 D 254 22.73 16 O
C 1148 23.04 10 B 547 22.08 5Notes.(a)Predicted wavelength, considering the cosmological redshift and the blueshift due to the outflow.(b)Line optical depth.
the stacked CH2+3 spectrum (Fig.5). These features are con-sistent with the WA model computed via our iterative proce-dure. The broad trough at ∼16 Å is a blend of unresolved tran-sition array (UTA) from several ionized iron species. Between 20 and 24 Å, some O
-O
absorption lines are present. In Table3, we list which of the O
and O
lines predicted by our WA model contribute to each feature. The WA comprises six ionization components that could be distinguished thanks to the excellent data quality of the 2002 spectrum. Here, the lower statistics does not allow us to overcome the blending among the components.4.3. The end of the campaign: the observations of December 2013 and February 2014
In the last two XMM-Newton observations of the campaign, NGC 5548 was again at the same flux level of summer 2013. Therefore, at first we attempted to fit them again using the same WA of the average spectrum. The parameters of the con-tinuum and of the two phases of the obscurer were free. This
Fig. 6. XMM-Newtonspectrum and model residuals for Obs. 14. The solid line represents our best-fit model. We rebinned the data for clarity.
attempt resulted in a satisfactory fit for XM13, while for Obs. XM14, we obtained a high column density for the cold obscurer ( NH, cold∼ 7 × 1023cm−2) largely inconsistent with what was
ob-served throughout the campaign. Thus, we attempted to refit this data set freezing the cold column density to the average value measured in the previous observations. This resulted in negligi-ble covering fraction for the cold obscurer (CV, cold<∼ 10−2) and
in a flatter continuum (Γ ∼ 1.6 instead of ∼1.7). This lower value ofΓ is also similar to the other values measured at this luminos-ity (Fig.8). For these reasons, we considered this solution more physically plausible. For this data set, a solution with a negligi-ble covering fraction of the cold obscurer and a flatter continuum is also found in U15 when including in the fit INTEGRAL data at higher energies.
Considering the large change in the obscurer, also for this observation, we used our iterative method to determine the ion-ization of the WA (for details see Sect.4.1). We built the SED for Obs. XM14 interpolating the Comptonization model of Paper I repeating all the steps already described in Sect.4.1. In this case, the slope of the continuum at X-ray energies is provided by the fit of the EPIC-pn data. Starting from the solution just described, the fit converged in a few iterations. We also made some itera-tions where the ionization parameter of the warm obscurer was left free. However, since it was not possible to constrain it, we finally kept it frozen to the value found in K14 (see Sect. 3). We adopt the final result of the iterative routine as our best-fit model. The parameters resulting from this exercise are outlined in Table2.
We show the final best-fit model for Obs. XM14 in Fig.6. The final WA model that we found is only slightly different from the average model. The residuals of the best-fit model dis-play some possible features at ∼10.3 Å and ∼12.3 Å, which are close to the expected wavelength of the Ne
-K edge (10.54 Å) and Ne
-Ly α (12.34 Å), respectively. We checked whether adding additional absorbing column density in Ne
-Ne
could improve the fit. For this, we used the SLAB model in SPEX, which allows us to fit a single ionic column density regardless of the ionization balance with the other ions. We found how-ever that this additional component is not required by the fit (∆C = −1).5. Discussion
5.1. The short-term variability
During our extensive monitoring campaign in 2013 and early 2014, NGC 5548 was always obscured. In this analysis we ap-plied the model developed in K14 for the average spectrum of the core of the campaign to all the individual observations, with the aim of understanding how the source varies. When both the intrinsic continuum and the obscurer are allowed to vary, the model is able to explain the variability on the two days to eight-month timescale sampled in the monitoring campaign. The ob-scuring material that is causing the soft X-ray flux depression of NGC 5548 varies along our line of sight, both in column density and in covering fraction. The scenario proposed by K14, that the source is obscured by a patchy wind, is consistent with our vari-ability findings. In this framework, the varivari-ability of the obscu-ration may well be due to several reasons, e.g., motion across the line of sight and changing ionization with continuum variability. The best-fit parameters for the continuum and the two phases of the obscurer are shown in Fig.7as a function of time. During the core of the XMM-Newton campaign (Obs. XM1−XM12) the source was steadily obscured and the variability in flux was rel-atively small (∼27%). The only clear outlier with a flux sig-nificantly different from the average is Obs. XM1. The val-ues we found for the warm obscurer parameters (Fig. 7 4th and 6th panel) deviate from those found in K14, the coadded XM1−XM12 spectrum. This is because we used a different method to model the soft excess, which dominates the contin-uum in the band where the absorption from this component is more effective. In our modeling, the Comptonized soft-excess, whose normalization is set by the UV flux measured by Swift for each observation, is always more luminous (LCOMT
0.3−2.0 keV =
[0.8−1.4] × 1043erg s−1) than the phenomenological blackbody fitted in K14. Throughout the core of the campaign, the intrin-sic continuum is fairly constant in shape (with a standard devi-ation of the spectral index σΓ ∼ 3%) and slightly variable in normalization (σUVW2∼ 17%, σNorm ∼ 24% for the soft-excess
and the power-law component, respectively). For the obscurer, the cold component was the most variable (σ CV, cold ∼ 31%
and σ NH, cold ∼ 23%). In contrast, for the warm component
the covering fraction is stable (σ CV, warm ∼ 2%) and the
col-umn density shows rather small variability (σ NH, warm ∼ 13%).
The large deviation from the average of the cold covering frac-tion suggests that the obscurer inhomogeneity, which is possibly dominated by the cold phase, may have caused most of the vari-ability observed during this phase of the campaign.
We also presented the Chandra-LETGS data sets, which were acquired in September 2013, when NGC 5548 underwent a two-week brightening. With respect to the core of the campaign changes in both the continuum and the ob-scurer are required to fit these spectra. At the time of the Chandraobservation, the UV flux measured by Swift, which in our interpretation is a tracer for the soft X-ray excess, was the highest of the whole campaign. At the same time, the continuum at hard X-ray energies increased in flux and became steeper. For both observations the warm obscurer component has a signifi-cantly lower covering fraction. In the first observation, the cov-ering fraction of the cold component is also lower. As pointed out in Sect.4.2, a variation in the obscurer ionization alone is insufficient to explain the observed variation in spectral shape.
The decrease in covering fraction, in principle, can be due either to a local thin patch of the obscurer passing in our line of sight at the moment of the Chandra or to a geometrical change
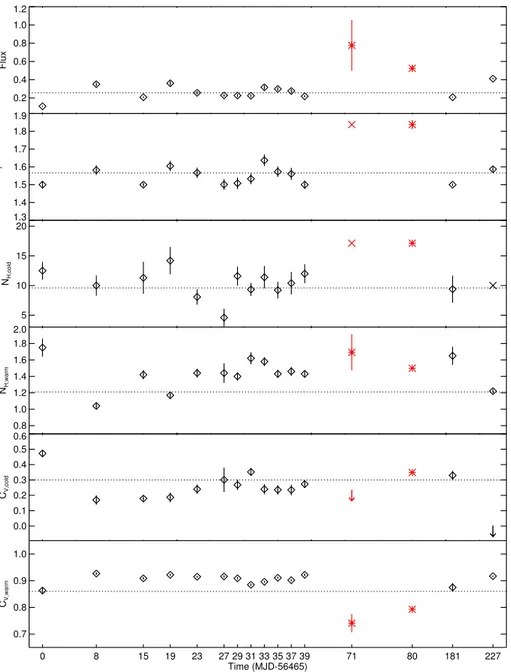
0.2 0.4 0.6 0.8 1.0 1.2 Flux 1.3 1.4 1.5 1.6 1.7 1.8 1.9 Γ 5 10 15 20 NH,cold 0.8 1.0 1.2 1.4 1.6 1.8 2.0 NH,warm 0.0 0.1 0.2 0.3 0.4 0.5 0.6 CV,cold 0 8 15 19 23 27 29 31 33 35 37 39 71 80 181 227 Time (MJD-56465) 0.7 0.8 0.9 1.0 CV,warm
Fig. 7.From top to bottom panel: observed
flux in the 0.3−2.0 keV band, photon index of the primary continuum, column densities of the cold and the warm obscurer, and cov-ering fractions of the cold and warm ob-scurer are shown as a function of time. The flux is plotted in units of 10−11erg s−1cm−2. The column densities are plotted in units of 1022 cm−2. The Modified Julian Day (MJD) correspondent to each observation is labeled on the horizontal axes, which we shrunk for display purpose. Black dia-monds and red asterisks identify parameters measured with XMM-Newton and Chandra-LETGS, respectively. Error bars, when larger than the size of the plotting symbol, are also shown. Upper limits are plotted as an arrow. Crosses represent values that were kept frozen in the fits. In each panel, the dotted horizontal line indicates the param-eter value derived in K14 for the coadded XM1−12 spectrum.
of the UV/soft X-ray continuum source behind the obscurer. The former possibility, although it cannot be excluded, would however require that the intrinsic continuum and the obscurer change properties in synchrony, which seems ad hoc. In the Comptonization model of Petrucci et al. (2013), the UV/soft X-ray spectrum is supposed to be produced via Comptonization of the UV disk photons in a “warm” (T ∼ 1 keV) and moderately thick (τ ∼ 10−20) corona. A “hot” corona, with higher tempera-ture (∼100 keV) and smaller optical depth (∼1), in turn Compton upscatters these UV/soft X-ray photons to hard X-ray energies. In this interpretation, an increase in physical size of the warm corona, while naturally augmenting both the UV and the soft X-ray flux, would also result in a drop of the observed obscurer covering fraction. Moreover, the increase in the UV/soft X-ray photon flux will more effectively cool the hot corona, hence pro-ducing a steeper hard X-ray spectrum, which is in agreement with the observation.
Because of increased soft X-ray flux in the
Chandraobservations, some discrete WA features (Fe UTA, O
−O
) became evident in the spectrum. These are theonly detectable WA signatures in any X-ray spectrum of our campaign. These features are best fitted by a WA, which has a significantly lower degree of ionization than observed in the unobscured 2002 spectrum. Like K14, for all the WA components we found best-fit ionization parameters, which are 0.40 dex lower than the 2002 values (log ξ2002A−E = 0.78, 1.51, 2.15, 2.36, 2.94, and 3.13). This means that the ionizing luminosity received by the WA decreased by a factor of ∼4. Thus, our analysis confirms the K14 finding. The decrease in the WA ionization, which is also seen in the UV (Arav et al. 2015) is explained when the newly discovered obscurer is located between the nucleus and the WA. In this geometry, the obscurer shadows the central source and prevents most of the ionizing flux from reaching the warm absorber.
The absorbers in NGC 5548 changed again in the last ob-servation of the campaign, namely Obs. XM14. We found that in this data set, the covering fraction of the cold ob-scurer became negligible. At the same time, the continuum above 2.0 keV is similar to what is observed throughout the XMM-Newtoncampaign, while the soft-excess component is
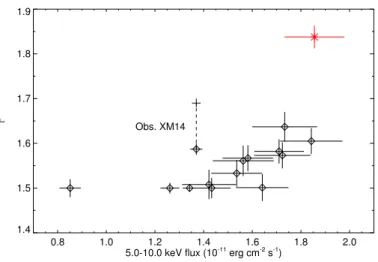
0.8 1.0 1.2 1.4 1.6 1.8 2.0 5.0-10.0 keV flux (10-11 erg cm-2 s-1 ) 1.4 1.5 1.6 1.7 1.8 1.9 Γ Obs. XM14
Fig. 8. Fitted continuum slope as a function of the observed
5.0−10.0 keV flux for all XMM-Newton and Chandra data sets, with errors. Black diamonds and red asterisk identify parameters measured with XMM-Newton and Chandra-LETGS, respectively. The black cross represents the higher value ofΓ that, for Obs. XM14, would be required by a fit including the cold obscurer (see Sect.4.3).
only slightly higher. Thus, the most likely cause of the spectral changes observed in this data set is again the inhomogenity of the obscuration.
Variability in the continuum and obscurer parameters is also noticed in the U15 analysis of six XMM-Newton and one Chandra observations, which were acquired simultaneously with a higher energy observation. However, the parameters ob-tained fitting the EPIC-pn jointly with RGS as done here are not directly comparable with those obtained fitting the EPIC-pn jointly with NuSTAR and/or INTEGRAL, as done in U15. This is both because of cross-calibration issues between the instru-ments and of differences in the analysis. In particular, as noticed also in U15, RGS and EPIC-pn are mismatched in flux in the overlapping band as a function of energy (e.g., Detmers et al. 2009). On the other hand, NuSTAR spectra are systematically steeper than EPIC-pn spectra (∆Γ ∼ 0.1 see Cappi et al., in prep). In the present analysis, we also consider the ionized phase of the obscurer (K14), while U15 use two purely neutral com-ponents. This can affect the broadband curvature of the model. Moreover U15 has an additional degree of freedom in the high-energy cutoff of the continuum. For all these reasons, the only meaningful comparison is among the overall trend of the param-eters. Even taking the differences between our analysis and the one presented in U15 the parameters into account, trends that we discuss below still hold.
5.2. What drives the variability?
To understand if there are some systematic factors driving the short-term variability of the source, we looked for correlations among the best-fit parameters and the unobscured flux measured for the 16 data sets presented here. We used the hard X-ray flux in the 5.0−10.0 keV band and the UVW2 flux listed in Table1as tracers of the intrinsic continuum, as they are almost unaffected by the obscuration. Even considering these unabsorbed bands, the range of flux sampled in the monitoring campaign is narrow (a factor of ∼2), with the only outliers at lower and higher flux being Obs. XM1 and Obs CH2+3. Therefore, to evaluate the reliability of any correlations we checked if this still holds when
we remove these two data points from the computation of the Pearson correlation coefficient.
In Fig.8we show that the best-fit continuum slope steepens as the hard X-ray flux increases. For the complete sample the correlation is extremely significant. The Pearson correlation co-efficient is Rall = 0.85, implying a probability p ∼ 10−5for the
null hypothesis. When excluding Obs. XM1 and Obs. CH2+3 from the computation, the degree of correlation still remains sig-nificant (RXM2−XM14 = 0.68, pXM2−XM14 = 1%). This trend has
already been noticed in the past for NGC 5548 inKaastra et al.
(2004) and has also been reported in other Seyfert galaxies (e.g., MCG 6-30-15 Shih et al. 2002), with different interpretations (see, e.g.,Ponti et al. 2006; Giacchè et al. 2014). In the same Fig.8we show also that for Obs. XM14, the higher value ofΓ that would be required by a fit, including a thick cold obscurer (that we rejected, see. Sect.4.3), is inconsistent with the corre-lation valid for all the other data sets.
In Fig. 9 we plot the parameters of both the obscurer phases as function of the UVW2 flux. The only parame-ter showing a possible trend with the intrinsic continuum is the warm covering factor. Namely, the drop observed dur-ing the Chandra observations may be the tail of a mild de-creasing trend visible also for the XMM-Newton data points (Fig.9, bottom panel). Formally, when the two Chandra data points are included in the computation, a significant correla-tion (Rall = −0.73, pall = 1%) is present. When
consider-ing only the XMM-Newton sample, the trend is only qualita-tive (RXM1−XM14 = −0.03 pXM1−XM14 = 25%). In Sect.5.1we
suggested that the drop in covering fraction observed during the September 2013 flare is due to an increase in the size of the soft X-ray/UV source. A clear correlation between the warm cover-ing fraction and intrinsic continuum, supported by more numer-ous data points at different flux values, would favor the hypoth-esis that this is a systematic effect producing at least part of the observed covering fraction variability. This trend is not apparent for the cold covering fraction. This could be due to a higher de-gree of inhomogenity in the cold phase that would also explain its larger variability in covering fraction (e.g., it went from 0.47 in Obs XM1 to 0 in Obs. XM14).
In conclusion, a combination of changes in the continuum and in the obscurer physical parameters is required to explain the short-term spectral variability of NGC 5548 during our 2013−2014 campaign. The lack of correlation between the in-trinsic continuum (as traced by the UVW2 flux) and obscurer parameters indicate that the obscurer must physically change properties independent of the source flux level. The case of the September 2013 spectrum suggests that the soft X-ray emitting region change geometry as the flux increases. This could be a systematic effect contributing to the overall covering fraction variability.
6. Summary and conclusions
During the multiwavelength monitoring campaign that we per-formed in 2013−2014 for the Seyfert 1 galaxy NGC 5548, the source had a soft X-ray flux well below the long-term aver-age, except for a two-week-long flare in September 2013. In K14, we have ascribed this condition to the onset of a persistent, weakly-ionized but high-velocity wind that blocks ∼90% of the soft X-ray flux and lowers the ionizing luminosity received by the WA. Thus, in this condition, the normal WA that was pre-viously observed in this source is still present, but with a lower ionization. We fitted all the high resolution XMM-Newton and Chandradata sets that were taken during the campaign with a
5 10 15 20 NH,cold 1.0 1.2 1.4 1.6 1.8 2.0 NH,warm 0.0 0.1 0.2 0.3 0.4 0.5 0.6 CV,cold 2.0 2.5 3.0 3.5 4.0 4.5 5.0 UVW2 0.70 0.75 0.80 0.85 0.90 0.95 1.00 CV,warm
Fig. 9. From top to bottom panel:
col-umn densities of the cold and the warm obscurer, covering fraction of the cold and the warm obscurer plotted as func-tion of the flux in the UVW2 filter. Column densities are plotted in units of 1022 cm−2. The UVW2 flux is plotted in units of 10−14 erg s−1cm−2A−1. Black diamonds and red asterisks identify pa-rameters measured with XMM-Newton and Chandra-LETGS, respectively. Error bars, when larger than the size of the plotting symbol, are also shown. Upper limits are plotted as an arrow. Crosses represent val-ues that were kept frozen in the fits.
model that consistently accounts for a variable continuum, the newly discovered obscurer, and the new ionization conditions of the historical WA. We found that on the timescales sampled in the monitoring campaign (2 days−8 months) both the intrinsic continuum and the obscurer are variable. The obscuring mate-rial varies both in column density and in covering fraction. This rapid variability is consistent with the picture of a patchy wind proposed by K14.
The Chandra spectra that were taken just after the peak of the flare in September 2013 are explained by both an increase and a steepening of the intrinsic continuum and a drop in the obscurer covering fraction. The latter is likely to be because of a geometrical change of the soft X-ray continuum source behind the obscurer.
Moreover, the spectrum show absorption from Fe-UTA, O
,
and O
, consistent with belonging to the lower-ionized counterpart of the historical NGC 5548 warm absorber. These are the only individual WA features in any X-ray spectrum of the campaign.We also looked for correlation between the fitted parame-ters and some tracers of the intrinsic continuum flux. A posi-tive correlation between the X-ray continuum slope and the ob-served 5.0−10.0 keV flux holds for both the XMM-Newton and Chandradata sets.
The addition of the two Chandra points produce a formal an-ticorrelation between the warm obscurer covering fraction and the intrinsic continuum luminosity, as traced by the observed UVW2 flux.
Acknowledgements. This work is based on observations obtained with XMM-Newton an ESA science mission with instruments and contributions di-rectly funded by ESA Member States and the USA (NASA). This research has made use of data obtained with the NuSTAR mission, a project led by the California Institute of Technology (Caltech), managed by the Jet Propulsion Laboratory (JPL) and funded by NASA. This work made use of data supplied by the UK Swift Science Data Centre at the University of Leicester. We thank the Chandra team for allocating the LETGS triggered observations. We thank the International Space Science Institute (ISSI) in Bern for their support and hospi-tality. SRON is supported financially by NWO, the Netherlands Organization for Scientific Research. M.M. acknowledges support from NWO and the UK STFC. This work was supported by NASA through grants for HST program number 13184 from the Space Telescope Science Institute, which is operated by the Association of Universities for Research in Astronomy, Incorporated, un-der NASA contract NAS5-26555. M.C. acknowledges financial support from contracts ASI/INAF n.I/037/12/0 and PRIN INAF 2011 and 2012. P.O.P and F.U. acknowledge funding support from the CNES and the French-Italian International Project of Scientific Collaboration: PICS-INAF project n181542 S.B. and A.D.R. acknowledge INAF/PICS financial support and financial sup-port from the Italian Space Agency under grant ASI/INAF I/037/12. A.D.R acknowledge financial support from contract PRIN INAF 2011. G.P. acknowl-edges support via an EU Marie Curie Intra-European fellowship under contract no. FP-PEOPLE-2012-IEF-331095 and Bundesministerium fÃijr Wirtschaft und Technologie/Deutsches Zentrum für Luft- und Raumfahrt (BMWI/DLR, FKZ 50 OR 1408). FU acknowledges support from Université Franco-Italienne (Vinci Ph.D. fellowship). M.W. acknowledges the support of a PhD studentship awarded by the UK STFC.
References
Arav, N., Gabel, J. R., Korista, K. T., et al. 2007,ApJ, 658, 829
Arnaud, K. A., Branduardi-Raymont, G., Culhane, J. L., et al. 1985,MNRAS, 217, 105
Bianchi, S., Maiolino, R., & Risaliti, G. 2012,Adv. Astron., 2012, 17
Brinkman, B. C., Gunsing, T., Kaastra, J. S., et al. 2000, in X-Ray Optics, Instruments, and Missions III, eds. J. E. Truemper, & B. Aschenbach,SPIE Conf. Ser., 4012, 81
Burrows, D. N., Hill, J. E., Nousek, J. A., et al. 2005,Space Sci. Rev., 120, 165
Cash, W. 1979,ApJ, 228, 939
Coffey, D., Longinotti, A. L., Rodríguez-Ardila, A., et al. 2014,MNRAS, 443, 1788
Costantini, E. 2010,Space Sci. Rev., 157, 265
Costantini, E., Kaastra, J. S., Arav, N., et al. 2007,A&A, 461, 121
Crenshaw, D. M., & Kraemer, S. B. 1999,ApJ, 521, 572
Crenshaw, D. M., & Kraemer, S. B. 2012,ApJ, 753, 75
Crenshaw, D. M., Kraemer, S. B., Gabel, J. R., et al. 2003a,ApJ, 594, 116
Crenshaw, D. M., Kraemer, S. B., & George, I. M. 2003b,ARA&A, 41, 117
de Vaucouleurs, G., de Vaucouleurs, A., Corwin, J. H. G., et al. 1991, Third Reference Catalogue of Bright Galaxies. Volume I: Explanations and refer-ences. Volume II: Data for galaxies between 0h and 12h. Volume III: Data for galaxies between 12h and 24h
den Herder, J. W., Brinkman, A. C., Kahn, S. M., et al. 2001,A&A, 365, L7
Detmers, R. G., Kaastra, J. S., & McHardy, I. M. 2009,A&A, 504, 409
Di Gesu, L., Costantini, E., Arav, N., et al. 2013,A&A, 556, A94 (Paper I)
Ebrero, J., Costantini, E., Kaastra, J. S., et al. 2010,A&A, 520, A36
Ebrero, J., Kriss, G. A., Kaastra, J. S., et al. 2011,A&A, 534, A40
Elvis, M., Risaliti, G., Nicastro, F., et al. 2004,ApJ, 615, L25
Gehrels, N., Chincarini, G., Giommi, P., et al. 2004,ApJ, 611, 1005
Giacchè, S., Gilli, R., & Titarchuk, L. 2014,A&A, 562, A44
Hamann, F., & Sabra, B. 2004, in AGN Physics with the Sloan Digital Sky Survey, eds. G. T. Richards, & P. B. Hall,ASP Conf. Ser., 311, 203
Harrison, F. A., Craig, W. W., Christensen, F. E., et al. 2013,ApJ, 770, 103
Iwasawa, K., Fabian, A. C., & Nandra, K. 1999,MNRAS, 307, 611
Kaastra, J. S., Mewe, R., & Nieuwenhuijzen, H. 1996, in UV and X-ray Spectroscopy of Astrophysical and Laboratory Plasmas, eds. K. Yamashita & T. Watanabe, 411
Kaastra, J. S., Mewe, R., Liedahl, D. A., Komossa, S., & Brinkman, A. C. 2000,
A&A, 354, L83
Kaastra, J. S., Steenbrugge, K. C., Raassen, A. J. J., et al. 2002,A&A, 386, 427
Kaastra, J. S., Raassen, A. J. J., Mewe, R., et al. 2004,A&A, 428, 57
Kaastra, J. S., Detmers, R. G., Mehdipour, M., et al. 2012,A&A, 539, A117
Kaastra, J. S., Kriss, G. A., Cappi, M., et al. 2014,Science, 345, 64
Kraemer, S. B., Crenshaw, D. M., George, I. M., Gabel, J. R., & NGC 4151 Team 2005,BAAS, 37, 1190
Kraemer, S. B., Crenshaw, D. M., Dunn, J. P., et al. 2012,ApJ, 751, 84
Krongold, Y., Nicastro, F., Brickhouse, N. S., Elvis, M., & Mathur, S. 2005,ApJ, 622, 842
Krongold, Y., Nicastro, F., Elvis, M., et al. 2007,ApJ, 659, 1022
Longinotti, A. L., Costantini, E., Petrucci, P. O., et al. 2010,A&A, 510, A92
Longinotti, A. L., Krongold, Y., Kriss, G. A., et al. 2013,ApJ, 766, 104
Magdziarz, P., & Zdziarski, A. A. 1995,MNRAS, 273, 837
Marchese, E., Braito, V., Della Ceca, R., Caccianiga, A., & Severgnini, P. 2012,
MNRAS, 421, 1803
Matt, G., Guainazzi, M., & Maiolino, R. 2003,MNRAS, 342, 422
McHardy, I. M., Koerding, E., Knigge, C., Uttley, P., & Fender, R. P. 2006,
Nature, 444, 730
Mehdipour, M., Kaastra, J. S., Kriss, G. A., et al. 2015,A&A, 575, A22
Miniutti, G., Sanfrutos, M., Beuchert, T., et al. 2014,MNRAS, 437, 1776
Nandra, K., Fabian, A. C., George, I. M., et al. 1993,MNRAS, 260, 504
Pancoast, A., Brewer, B. J., Treu, T., et al. 2014,MNRAS, 445, 3073
Peterson, B. M., & Wandel, A. 1999,ApJ, 521, L95
Petrucci, P.-O., Paltani, S., Malzac, J., et al. 2013,A&A, 549, A73
Piconcelli, E., Bianchi, S., Guainazzi, M., Fiore, F., & Chiaberge, M. 2007,
A&A, 466, 855
Ponti, G., Miniutti, G., Cappi, M., et al. 2006,MNRAS, 368, 903
Ponti, G., Papadakis, I., Bianchi, S., et al. 2012,A&A, 542, A83
Puccetti, S., Fiore, F., Risaliti, G., et al. 2007,MNRAS, 377, 607
Risaliti, G., Elvis, M., Fabbiano, G., Baldi, A., & Zezas, A. 2005,ApJ, 623, L93
Risaliti, G., Salvati, M., Elvis, M., et al. 2009,MNRAS, 393, L1
Risaliti, G., Elvis, M., Bianchi, S., & Matt, G. 2010,MNRAS, 406, L20
Roming, P. W. A., Kennedy, T. E., Mason, K. O., et al. 2005,Space Sci. Rev., 120, 95
Shih, D. C., Iwasawa, K., & Fabian, A. C. 2002,MNRAS, 333, 687
Steenbrugge, K. C., Kaastra, J. S., de Vries, C. P., & Edelson, R. 2003,A&A, 402, 477
Steenbrugge, K. C., Kaastra, J. S., Crenshaw, D. M., et al. 2005,A&A, 434, 569
Steenbrugge, K. C., Fenovˇcík, M., Kaastra, J. S., Costantini, E., & Verbunt, F. 2009,A&A, 496, 107
Strüder, L., Briel, U., Dennerl, K., et al. 2001,A&A, 365, L18
Titarchuk, L. 1994,ApJ, 434, 570
Turner, M. J. L., Abbey, A., Arnaud, M., et al. 2001,A&A, 365, L27
Turner, T. J., Miller, L., Kraemer, S. B., Reeves, J. N., & Pounds, K. A. 2009,
ApJ, 698, 99
Ursini, F., Boissay, R., Petrucci, P.-O., et al. 2015,A&A, 577, A38
Wakker, B. P., Lockman, F. J., & Brown, J. M. 2011,ApJ, 728, 159
Walton, D. J., Risaliti, G., Harrison, F. A., et al. 2014,ApJ, 788, 76
Weymann, R. J., Morris, S. L., Foltz, C. B., & Hewett, P. C. 1991,ApJ, 373, 23