UNIVERSITÀ DELLA CALABRIA
Dipartimento di Elettronica,
Informatica e Sistemistica
Dottorato di Ricerca in
Ingegneria dei Sistemi e Informatica
XXVciclo
Tesi di Dottorato
Environmental and Physiological
Parameters Measurement
in Images and Video
DEIS- DIPARTIMENTO DI ELETTRONICA,INFORMATICA E SISTEMISTICA
Novembre 2012
Abstract
Measurement in images and video is a new challenging research direction. Up to now, cameras are mostly used as interaction devices. Computer vision technologies, however, can turn an ordinary video camera to a powerful tool for counting, measuring and inspecting. Using the camera as a measuring sensor is very interesting as allows creating a ”universal” measurement instrument, where new type of measurements can be added just by changing the software. Appearance of smartphones brings measurements in image and video to the new level, introducing a small, portable, autonomous measurement device. A lot of efforts have been made to convert smartphones to mobile tools for measuring the object length, width, size, angles, area, dimensions etc.
This Ph.D. thesis investigates novel image and video processing techniques and shows how they can be used for non-invasive measurement of various envi-ronmental and physiological parameters. The three logical steps describe the possible types of measurements: in static image, in video and using smart-phones.
First, the case with a single image affected by a motion blur is consid-ered and appropriate techniques for locating the regions with motion blur and parameters extraction are presented. A new method to detect the lo-cally motion blurred regions from the image with complex still background is introduced. Analysis in the frequency domain, statistical analysis and win-dowing techniques are used to find blurred object, and the Fourier and Radon transformations are used to compute its motion characteristics.
Analysis of video allows measuring additional characteristics of the objects that change over time. Monitoring of the human fatigue level is done by eyelid blinks detection and analysis. Two solutions are proposed: the non-invasive blink detection system based on infrared camera and webcam. The usage of infrared camera with switching light is used for fast and easy pupil detection in each frame, while the webcam is used to create a very cheap but still effective system. The problem of eyes detection is solved by using a cascade of boosted classifiers based on Haar-like features. The algorithm is proposed to detect
closure and opening of the eyes and to distinguish voluntary blinks from the involuntary ones.
Finally, the smartphone is used for photoplethysmogram acquisition and measurement of vital parameters. The proposed approach utilizes a concept of image acquisition similar to the one of a pulse oximeter. The problem of finger detection in video as well as verification of the proper usage of the system is solved by using colour segmentation in each colour channel. Then, the pulse rate is evaluated based on adaptive and statistical analysis. Moreover, the blood pressure is estimated by means of artificial neural network. A set of parameters are proposed to be extracted from the photoplethysmographic signal and used as the input of the neural network. For wide representation of training data the Multiparameter Intelligent Monitoring in Intensive Care waveform dataset is used.
Acknowledgements
First and foremost, I would like to express my thorough gratitude to my supervisor, Prof. Domenico Grimaldi for his guidance, suggestions and en-couragement. I appreciate his support and assistance which have helped me to present this work.
Special thanks to my friends Dr. Francesco Lamonaca and Dr. Domenico Luca Carn`ı with whom I spent many time in the laboratory. Thank you for your suggestions, persistent inspiration and extraordinary kindness.
I would like to express my deep gratitude to everyone else at the Depart-ment of Electronics, Computer and System Sciences for providing a great environment.
I have had the pleasure of meeting many good people while at the Uni-versity of Calabria who were a part of my life during the last three years. I would like to thank all my friends and especially Gaetano, Yuliya, Iryna, Paolo, Andrea and Stefano who have made my time there enjoyable.
Finally, this thesis is dedicated to my parents, who always give me inspi-ration, support, and encouragement.
Contents
Abstract . . . VII
Acknowledgements . . . IX
1 Introduction . . . . 1
1.1 Motivations . . . 1
1.1.1 The role of computers in measurements . . . 1
1.1.2 Smartphones effect on image processing . . . 3
1.1.3 Specific character of measurement in images and video . 4 1.1.4 Using camera as a measuring device . . . 5
1.2 Goals . . . 5
1.3 Structure of the Ph.D. Thesis . . . 7
Part I Measurements in Static Images 2 Detection and Parameters Estimation of Locally Motion Blurred Objects . . . 11
2.1 Introduction . . . 11
2.2 Local Motion Blur Detection . . . 13
2.3 Estimation of the Motion Blur Parameters . . . 17
2.4 Experimental Results . . . 18
2.5 Conclusions . . . 21
Part II Measurements in Video 3 Blink Rate Measurement for Non-invasive Fatigue Monitoring . . . 25
3.1 Introduction . . . 25
3.1.2 Fatigue . . . 27
3.1.3 Relation between blink frequency and behavioural factors . . . 27
3.1.4 Blink parameters as fatigue measure . . . 29
3.1.5 Physiological measurement . . . 30
3.1.6 Non-invasive blink detection techniques . . . 33
3.2 Pupil Segmentation on Image . . . 34
3.3 Proposed Algorithm of Blinks Detection . . . 35
3.4 Experimental Results . . . 37
3.5 Conclusions . . . 40
4 Eyes Blink Detection with Webcam for Human Fatigue Monitoring . . . 41
4.1 Introduction . . . 41
4.2 Eyes Detection on the Image . . . 42
4.3 Eyes Tracking . . . 45
4.4 Blink Detection . . . 46
4.5 Experimental Results . . . 48
4.6 Conclusions . . . 48
Part III Measurements using Mobile Devices 5 Smartphone-based Photoplethysmogram Acquisition . . . 53
5.1 Introduction . . . 53
5.1.1 Electrocardiography . . . 54
5.1.2 Ambulatory blood pressure monitoring . . . 54
5.1.3 Photoplethysmography . . . 55
5.1.4 Photoplethysmographic imaging . . . 58
5.1.5 Smartphone-based health monitoring systems . . . 59
5.1.6 Smartphone-based photoplethysmography . . . 61
5.2 System Work Overview . . . 62
5.3 Assessment of Correct Use . . . 63
5.4 Initial System Calibration . . . 68
5.5 PPG Evaluation Algorithm . . . 70
5.6 Experimental Results . . . 74
5.7 Conclusions . . . 77
6 Reliable Pulse Rate Evaluation . . . 81
6.1 Introduction . . . 81
6.2 Pulse Rate Evaluation . . . 82
6.3 Experimental Validation of the PR Evaluation Method . . . 84
Contents XIII
7 Continuous Blood Pressure Estimation . . . 87
7.1 Introduction . . . 87
7.2 Pulse Parameters Extraction from PPG . . . 90
7.3 Artificial Neural Network Architecture . . . 90
7.4 Data Source . . . 92
7.5 Experimental Results and Discussion . . . 93
7.6 Conclusions . . . 96
Conclusions and Future Work . . . 97
List of Figures
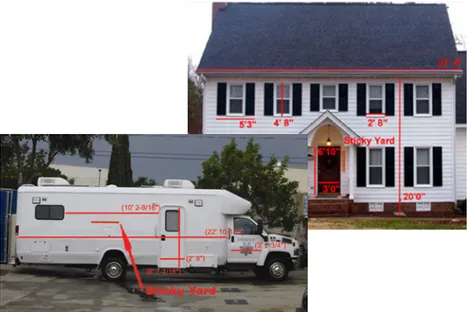
1.1 Measurements, provided by the Sticky Yard Digital Photo
Measuring System. . . 2 1.2 CentreCam: a webcam-based system to improve the technical
process accuracy. . . 3 1.3 Worldwide smartphone sales to end users from 1st quarter
2009 to 3rdquarter 2012 (in million units). . . . 3
1.4 General structure of camera-based measuring instrument. . . 5 1.5 Measuring algorithm using the camera. . . 6 2.1 Example of motion blurred circular image (a) and its Fourier
spectrum (b). . . 12 2.2 Different images (a, c, and e), and the corresponding spectra
(b, d, and f). . . 14 2.3 Block scheme of the procedure to detect the regions with a
local motion blur. . . 15 2.4 Original image (a) and the result of local standard deviation
computation (b). . . 16 2.5 Result of image partitioning (a), trend of sigma values in
each window (b), extracted sigma values in windows with no motion blur and sharp edges (c), simple texture with no
motion (d), and motion blurred ones (e). . . 17 2.6 Fourier Transform (a) and maximum values for each angle of
the Radon Transform (b) or the original image. . . 18 2.7 Detection results of the regions with local motion blur. . . 19 2.8 Estimation of the motion blur parameters: a) first extracted
region, b) its Fourier spectrum, c) computation of the rotation angle, equal to 45°, d) second extracted region, e) its Fourier spectrum and f)computation of the rotation angle, equal to 128°. 19 2.9 Detection results on the image without motion blur: a)
original image, b) obtained mask. . . 20 2.10 a) Original image, b) computed mask, c) extracted region. . . 20
2.11 a) globally blurred image, b) computed mask, c) extracted
region. . . 20 3.1 Positioning of the electrodes: F - frontal area, O - occipital
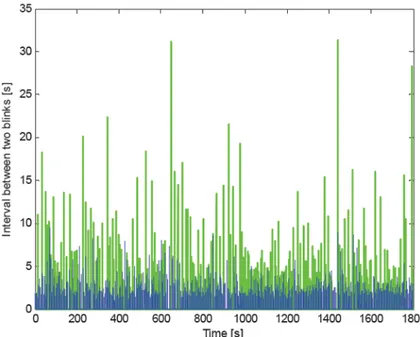
area, C - central area, P - parietal area, T - temporal area. . . 31 3.2 Correct positioning of the electrodes for EOG measurements. . . 32 3.3 Definition of the blink duration, measured from EOG signal. . . . 33 3.4 Changes of the EOG signal in awake and drowsy conditions. . . . 33 3.5 Pupil segmentation procedure. . . 35 3.6 The detected (a) and the corrected (b) results of blink detection. 36 3.7 Detected blinks and time interval between them for alert
(green) and drowsy (blue) states. . . 37 3.8 Calculated mean interval between two blinks for alert (green)
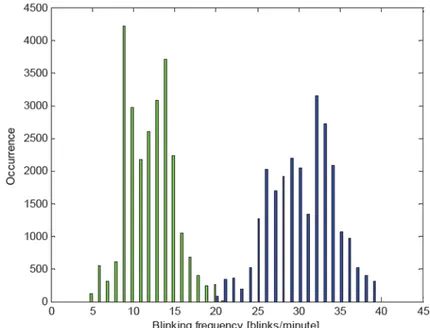
and drowsy (blue) states. . . 38 3.9 Detected blink frequency for alert (green) and drowsy (blue)
states. . . 39 3.10 Distribution of detected blink frequency for alert (green) and
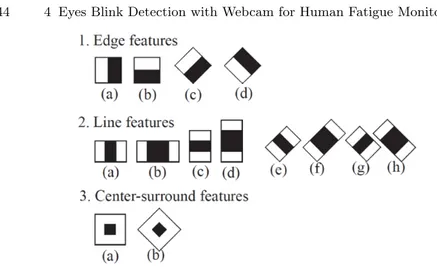
drowsy (blue) states. . . 39 4.1 Block diagram of the blink detection. . . 43 4.2 Example of Haar-like features used for cascade training. . . 44 4.3 Cascaded structure of the detection cascade. A series of
classifiers are applied to every sub-window eliminating a large number of negative examples with very little processing and only very few negatives require additional computation. . . 44 4.4 Detected regions (red) with indicated pair of eyes (green
rectangles). . . 45 4.5 A frame during eyes detection in the case of head movement:
the large blue rectangle shows the region where to search and the small red one shows the detected eyes region. . . 46 4.6 Detected regions when the eye is open (a), closed (b), and the
resulting difference mask (c). . . 47 4.7 Greyscale (a) and binary images of opened eye (b), Greyscale
(c) and binary images of closed eye (d). . . 47 4.8 a) closures and openings, the area value represents the
percentage of pixels that were detected as changed; b) percentage of the maximum values of the vertical projections of the eyes regions respect to the region height; c) detected
blinks. . . 49 5.1 ECG wave with detected heart beats. . . 54 5.2 Spacelabs 90207 ABP Monitor. . . 55 5.3 The pulsatile (AC) component of the PPG signal and the
corresponding electrocardiogram. . . 56 5.4 Reflection (a), and transmission (b) modes for video acquisition. 56
List of Figures XVII
5.5 CMS50DL finger pulse oximeter SpO2 monitor. . . 57
5.6 Measurement results showed in SpO2 Manager. . . 57
5.7 The features of the PPG pulsatile component: Pulse Height, Peak Threshold, Cardiac Period, Full Width Half Max, and Peak Width. . . 58
5.8 Signal acquisition principle of a PPG imaging system. . . 59
5.9 The iHealth Blood Pressure Monitoring System. . . 60
5.10 Personalized health monitoring architecture. . . 60
5.11 General video capturing scheme with a smartphone equipped by LED. . . 63
5.12 The PPG acquisition algorithm includes: correct usage verification, calibration and measurement stages. . . 64
5.13 Acquired frames and their histograms of the red, green and blue channels for different smartphones and in different lighting conditions: (a) HTC HD2 with LED, (b) Nokia 5800 with LED, (c) iPhone4 with LED, (d) HTC HD2 without LED and (e) Samsung Galaxy S i9000 without LED. . . 66
5.14 Distribution of the MIN, MEAN and MAX values of the pixels in RGB colour space for videos captured using different smartphone cameras and under different lighting conditions. . . . 67
5.15 Computed masks that satisfy the threshold on the frames, captured (a) from HTC HD2 with LED, (b) HTC HD2 without LED, and (c) Samsung Galaxy S i9000 without LED. . . 70
5.16 The pixels intensity and the surface of the red component for the frame captured from the Samsung Galaxy S i9000 smartphone. . . 71
5.17 Computing the PPG value: white is a thresholded area; dashed lines are the distances from the centroid to the boundaries; crossed out lines are the lines that do not have a boundary on the image and should be skipped; solid bold lines are the radiuses, computed as average values of the above distances, solid lines - circles inscribed into the figures with radiuses r; dotted lines are the parts of the circle that do not fit the picture. 72 5.18 ”Normal” and ”inverted” PPG waveforms. . . 73
5.19 Measured PPG during a time interval of 10s (a), and a corresponding Fourier spectrum. The evaluated value of PR is equal to 1.081 Hz (about 65 bpm) (b). . . 74
5.20 Accepted frames (a) and (b), frames recognized by the system as wrong because of not enough pressure of the finger (c), (d), wrong position on the camera (e), and missing of the contact between finger and camera (f). . . 75
5.21 Comparison between the photoplethysmograms obtained by the HTC HD2 smartphone and the oximeter. The peaks and the valleys of both signals correspond. . . 76
5.22 Comparison between the photoplethysmograms obtained by the HTC HD2 smartphone and the oximeter after squatting for 60 s. Also in this case the peaks and the valleys of both
signals are highly correlated. . . 77 5.23 PPG waveforms obtained from (a) Nokia 5800 with the
LED enabled, (b) iPhone4 with LED, (c) HTC HD2 without LED, (d) Samsung Galaxy S i9000 without LED, and the corresponding waveform, acquired from a CMS50DL Finger
Pulse Oximeter SPO2 Monitor. . . 78 6.1 Block scheme of the method to evaluate the PR. . . 83 6.2 Evaluation of the peak coordinates from to the PPG signal. . . 83 6.3 Positioning of the ABP and the smartphone for simultaneous
PR evaluation. . . 84 7.1 Korotkoff blood-pressure measurement method. . . 88 7.2 Parameters of the PPG pulsatile component for ANN training
and BP estimation. . . 91 7.3 Artificial neural network architecture for SBP and DBP
estimation. . . 91 7.4 Extracted PPG (a) and the corresponding BP (b) waveforms
from MIMIC Database. . . 92 7.5 Diastolic time vs. systolic blood pressure and a possible linear
regression line. . . 93 7.6 Diastolic time vs. diastolic blood pressure and a possible linear
regression line. . . 94 7.7 Performance of the ANN vs. number of hidden layers and
neurons. . . 94 7.8 Histograms of absolute errors to estimate: a) SBP using linear
regression, b) DBP using linear regression, c) SBP using 4-input ANN, d) DBP using 4-input ANN, e) SBP using
List of Tables
3.1 Stanford Sleepiness Scale. . . 26
3.2 Fatigue Severity Scale. . . 27
3.3 Factors that increment the blink frequency. . . 29
3.4 Factors that decrement the blink frequency. . . 29
3.5 The fatigue levels characterized by blink behaviour. . . 30
4.1 Summary of blink detection results . . . 50
5.1 Specification of the smartphones used for experiments . . . 74
5.2 Comparison between the PR evaluated from the HTC HD2 using LED and the CMS50DL Finger Pulse Oximeter SPO2 Monitor . . . 77
6.1 Comparison among PR evaluated by smartphones and ABP. . . . 85
7.1 Performance Results of Different Methods, Averaged over All Records (Mean Value± Standard Deviation). . . 96
1
Introduction
1.1 Motivations
A modern home is equipped with a multitude of technical devices. A closer examination of things we do in our life can give an idea how many measure-ments are made and how many measuring instrumeasure-ments we use for that. We use measurements in medicine, sport, building, transportation, to tell the time and make estimations, etc. [1, 2]. The number of measurements and measuring instruments rises dramatically from year to year. We use measurement devices at home, in the office, in a hospital, in a car, on the street and so on. Sometime we use very expensive instruments for doing only one type of measurements. So, is it possible to reduce somehow their number and the total cost?
1.1.1 The role of computers in measurements
Over the last few years computer-based signal and image analysis received great attention from researches. Using the processing power of computers and the advances in mathematical algorithms it is now possible to generate a wealth of information from an image once it has been digitized [3]. Special interest is in computer vision area as both the cameras and the processing algorithms are very powerful. Although the tasks are quite easy for humans, it causes many difficulties for developing of automated systems. However, it introduces a new concept of measurements - they become automatic, and contactless or even telemetric.
Photogrammetry is the science of making measurements from photographs. In particular, the goal is to determine the geometric properties of objects from photographic images, like the distance between two points that lie on a plane parallel to the photographic image plane. The fields of application of such technique are very wide and include topographic mapping, architecture, en-gineering, manufacturing, quality control, police investigation, geology. It is also used to combine live action with computer-generated imagery in movie post-production, in biomedicine, etc [4].
There are some commercial products on the market that try to use image analysis for getting some measurement information. As an example of such photo measuring system that turns a digital camera and computer into an electronic tape measure is Sticky Yard Digital Photo Measuring System [5]. By sticking a reference model on the object and taking a picture it allows to perform different measurements directly from the photo (Fig. 1.1).
Fig. 1.1. Measurements, provided by the Sticky Yard Digital Photo Measuring
System.
Although this system requires some reference and allows taking measure-ments only of one plane without doing any actual analysis of the object, there are more developments that try to use a scene geometry for more advanced measurements.
Another example of such systems is the CentreCam [6] - a development, based on the usage of low cost webcams for the model engineer. It gives a possibility of centring, edge finding and micro measurements on the model engineer’s milling machine or lathe (Fig. 1.2).
Typical image and video analysis applications include security and surveil-lance, medical imaging, traffic monitoring, manufacturing, quality control, ma-chine vision, industrial measurements, remote or non-contact video inspection, etc [7].
1.1 Motivations 3
Fig. 1.2. CentreCam: a webcam-based system to improve the technical process
accuracy.
1.1.2 Smartphones effect on image processing
Smartphone is a type of mobile device that provides advanced communication and performance possibilities beyond a typical phone. Many of smartphones are equipped by high-resolution touch screens, cameras, processors and light-emitting diode flashes. They run a complete mobile operating system that provides advanced computing capability. Together with the high-speed Inter-net access and Wi-Fi capabilities they become very interesting alternative to personal computers and laptops.
Indeed, as depicted in Fig. 1.3, the world smartphone sales increase rapidly and reached 169,2 millions of units in the 3rd quarter of 2012 [8].
Fig. 1.3. Worldwide smartphone sales to end users from 1st quarter 2009 to 3rd quarter 2012 (in million units).
According to the Imaging Confluence Study by leading market research company ”The NPD Group’s”, the percent of photos taken with a smartphone reached 27 percent while the share of photos taken on any camera dropped to
44 percent [9]. That means that for many people smartphones have replaced cameras.
Moreover, besides making just photos and videos, nowadays smartphone cameras are often used as input devices in numerous research projects and commercial applications. In addition to the usual back camera, most of the current smartphones are equipped with a front camera enabling the possibility of video conferencing.
Indeed, there are a number of initiatives that make use of a built-in cam-era to create applications for object recognition, face detection, navigation, user interaction, games, etc. There are also many projects that try to con-vert the smartphone to a mobile telemeter measure tool for object length, width, size, angles, area and dimensions measurements that can be used as a ruler, tape measure or planimeter. Moreover, the usage of additional sensors like accelerometer together with application of geometrical projections allow estimating even the distance to the object.
1.1.3 Specific character of measurement in images and video
Measurements using images and video is a new challenging research direction. As it was mentioned already, computer vision technologies can turn an ordi-nary video camera to a powerful tool for counting, measuring and inspecting. For example, it’s possible to measure automatically object dimensions from a single picture, indicating some reference or even to analyse the object be-haviour in a time as video is a unique multimedia data type that contains many spatio-temporal information.
However, measuring in images or video is not as usual as with normal instruments. Instead of direct access to the measuring object and its charac-teristic, there are just digital images or videos.
In general, still digital image is a numeric representation of the visual perception that has a similar appearance to some physical object or a person. Normally they are raster, two-dimensional images and can be captured by optical devices such as cameras, telescopes, microscopes, etc. Raster images have a finite set of digital values, called pixels and allocated into rows and columns. They are the smallest individual elements of the image, representing the brightness of a given colour at any specific point.
Digital video is a series of bitmap digital images displayed in rapid suc-cession at a constant rate and representing scenes in motion. Such images are called frames and the rate at which frames are displayed are called frames per second (FPS).
Thus, considering a single image or a frame, all information that we have are pixel values. There is no information about objects, their shapes, features, etc. Definitely, that’s not what can give directly information about real-world objects. Therefore, the image processing techniques must be applied in order to extract additional information about objects in the scene [10, 11, 12].
1.2 Goals 5
1.1.4 Using camera as a measuring device
Up to now, cameras are used mostly as interaction devices. Meanwhile, using the camera as a measuring sensor is very interesting, giving the possibility to create a ”universal” measurement instrument. Indeed, just changing the software and the way how the captured information is processed it’s possible to perform different measurements.
Any imaging device can be used to acquire information about measuring object: a static camera, digital camera, video camera, webcam, smartphone camera and so on. Then, a specific algorithm installed on computer, smart-phone, or even on reprogrammable integrated circuit can provide appropriate measurement results (Fig. 1.4).
Fig. 1.4. General structure of camera-based measuring instrument.
Normally, the following steps should be performed in order to obtain mea-surement results from a camera-based system (Fig. 1.5):
• acquire image or video;
• verify the correct usage of the system; • find the object of interest;
• track the object between frames in order to obtain information over time; • analyse obtained information and perform measurement.
1.2 Goals
The main goal of the research is to use image processing techniques to ex-tract information from images and video for different kind of applications: video surveillance systems, human-computer interaction, and biomedicine. The common task for all such applications is to obtain information about contours and geometrical shapes of the objects based on pixel examination,
Fig. 1.5. Measuring algorithm using the camera.
and proceed with it in a time to extract different measurement information concerning environment and physiological parameters.
Therefore, the first objective of this thesis is to use a single image affected by a motion blur and extract dynamical parameters of objects in it. Motion blur is the alteration that appears on the image due to the relatively large difference in velocity between the objects in a scene in comparison to the camera exposure time. It is usually considered as an extra noise that affects the quality of the image. However, if detected properly it can be also used to obtain some characteristics about the object movement. In particular, the technique is to find affected by local motion blur regions in the image in order to estimate the direction and the length for each moving objects. If the length and the orientation can be identified it is possible to recover the speed of the object.
1.3 Structure of the Ph.D. Thesis 7
Passing from the static image to video, the next objective is to monitor the human fatigue level using analysis of the eyelids blinks. It is well known that the eye blink rate is a significant indicator of the fatigue and can be used to evaluate the human sleepiness. It’s expected to use both an infrared camera and a webcam in order to create a non-invasive blink detection and analysis system. It will be also investigated how to distinguish the voluntary blinks from the involuntary ones, as only the last are correlated with the fatigue.
Finally, the last objective is to investigate the possibility of smartphone usage to acquire the photoplethysmogram signal and monitor vital parame-ters, such as pulse rate and blood pressure. Monitoring of vital parameters was always an important task and many research efforts have been done to make it easier, faster and more accurate. A particular attention is given to make the measurements non-invasive. One of such ways to obtain temporal variation in the blood volume is to use a pulse oximeter. A smartphone, with its computa-tional power, high-resolution cameras and light-emitting diode flashes, is very similar to the pulse oximeter and can be used as a part of health monitoring system measuring vital characteristics.
Therefore, the overall research is dedicated to provide the novel image and video processing techniques and to show how they can be used for measure-ment of various environmeasure-mental and physiological parameters.
1.3 Structure of the Ph.D. Thesis
The content of the thesis is organised as follow:
Chapter 2 describes a new approach to detect moving objects affected by motion blur. An overview of the motion blur detection techniques is given. The proposed method of local motion blur detection, based on calculation of the local standard deviation of the image and scanning of all sub-images using the partitioning algorithm with dynamic window size is described. The usage of Fourier and Radon transformations to compute the motion characteristics for each detected region is explained and the experimental results are given.
Chapter 3 presents the infrared camera-based contact-less system used to estimate the fatigue level. The existing blink detection and fatigue analysis techniques are discussed. The infrared camera-based contact-less system is proposed to estimate the fatigue level. The switching infrared light is used to detect the pupil in each frame and, as a result, the blink event. The camera frames processing algorithm is pointed out in order to distinguish involuntary blinks from the voluntary ones. The experimental tests are shown to validate the proposed hardware and software system.
Chapter 4 introduces a non-invasive vision-based system for eye blinks detection and fatigue level monitoring using a webcam, positioned in front of the face. An introduction to the problem is given and the improved system is proposed. The cascade of boosted classifiers based on Haar-like features is presented for fast detection of the eyes region. The algorithm of frames
differencing in combination with the thresholding are shown to detect the eyes closure and opening. The frame processing algorithm is pointed out in order to distinguish the involuntary blinks from the voluntary ones and experimental results that validate the proposed system are given.
Chapter 5 shows the next step for measurements in image and video by involving mobile devices. The analysis of techniques to control heart activity is presented and the possible solutions are discussed. Several smartphones are tested in order to define the common characteristics of the captured video, and establish proper criteria for PPG extraction. The appropriate algorithms are proposed and validated to verify the correct device usage, the system calibration, and the PPG acquisition. The experimental results are presented to confirm the correctness and suitability of the proposed method with respect to the oximeter measurements.
Chapter 6 presents the robust and reliable method for pulse rate evalu-ation using a smartphone. The usage of the smartphone camera to evaluate volumetric variations of blood by monitoring the change of light absorption in the tissue is discussed. The algorithm of pulse rate evaluation is presented and explained. To validate the pointed out method, the evaluated by smartphone pulse rate is compared with the results of the Spacelabs 90207 Ambulatory Blood Pressure monitor. The experimental tests are performed and discussed to confirm the correctness and suitability of the proposed method.
Chapter 7 deals with the continuous blood pressure estimation. An overview of the current blood pressure measurement devises is given and the new trends of non-invasive measurement are presented. In order to overcome the draw-backs of existent solutions, the usage of artificial neural networks is described. The structure of the training data, obtained from the Multiparameter Intel-ligent Monitoring in Intensive Care waveform database, are presented and parameters extraction is discussed. The experimental results are given as well. Last chapter contains the conclusions and summaries of this thesis. Possi-ble avenues of further work are also discussed.
Part I
2
Detection and Parameters Estimation of
Locally Motion Blurred Objects
This chapter presents a new approach to detect moving objects affected by motion blur. The direction and the length of the blur reflect the original motion of the object during a time of picture acquiring by the camera (shutter speed). The image analysis in the spectrum domain using Discrete Cosign or Fourier Transforms allows detecting the motion blur direction and speed. However, such techniques do not work when there are few objects on the image with different blur, or complex background. The proposed method of local motion blur detection is based on image partitioning and allows locating only the regions affected by the motion blur and, therefore, correct measuring the motion parameters of multiple objects.
2.1 Introduction
Motion blur is an alteration that appears on the image due to relatively large difference in the velocity between objects in a scene and the camera exposure time [13]. Motion blur is usually considered as an extra noise that affects the quality of the image. However, if detected properly it can be also used to obtain some characteristics about the object movement. In particular, for any fixed shutter speed of the camera, the moving length of the object is proportional to the amount of blur caused by the imaging process. Thus, if the length and the orientation of the motion blur can be identified it is possible to recover the speed of the moving object [13].
Methods of blur detection can be divided into two groups: methods of the first group intend to analyse the spatial domain while the ones of the second group use different techniques, like Fourier Transform, to analyse the fre-quency spectrum [14]. Generally, the methods operating in frefre-quency domain are more powerful for motion blur detection.
In [15] was proposed an approach that is based on the theory of Fourier Transformation to detect the vehicle speed from a single motion blurred image.
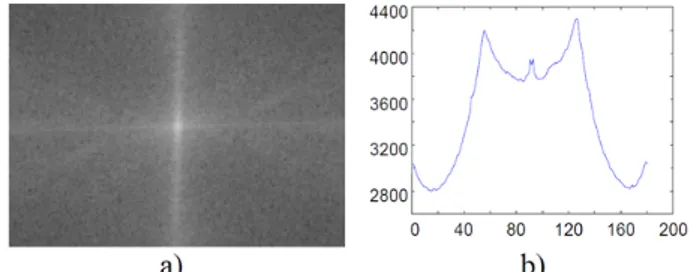
In particular, the parallel lines appear on the 2D spectrum of the motion-blurred imaged. The distance and orientation of these lines are directly related with the motion length and direction [16] (Fig. 2.1).
Fig. 2.1. Example of motion blurred circular image (a) and its Fourier spectrum
(b).
However, the authors reported the problem of partial motion blur detec-tion, i.e. when only the foreground object is moving and the background does not change. The improved approach was presented in [17], where authors pro-posed to use an image matting technique. But it still requires to mark the foreground and background regions manually, that does not allow developing of the automatic procedure.
In [18] was proposed to use the fuzzy sets for motion parameters detection. The Radon Transform was used to detect motion orientation, using the angle of the dark parallel lines on the Fourier spectrum. For the noised images, such lines are not visible clearly and the detection of white bound in the centre of image was used. The motion length was estimated as the distance between the first valleys (minimum peaks) using the fuzzy sets.
In [19] proposed a method to estimate the motion by calculating the dif-ference of the spectra of two different images: with motion blur and without. In this way, spectrum, caused by motion blur, can be distinguished using the Fourier Transform theory. The motion orientation is computed then by de-tecting the spectrum peak in the polar coordinates, while the motion length is calculated as the distance between the first negative peaks of the cepstrum signal, starting from the centre. However, the disadvantage is that it is nec-essary to acquire two images, and only one of them must contain the motion blur.
Another approach that uses Wavelet transformation to detect the motion blur was proposed in [20]. It was applied to remove the noise, but not to detect the motion length. Moreover, only the cases, where the motion blur affects the entire image were considered.
2.2 Local Motion Blur Detection 13
The above methods of motion blur detection in the frequency domain are powerful but not suitable in case of (i) complex still background, (ii) small size of the moving object in comparison to the image dimensions, or (iii) more than one object is moving with different speed and/or in different directions. In such cases so usual for the real-world situations the Fourier Transform does not show the clear picture. Moving of several objects affects the entire Fourier spectrum and makes impossible distinguishing of the proper orientation and motion length (Fig. 2.2a-b), even if the objects move in the same direction but with different speed (Fig. 2.2c-d). In the case of complex background, the overall noise as well as the sharp boundaries affect the spectrum and motion is not detectable automatically (Fig. 2.2e-f).
To detect regions with the local motion blur in [21] was proposed to go through the image with a fixed-size window and compute the Discrete Cosign Transform (DCT) to each of them. Alternatively, in [22] was proposed a frame-work that uses a local power spectrum slope, gradient histogram span, and the maximum saturation to detect the local motion blur. However, the first approach deals with the fixed-size window that does not take into account object dimensions and the second one requires a colour image, while very of-ten there is just a greyscale one. Moreover, greyscale images usually are more contrast and, therefore, more details can be extracted.
In [23] the image segmentation was performed using a modified version of the K-means clustering algorithm. Thus, the input image was divided into rectangular sub-regions with assigned uniform Point Spread Function (PSF). The proposed technique is able to detect different motion blur, but does not reject the regions with no blur. Therefore, it can be applied to process images from moving camera, where the entire image is affected by motion blur, but for the static camera with a local motion blur it does not work.
This chapter introduces a new method to detect the locally motion blurred regions in the image with complex background. It is based on calculation of the local standard deviation of the image pixels and scanning of all sub-images using the partitioning algorithm with dynamic window size [24].
The chapter is organized as follows: in Section 2.2 it is described the method of blurred segments detection, in Section 2.3 the motion orientation and the length detection algorithm is presented, Section 2.4 shows the exper-imental results and in Section 2.5 concluding remarks are given.
2.2 Local Motion Blur Detection
As seen from Fig. 2.2, the spectrum does not give a clear and solid direction of the motion blur. Therefore, it is impossible to obtain the motion parameters of each object just computing the Fourier transform to the entire complex image. Thus, it is necessary to perform the segmentation and extract only the regions with motion blur.
Fig. 2.2. Different images (a, c, and e), and the corresponding spectra (b, d, and
f).
The proposed approach is to retrieve information about boundaries, fol-lowed by the image partitioning algorithm to check the statistical parameters in each of sub-images and reject the ones that doesn’t contain motion blur. The block scheme of the complete procedure to detect the local motion blur is shown on Fig. 2.3.
Obviously, the boundaries of the regions that contain motion are smooth and the regions without motion blur are sharper.
Thus, for each pixel of the input image the standard deviation value of the 3-by-3 neighbourhood is computed as
2.2 Local Motion Blur Detection 15
Fig. 2.3. Block scheme of the procedure to detect the regions with a local motion
σ(x, y) = v u u t 1 N N ∑ i=1 (I(x, y)i− µ(x, y))2, (2.1)
where the N is the size of the neighbourhood window and µ(x, y) - mean value of the neighbour pixels for pixel I(x, y).
Fig. 2.4 shows an example of such computation. The different motion blur was added manually to the two objects, while the rest background remained sharp. As it can be seen, the boundaries of the objects with motion blur are not so strong and, therefore, easily detectable.
Fig. 2.4. Original image (a) and the result of local standard deviation computation
(b).
To detect a local region it was used the method of image partitioning into sub-images (windows). The default window size was defined as 16x16 pixels and it changes depending on the standard deviation value in the current window, computed for the local standard deviation on image σST D and for
original image σI. Comparing the values of the standard deviation for each
window with the threshold T , established as the maximum value for the images with no motion blur, the following situations are possible (Fig. 2.5):
1. σST D ≥ 2 ∗ T means that there are strong boundaries in this window and
no motion blur. Therefore the window is rejected (Fig. 2.5c).
2. T ≤ σST D < 2∗ T means that only some part of the sub-image contains
strong boundaries and the rest is smooth. In this case the current window is divided into 4 smaller ones and the decision is made for each of them. 3. σST D < T, σI < T means that there are no strong boundaries in this
window and the values of the original image have very small deviation, i.e. have similar texture which is not a case of the motion blur (Fig. 2.5d). 4. σST D < T, σI > T means that there are no strong boundaries on the
image, but also the texture is not similar. This is the case of motion blur (Fig. 2.5e).
2.3 Estimation of the Motion Blur Parameters 17
Fig. 2.5. Result of image partitioning (a), trend of sigma values in each window
(b), extracted sigma values in windows with no motion blur and sharp edges (c), simple texture with no motion (d), and motion blurred ones (e).
Thus, considering the above cases it is possible to reject background and leave only the regions with the motion blur. After performing such image partition, the binary mask is obtained with ”0” at the pixel positions with no motion blur and ”1” where it is present. Then the series of morphological operations is applied to remove the isolated pixels.
Finally, each of the detected regions is extracted and considered as a sep-arate one.
2.3 Estimation of the Motion Blur Parameters
The model of the blurred image can be considered as
g(x, y) = f (x, y)∗ h(x, y) + n(x, y), (2.2) where g(x, y) is the observed image, f (x, y) is the original image, n(x, y) is the noise function, and h(x, y) is the PSF causing the motion blur. The symbol∗ stands for the convolution operation.
To establish the nature of the motion blur, it was used the technique from [25] that allows distinguishing of the motion blur from the out-of-focus blur as well as the case without blur.
The algorithm to determine motion parameters was used as in [18]. Con-sidering the case with the linear motion and uniform velocity, the blur can be specified by the motion length R and the direction θ. The PSF h(x, y) can be written then as [15]
h(x, y) = { 1 R, |x| ≤ R 2 cos θ, y = x tan θ 0, otherwise . (2.3)
The Fourier transform of (2.2) is
G(x, y) = F (x, y)∗ H(x, y) + N(x, y), (2.4) The Fourier transformation of the function h(x, y), defined in (2.3), is a SINC function, oriented in the direction of the blur. To estimate the blur angle and the blur length it is necessary to identify the ripples in G(x, y). The shape of the SINC function does not depend from the image or its dimension, but only from the parameters of the motion blur.
The direction of the motion blur was determined by computing the Radon transform from Fourier spectrum G(x, y) as [26]
R(t, θ) = +∞
∫
−∞
f (t cos θ− u sin θ, t sin θ + u cos θ)du. (2.5)
Finally, the motion length can be estimated using [18]:
L = N
d, (2.6)
where d is the distance between the first two valleys from centre of the Fourier spectrum, and N is image dimension.
2.4 Experimental Results
The different motion blur was added manually to real pictures in order to es-timate the accuracy of blurred objects detection. Fig. 2.6a) shows the Fourier spectrum of the picture from Fig. 2.4a) while the Fig. 2.6b) shows the com-putation of the motion blur orientation using Radon Transform.
Fig. 2.6. Fourier Transform (a) and maximum values for each angle of the Radon
2.4 Experimental Results 19
Fig. 2.7 shows the detected regions with the local motion blur. Fig. 2.8 shows the estimation of the motion angle for each detected region and Fig. 2.9 shows the original image without motion blur as well as their detection result. The regions that were found are too small and were rejected.
Fig. 2.7. Detection results of the regions with local motion blur.
Fig. 2.8. Estimation of the motion blur parameters: a) first extracted region, b)
its Fourier spectrum, c) computation of the rotation angle, equal to 45°, d) second extracted region, e) its Fourier spectrum and f)computation of the rotation angle, equal to 128°.
Fig. 2.10 shows another example of motion blur detection on the image with a similar texture of the background and Fig. 2.11 shows a computed mask when the image was affected by the global motion blur.
Fig. 2.9. Detection results on the image without motion blur: a) original image, b)
obtained mask.
Fig. 2.10. a) Original image, b) computed mask, c) extracted region.
2.5 Conclusions 21
2.5 Conclusions
The chapter is devoted to detection in the image of the regions, affected by local motion blur, in order to estimate the direction and the length for each moving object. Calculation of the image standard deviation allowed rejecting still background and extracting only the blurred regions. The algorithm works also in the case of global motion blur presence or monotonous background.
Part II
3
Blink Rate Measurement using Infrared
Camera for Non-invasive Fatigue Monitoring
Passing from static images to video allows measuring additional characteris-tics of the objects that change over time. For example, the eye blinking is a significant indicator of the sleepiness and fatigue, and can be detected by analysing a video frame by frame. The existing systems of blink detection and fatigue analysis usually require fixing the camera on a spectacle frame or on a special helmet, that is not convenient and can affect the obtained results. In this chapter, the infrared camera-based contact-less system is proposed to estimate the fatigue level. The switching infrared light is used to detect the pupil in each frame and, as result, the blink event. The camera frames processing algorithm is pointed out in order to distinguish involuntary blinks from the voluntary ones. The experimental tests are shown to validate the proposed hardware and software system.
3.1 Introduction
Sleepiness is the physiological state of near-sleep or a strong desire for sleep. It is correlated with fatigue level, that is a transition period between wake and sleep state, and, if not interrupted, causes falling asleep [27]. Sleepiness, a tendency to fall asleep or even decrement of the attention, cause a series of negative consequences that are reflected on the everyday life.
Sleepiness and fatigue are terms commonly used in both clinical practice and research literature. Both sleepiness and fatigue are ubiquitous phenom-ena. They negatively affect the daily functioning and patients who have these feelings are distressed [28].
Advances in computer vision area in the last years allow to automate many everyday tasks in order to make the life safer and easier. Therefore, development of automatic sleepiness and fatigue evaluation techniques that could prevent accidents is very interesting.
3.1.1 Sleepiness
Sleepiness is an ubiquitous phenomenon, experienced not only as a symptom in a number of medical, psychiatric and primary sleep disorders, but also as a normal physiological state by most individuals over any given 24 h period [29]. Generally, sleepiness means an increased propensity to doze off or fall asleep; it may be related to a low arousal level. Sleepiness is also defined as a tendency to fall asleep. It may be affected by different conditions, such as medical problems, psychiatric diseases and primary sleep disorders [28].
The sleepiness can be measured both subjectively and objectively [29].
Subjective measurement of sleepiness
Sleepiness rating scales broadly include two categories. Methods of the first category measure short term changes in sleepiness and include the Stanford Sleepiness Scale (SSS), Karolinska Sleepiness Scale (KSS), and Visual Ana-logue Scales. Methods of the second category measure a global level of sleepi-ness and include Epworth Sleepisleepi-ness Scale (ESS) and Sleep Wake Activity Inventory (SWAI) [28, 30].
Table 3.1 shows the Stanford Sleepiness Scale, that is one of the most widely used measures of subjective sleepiness [29, 31]. It consists of seven statements with different degrees of sleepiness and the subject should select one of them that describe better his/her current state.
Table 3.1. Stanford Sleepiness Scale.
Degree of Sleepiness Scale
Feel active and vital; alert, wide awake 1 Functioning at a high level, but not at peak, able to concentrate 2 Relaxed; awake; not at full alertness, responsive 3 A little foggy, not at peak; let down 4 Fogginess; beginning to lose interest in remaining awake; slowed down 5 Sleepiness; prefer to be lying down; fighting sleep; woozy 6 Almost in reverie; sleep onset soon; lost struggle to remain awake 7
Objective measurement of sleepiness
Besides the subjective measurement of sleepiness, also objective methods ex-ist. Most popular are Multiple Sleep Latency Test (MSLT) and Maintenance of Wakefulness Test (MWT) [28, 29]. Generally, besides the objective evalu-ation of the sleepiness, such test require from subjects to stay for some time in a dark room in order their state is been fixed. Because of complicated procedure, these methods can’t be done automatically.
3.1 Introduction 27
3.1.2 Fatigue
Fatigue, like sleepiness, is a highly prevalent phenomenon, associated with a significant level of physical and psychosocial morbidity. It is a commonly reported chief complaint in medicine and it is the primary symptom of chronic fatigue syndrome [29]. Symptoms of fatigue are commonly reported in patients with depression, chronic fatigue syndrome, cancer, etc. Fatigue may be also a side effect of a number of medication treatments [28]. It has been identified as major debilitating and even life-threatening factor in working populations [32].
Subjective measurement of fatigue
While the sleepiness, as it was described above, can be measured both subjec-tively and objecsubjec-tively, there are no techniques to measure fatigue level objec-tively. Nevertheless, there are many subjective rating scales which have been developed to measure fatigue. These scales provide a wide range of tools which are of interest both in the mental health field and in the somatic domain [28]. The Fatigue Severity Scale is a nine-item scale and is one of the best known and most used (see table 3.2) [29, 33]. Subjects are asked to respond the ques-tions giving a mark between ”1” (Completely disagree) and ”7” (Completely agree).
Table 3.2. Fatigue Severity Scale.
During the past week, I have found that: Value 1. My motivation is lower when I am fatigued 1-7 2. Exercise brings on my fatigue 1-7
3. I am easily fatigued 1-7
4. Fatigue interferes with my physical functioning 1-7 5. Fatigue causes frequent problems for me 1-7 6. My fatigue prevents sustained physical functioning 1-7 7. Fatigue interferes with carrying out certain duties and responsibilities 1-7 8. Fatigue is among my three most disabling symptoms 1-7 9. Fatigue interferes with my work, family, or social life 1-7
Unfortunately, this technique can’t be used for automatic fatigue evalua-tion, so more advanced solutions mush be found.
3.1.3 Relation between blink frequency and behavioural factors
The eyelid is a skin-membranous organ that covers the eye and plays an important protection work, contributing to the distribution of the tear fluid. There is an upper eyelid (larger) and a lower eyelid, both with lachrymal glands and eyelashes. They have a function of protecting from excessive light and from dust as well.
As it was mentioned before, the blink occurs when the upper eyelid and the lower part are joined and the eye is temporarily closed [34].
Initially it was thought that the spontaneous beat of the eyelids was just a random phenomenon which has the purpose to lubricate and clean the eye from dust and external agents. Ponder and Kennedy (1927) were the first to be interested in this phenomenon. They initially agreed that the only purpose of the blink was to lubricate the cornea and that the blinking of the eyes was only a natural reflex of the eye. One of the experiments they carried out was to confirm such theory. Indeed, the eye reaction on the cigarette smoke was subjected. This condition caused significantly increase of the blink frequency. Later it was demonstrated as a result of numerous experiments, that there is a psychological reason why there is certain behaviour of the eyes. Ponder and Kennedy noticed that in all experiments carried out by them, the frequency of the blink did not change as long as the conditions of the experiment did not change. For example, if a person was intent on reading the blink frequency remained constant. But when the subject began to speak, the blink frequency changed. In addition, they found that this parameter mostly depends on the degree of subject attention and the mood during the test. However, the sci-entific demonstration wasn’t provided as it was difficult to make that test on different subjects with the same state of mind. The correlation between the central nervous system and the movement of the blinking of the eyes, however, was evident. Ponder and Kennedy then came to the conclusion that the blink is not only a natural reflex of the eye, but this phenomenon occurs under the control of the central nervous system [35].
A recent study showed that the pupil dilation and the blink are indices of information processing by the brain. The results of this experiment show that the blink occurs during the early stages sensory processing and, consequently, during information processing, while the dilation of the pupil reflects better the acquisition phase of the information by central nervous system. It was also observed that immediately before the central nervous system process informa-tion, the blinking suspends. On the other hand, it occurs immediately after information processing and is interpreted as a rapid blink if the information is associated to a cognitive error. A further point that emphasizes the direct modulation between the blink and the nervous system, is represented by the transition between the interoceptive state of mind (sensitivity from outside of the body) and a state in which the exteroceptive information comes from external factors. During the interoceptive state has been observed a tendency to keep eyes closed, and, contrariwise, in a exteroceptive state the subject is tending to keep eyes open [36].
Other studies report the relationship between the reading and the blink frequency. One of the first studies was conducted by Katz using himself as subject. He used a Marey capsule (first instrument designed for heartbeat measurements) connected to the orbital muscle and recorded in this way the number of beats of the eyelids. He made 3 successive measurements each time under different intensity of the light. It was noticed that after the first 5
min-3.1 Introduction 29
utes of reading, especially when reading with a low light intensity, the number of the eyelids blinks increased. Therefore, as the result it was concluded that the blink frequency is a reasonable parameter to measure eye fatigue [37].
Table 3.3 lists factors that cause increment of the blink frequency while in the Table 3.4 are listed factors that decrement such frequency [38].
Table 3.3. Factors that increment the blink frequency.
- Conversation - Anxiety - Fatigue
- Irritant environment conditions (air conditioning, heating, smoke) - Poor stability of tears
Table 3.4. Factors that decrement the blink frequency.
- Reading
- Difficulties with visual functions - Computer usage
- Cornea anaesthesia
Since the eyes blinking depends on several factors, both physical and psy-chological, is difficult to associate fixed frequency, at which it occurs. However, several studies, carried out in the last years, have shown some correlation be-tween the blink parameters and the level of fatigue.
In particular, the literature has demonstrated that the blink frequency depends on emotional and physical state of the person [39]. In particular, the eye blink is a significant indicator of the fatigue and can be used to measure the fatigue [40]. In [41] was demonstrated that the daily pattern of spontaneous eye-blink rate is a non-invasive peripheral measure of central dopamine activity.
3.1.4 Blink parameters as fatigue measure
Psychologists and physiologists are interested in the psychological and be-havioural factors, responsible for the blink. Fatigue is one of them. While some studies report the relationship between mental fatigue that is referred to as effects on the time-on-task (TOT), others show how the transition between the state of awake (no fatigue) and sleepy is characterized by a particular behaviour of the eye parameters, such as duration and frequency of the blink.
In [42], the 11 subjects underwent a driving simulation dividing the drowsi-ness in 4 stages: awake, reduced alertdrowsi-ness, drowsy and sleepy (Table 3.5). The experiment confirmed that the fatigue (the transition between the states wake up and reduced vigilance) is characterized by an increase in the frequency of blinking.
Table 3.5. The fatigue levels characterized by blink behaviour.
Drowsiness stage Description
Awake Long blink intervals and short blink durations. Low vigilance Short blink intervals and short blink durations. Drowsy Long blink durations.
Sleepy Very long blink durations and/or single sleep events and/or a low eyelid opening level.
An alert subject has a high blink frequency with a short duration, while a sleepy person is characterized by higher than normal blink duration and has difficulties to open eyes immediately, so it has a higher eyelids opening time. It should be noted that the spontaneous closure of the eyelids has a dura-tion of 200 ms and the frequency ranging from 10 to 20 beats per minute [38].
3.1.5 Physiological measurement
Recent techniques of fatigue and sleepiness measurement involve sophisticated tools like Electrooculogram (EOG) and Electroencephalogram (EEG). The physiological measurements are used to provide a direct and objective mea-sure of the state of sleepiness and fatigue. The electroencephalogram signal is widely accepted as a good indicator of the state of subject drowsiness. It is done by measuring the electrical activity generated by nerve cells in the brain. In addition, the duration of the eye blink, the frequency, the delay in the eyelids opening, and slow movements of the eyes can be good indicators of the degree of fatigue and sleepiness. These parameters are measured by electrooculogram [27]. Normally, they require placement of electrodes on the subject’s face or head. These instruments provide an objective measure of the fatigue level and are widely used in medicine, together with the use of different scales which allow a subjective measure of the phenomenon.
Electroencephalogram
Electroencephalogram is a recording of the electrical activity along the scalp. It measures voltage fluctuations resulting from ionic current flows within the neurons of the brain [43]. To get the EEG measure during a fatigue state, data must be collected during the period from awake to the first sleep occasion.
3.1 Introduction 31
The signal is classified then according to its frequency and the behaviour in the time changes during the different stages of sleep, or during the perfor-mance of cognitive tasks, focusing etc. The electrical activity of the brain is classified according to rhythms, which are defined in terms of frequency bands including [27]:
• Delta activity: these are slow waves between 0.5 and 4 Hz. Delta waves have been shown to be present during transition to drowsiness and during sleep.
• Theta frequency: is an activity within the frequency range of 47 Hz. Theta rhythms are associated with a variety of psychological states including hypnagogic imagery, and low levels of alertness during drowsiness and sleep and as such has been associated with decreased information processing. • Alfa waves: has a frequency range of 813 Hz and occurs during wakefulness.
The alpha rhythms are present during an alert and relaxed state.
• Beta waves: they are fast (1330 Hz) EEG potentials associated with in-creased alertness. Beta activity has been reported to occur in humans while performing a reaction-time motor task.
The difference of potentials is measured between pairs of electrodes placed on the scalp (bipolar recording) or between each electrode and a reference electrode positioned on ear or nose (monopolar recording). The measurement is done by placing of 20 electrodes according to the so called system ”Interna-tional 10/20”. That means that electrodes are positioned at a distance equal to 10% and 20% of the distance between 4 anatomical points: the nasion (nasal), the inion (bone projection of the rear part of the head), and right and left points of periauriculars [44]. Fig. 3.1 shows the positioning of the electrodes.
Fig. 3.1. Positioning of the electrodes: F frontal area, O occipital area, C
Incrementing of the alpha and theta EEG rhythms and reduction of beta have been interpreted as an indication of fatigue [45].
Electrooculogram
Electrooculogram is an instrument that allows detecting eye movements. It is used to measure the difference of potentials between the cornea and the retina. The eye in this way behaves as a dipole and the movements cause its rotation that gives rise to potential differences oscillating, superficially detectable. These signals are used as a measure of eye movement. In order to acquire a EOG, the electrodes are fixes of the subject’s face as shown in Fig.3.2. To reduce the impedance between the electrodes and the skin, a special solution should be used on electrodes before making a measurement.
Fig. 3.2. Correct positioning of the electrodes for EOG measurements.
The two type of measurements can be done: the vertical one (also called monocular), when the electrodes are positioned on a single eye (yellow dots in Fig. 3.2), and the horizontal one (biocular), when the electrodes are positioned on the corners of the eyes (green dots in Fig. 3.2).
The blink duration is evaluated from electrooculogram as shown in Fig. 3.3 and means the distance between the point at which the rise time and the fall time reaches 50% of its amplitude. The need to identify a duration of a blink in the following way lies in the fact that it is difficult in the measured EOG signal to detect the precise point at which the blink starts [44]. It is also possible to measure the number of blinks per minute (frequency).
Fig. 3.4 shows the different variation pattern in the EOG signal depending on the subject’s fatigue.
In the everyday life, however, it would be useful to have a non-invasive system to monitor fatigue.
3.1 Introduction 33
Fig. 3.3. Definition of the blink duration, measured from EOG signal.
Fig. 3.4. Changes of the EOG signal in awake and drowsy conditions. 3.1.6 Non-invasive blink detection techniques
There are several techniques for non-invasive eye blink detection. Many of them are based on contact lenses, electrodes, specialized hardware, and in-frared (IR) emitters. Such systems could easily be separated into three groups, according to the approach used: methods using the electric potential of the human skin [46], methods involving contact lenses [47], and methods involv-ing image analysis [48]. For blink detection, the image analysis is preferred as it is a non-contact method of analysis and it does not affect the human behaviour [49].
In [50] the contact free system based on IR camera fixed on a spectacle frame is proposed, while in [51] a special helmet is used to fix the IR camera. Wearing of the camera allows locating the eye position in a very easy way. However, it is not convenient and is uncomfortably because the camera must be worn during the test. Then, it influences the person also on psychological level, changing the normal behaviour of the eyes.
This chapter presents a non-invasive system to monitor the human fa-tigue [52]. It is based on a IR camera that can be located in front of the user on the monitor or on the table. The person, therefore, can work as usual for-giving the camera and not concentrating on the test. This allows analysing the results obtained in a normal and usual environment and person’s behaviour. Moreover, the algorithm is pointed out to process camera frames in order to distinguish the involuntary blinks from voluntary ones. Such system allows monitoring the people’s sleepiness (fatigue) during their work with a computer
as well as to use it in many other places where the attentiveness is important, like driving a car, working with the machines etc.
The chapter is organized as follows. In Section 3.2 the approach is described for human eye segmentation which relies on pupil detection. In Section 3.3 the algorithm for blinks detection is described. In Section 3.4 the experimental results are presented, while in Section 3.5 concluding remarks are given.
3.2 Pupil Segmentation on Image
The IR camera is used to detect a pupil in the image. The working light spectrum is in the near-visible IR domain (860 nm), and the visible light is cut by the IR-pass filter. The examination object is illuminated by the IR LED lightning. In this way, noise coming from the surrounding visible light sources is eliminated and the contrast of the pupil increases. All the images taken from the camera are in the greyscale space. To achieve higher resolution of the eye image with low-resolution cameras as well as increase the accuracy of tracking, only one eye in the frame is detected.
Pupil segmentation is implemented according to the method described in [53] and [54]. It uses the ability of the eyes retina to reflect the penetrated light beam exactly in the same direction as it comes. Hence, if two light sources are used, one on and another off the camera optical axis, the pupil is bright in frame when the on-axis light is on. Respectively, in the frame-shot during the off-axis light is on, the pupil is dark. The rest of the image has almost the same intensity in frames because the lights are close enough to the camera and object.
Thus, subtracting the pixel values of those two frames and finding the region with the greatest difference between pixels allows detecting the pupil.
The proposed algorithm in [53] uses two consequent frames to detect one blink. It means that the pupil detection rate for the camera with 30 fps is only 15 fps. To overcome this limitation, the frame sequence is compared. Thus, the odd frame is compared with the even one, and the even one is compared with the next odd, and so on (Fig. 3.5). That allows detecting the pupil with the same speed as the camera works.
After binarization of the difference image with optimal threshold according with the Otsu algorithm [55], some white dots remain, which can be assumed as noise. As can be seen in Fig. 3.5, by using combination of morphological operators erosion and dilation, the noise can be suppressed. Therefore, the white spot in the final image shows where exactly the pupil is in the image.
This way of finding the position of the pupil in the image is very fast and does not require complex tracking algorithms. As a result, the centre and the size of the white spot are estimated.
3.3 Proposed Algorithm of Blinks Detection 35
Fig. 3.5. Pupil segmentation procedure.
3.3 Proposed Algorithm of Blinks Detection
The detection of the blinks is performed by considering the size of detected pupil. The blink is detected when the pupil disappears or becomes very small. However, the data referred to the detected blink must be pre-processed in order to distinguish the voluntary and involuntary blinks.
Indeed, only the involuntary blinks are correlated to the emotional-physical state of the person. The count of the voluntary ones alters the measure of the observed parameters, i.e. frequency and duration. Moreover, the blinks can have different durations and may repeat after a very short time, both in the case of voluntary or involuntary blink.
Based on the previous considerations, the proper correction (normaliza-tion) of the detected blinks is performed according to the following consider-ations:
1. Detecting closed eye for few consequent frames. Since the average blink duration is 200-250ms [50], such blink should be considered as one for a
period of time that is less than the average. Moreover, it can also overcome that period. Therefore, only blink with duration less than 1s is taken into account (impulse i in Fig. 3.6a and b). Such threshold is established on the basis of the maximum delay in the close and open eyes [56].
Fig. 3.6. The detected (a) and the corrected (b) results of blink detection.
2. Detecting the eyes closing that is more than 1s. It means that the eye was closed not spontaneously. In this case, the detection of blinking rate should be stopped and restarted as soon as the pupil is detected again in the image (impulse ii in Fig. 3.6a and b).
3.4 Experimental Results 37
3. Detecting two blinks with short reopening time within 1s. Such situation is considered as a single blink since it’s similar to an involuntary blink [57] (impulse iii in Fig. 3.6a and b).
4. Detecting more than 2 consequent closing and reopening eyes means that abnormal behaviour occurs and it is caused by voluntary blink or some disease. They shouldn’t be considered during the blinking rate detection. Once the normal behaviour is detected, the count starts again (impulse
iv in Fig. 3.6a and b).
3.4 Experimental Results
The experimental tests were executed during watching a video for 30 minutes (1800 seconds), at 10:00 in alert state, and at 00:00 (midnight) in drowsy state. In total, for each test there were acquired 54000 frames by the system described above, with the frequency equal to 30 fps.
According to the literature [58], the average duration of the blink in a fresh state is 200-250ms, while the proposed system allows frames capturing with the frequency of 30 fps (each 33.3ms) that is enough to detect the blink.
Fig. 3.7 shows the detected blinks and the elapsed time from the previous one.
Fig. 3.7. Detected blinks and time interval between them for alert (green) and


![Table 3.1 shows the Stanford Sleepiness Scale, that is one of the most widely used measures of subjective sleepiness [29, 31]](https://thumb-eu.123doks.com/thumbv2/123dokorg/2878744.10159/46.892.221.678.602.749/table-stanford-sleepiness-scale-widely-measures-subjective-sleepiness.webp)