Corso di Laurea Magistrale in Ingegneria Biomedica
A
SSESSMENT OF
A
SCENDING
T
HORACIC
A
ORTIC
A
NEURYSM
PRIOR AND AFTER
V
ALVE
S
PARING
S
URGERY
:
A PATIENT
TAILORED
F
LUID
-S
TRUCTURE
I
NTERACTION MODEL ENHANCED
WITH
4D
FLOW
MRI
Supervisor:
Alberto Redaelli, PhD
Cosupervisor: Alessandro Caimi, PhD
Jonathan Weinsaft, MD
Author:
Guido Nannini
Matr. 905138
Academic Year 2018-2019
i
Sommario
vi
Abstract
xxi
Introduction
1
1.1 Anatomy and physiology
2
1.1.1 The heart
2
1.1.2 The blood
4
1.1.3 The vessels
4
1.2 Histology of blood vessels
6
1.3 Physiology of the aorta
7
1.4 Pathologies of the aorta
8
1.4.1 Aortic coarctation
8
1.4.2 Aortic dissection
9
1.4.3 Atherosclerosis
9
1.4.4 Thoracic aortic aneurysm
10
1.5 Overview of corrective procedures
12
1.5.1 Criteria for elective surgery
12
1.5.2 Surgical procedures
13
1.5.3 Early outcomes
16
1.5.4 Long-term outcomes
16
1.6 4D flow analysis
18
ii
1.7 Conclusions
24
State of art
25
2.1 Introduction
26
2.2 Fluid-structure interaction
27
2.3 Background equations
29
2.3.1 Kinematic description
29
2.3.2 Solid domain
32
2.3.3 Fluid domain
33
2.4 ALE kinematic description
33
2.5 Aortic numerical models
36
2.5.1 Fluid and solid domain
37
2.5.2 Boundary conditions
40
2.5.3 Results
42
2.5.4 Conclusions
46
2.6 Aim of the thesis
48
Material and methods
50
3.1 Introduction
51
3.2 Patient acquisition
52
3.3 Patient specific anatomy reconstruction
53
iii
3.4.3 Dynamic meshing
59
3.5 Material properties
60
3.6 Boundary conditions
62
3.6.1 Structural domain
62
3.6.2 Fluid domain
62
3.7 FSI numerical solution
68
3.7.1 Solvers coupling
68
3.7.2 Structural solver
69
3.7.3 Fluid solver
70
3.8 CFD simulations
71
3.9 Postprocessing
72
Results
74
4.1 Introduction
75
4.2 Mesh sensitivity
76
4.3 Sensitivity to inlet boundary conditions
79
4.4 Comparison with 4D flow and clinical data
80
4.4.1 Pre-intervention FSI v. 4D flow
81
4.4.2 Post-intervention FSI v. 4D flow
85
4.5 Comparison pre-intervention v. post-intervention
89
iv
4.5.4 Focus on the descending aorta
98
4.6 Conclusions
102
Discussion and conclusions
103
5.1 Discussion
104
5.1.1 Reliability of results
104
5.1.2 Novelty aspects
106
5.1.3 Limitations
108
5.2 Conclusions
109
Appendix
111
Bibliography
113
vi
Introduzione
Le malattie del sistema cardiovascolare (CVDs) rappresentano la principale causa di morte nel mondo occidentale, provocando circa 17.1 milioni di morti ogni anno (31% delle morti nel mondo). Un terzo dei decessi avviene prematuramente in persone al di sotto dei 70 anni. Le CVDs includono una vasta gamma di patologie (disfunzione cardiaca, malattie delle coronarie, febbre reumatica…), tra queste gli aneurismi dell’aorta toracica (TAA) rappresentano una patologia che affligge 1/10000 persone e causa 152000 morti ogni anno nel mondo. Nel 60% dei casi, i TAA riguardano l’aorta ascendente (aTAA), l’attenzione verrà quindi posta su questi ultimi [1,2]. La procedura chirurgica per l’aTAA consiste nella sostituzione del segmento ascendente con un graft. In genere, anche la valvola aortica è compromessa e viene sostituita con una protesi meccanica o biologica suturata al graft, tuttavia nei pazienti che presentano ancora lembi valvolari aortici sani, è possibile una ricostruzione valve-sparing (VSR), cioè “risparmiatrice della valvola”. Il “criterio di dimensione” rappresenta il gold standard per decidere se operare un paziente con chirurgia elettiva: si interviene su aneurismi il cui diametro eccede 5.5 cm. La scelta di intervenire o meno è tuttavia arbitraria e dipende dal medico, statisticamente il 31% dei pazienti con aTAA ha delle complicanze severe prima che l’aneurisma raggiunga la dimensione critica [2]. La chirurgia elettiva è una procedura consolidata con un tasso di insuccesso molto basso (0.2%). A 13 anni il tasso di sopravvivenza è ancora >81%, tuttavia possono verificarsi delle complicazioni, principalmente insufficienza della valvola aortica, formazione di un TAA in aorta discendete ed endocarditi acute che portano a febbre reumatica [3]. L’inserimento un graft altera la fluidodinamica del sangue, specialmente in aorta discendente, dove si osservano velocità e sforzi di taglio (WSS) più elevati [4]. L’alterazione dell’emodinamica rappresenta una causa di innesco del processo aterogenico [5-7], perciò la sua analisi può rappresentare un utile strumento nel follow-up clinico. L’approccio più utilizzato per studiare la fluidodinamica postoperativa è la risonanza magnetica con contrasto di fase (PC-MRI o 4D flow). Il 4D flow è una tecnica che permette di effettuare misurazioni in vivo delle componenti della velocità del sangue nell’aorta del paziente, da cui è possibile derivare streamlines, WSS ed altre grandezze.
vii
evitati, (iii) non cattura aspetti del flusso a scale minori della dimensione del voxel. Il WSS viene calcolato come gradiente spaziale di velocità, perciò la misura da 4D flow può essere inaccurata. I modelli numerici possono andare oltre questi limiti e fornire, non solo misure più accurate di WSS ed indici associati, ma anche un’analisi dell’interazione tra parete arteriosa e sangue. In questo lavoro di tesi verrà utilizzato un modello di interazione fluido-struttura (FSI) per comparare l’emodinamica di un paziente prima e dopo una VSR ed analizzare il ruolo del graft in PET nel comportamento strutturale e fluidodinamico dell’aorta a seguito della chirurgia.
Stato dell’arte
Negli ultimi anni si è sviluppato un interesse crescente per la modellazione FSI. In letteratura si possono trovare vari studi [8-17], che si concentrano su configurazioni fisiologiche o patologiche dell’aorta. Savabi et al. [17] hanno usato un modello FSI per valutare le forze emodinamiche e la risposta strutturale in prossimità dei barorecettori. La geometria è stata ricostruita da MRI e come condizioni al contorno (BCs) è stato applicata una portata fisiologica (inlet) e un profilo di pressione fisiologico (outlet). La parete è stata assunta elastico-lineare. Il WSS e lo sforzo di von Mises sono risultati più elevati in prossimità dei barorecettori (alle biforcazioni dei rami sopraortici); la deformazione circonferenziale è stata misurata e suggerita come criterio per valutare il funzionamento dei barorecettori. Campobasso et al. [8] hanno eseguito una analisi FSI sugli effetti dell’irrigidimento della parte arteriosa. La geometria è stata ricostruita da immagini MRI e come BCs sono stati imposti un profilo di velocità paziente-specifico (inlet), portata paziente specifico (outlet sopraortici) e un modello Windkessel (aorta discendente). La parete è stata assunta elastico-lineare. È stato osservato un incremento dello sforzo in parete all’aumentare della rigidezza della stessa, ed il picco di sforzo è stato suggerito come criterio per valutare il rischio di rottura dell’aneurisma. Mendez et al. [9] hanno confrontato diversi approcci di modellazione (fluidodinamica computazionale (CFD) ed FSI). La geometria è stata ricostruita da immagini angiografiche di tomografia computerizzata, la parete aortica è stata assunta anistropa iperelastica e come BCs sono stati applicati un profilo fisiologico (inlet) e dei modelli Windkessel (outlet). I loro risultati suggeriscono che i risultati della CFD e dell’FSI non presentino differenze significative a causa dell’irrigidimento della parete dell’aTAA.
viii
che non considera l’asimmetria della velocità in ingresso. (ii) È stato provato [18] che le BCs di Windkessel sono la miglior opzione che riproduce fedelmente l’emodinamica in aorta. (iii) La geometria dell’aorta deve essere ricostruita interamente (radice, arco, discendente). (iv) Nessuna analisi è stata condotta sulla condizione post-operativa. Al meglio delle conoscenze dell’autore, non è mai stata effettuata una analisi FSI per confrontare l’emodinamica prima e a seguito della chirurgia elettiva per pazienti con aTAA. Ciò ha definito le basi per il seguente lavoro di tesi.
Materiali e metodi
Lo scopo di questo lavoro è realizzare un modello FSI che consista in due simulazioni numeriche: una per la configurazione pre-intervento, l’altra post-intervento. In parallelo al modello FSI è stato sviluppato un modello CFD, per determinare se è possibile ottenere risultati analoghi, con un modello meno costoso. I risultati delle simulazioni numeriche sono stati comparati con un’analisi 4D flow precedentemente condotta. Il workflow adottato è il seguente:
o Acquisizione MRA e PC-MRI
o Segmentazione: le immagini MRA sono state segmentate per ricostruire la geometria. o Meshing: il dominio fluido e solido sono stati discretizzati in elementi finiti.
o Assegnamento delle proprietà dei materiali: le proprietà del sangue, del tessuto arterioso e del PET sono state reperite in letteratura.
o Condizioni al contorno: il profilo di velocità di ingresso paziente specifico è stato estratto dalla PC-MRI e i parametri di Windkessel sono stati impostati agli outlet.
Simulazione FSI (2 cicli) Simulazione CFD (2 cicli) o Postprocessing
Geometria and mesh
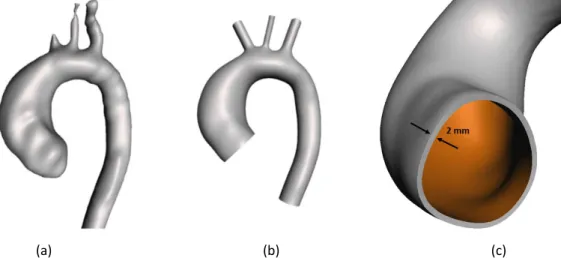
Un’angiografia a risonanza magnetica (MRA) ed un’acquisizione in contrasto di fase (PC-MRI) sono state eseguita prospetticamente su un paziente di 48 anni, prima e dopo l’intervento. Le immagini di MRA sono state segmentate per ricostruire l’STL dell’anatomia, che è stato poi co-registrato alla PC-MRI ed importato in Autodesk Meshmixed. L’STL è stato quindi smussato e
ix
(a) (b) (c)
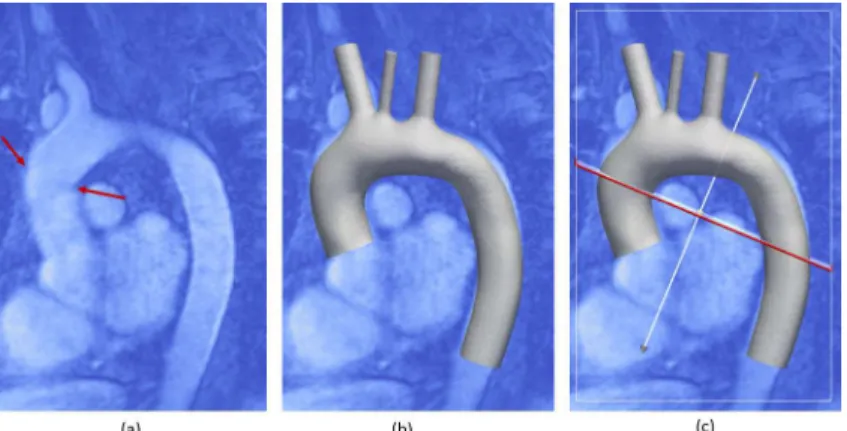
Figura 1. Geometria 3D pre-intervento del dominio fluido, ricostruita dalla segmentazione dell’MRI (a) e corretta in Meshmixer (b). Zoom sull’inlet del domino solido (c).
L’STL dell’anatomia post-intervento è stato sovrapposto alle immagini MRA in ParaView, e tagliato lungo il sito di sutura per generare il graft in PET in aorta ascendente (Figure 2a).
Figura 2. Immagini MRI in cui il sito di sutura è evidenziato con due frecce rosse (a) e geometria STL coregistrata (b). Il piano di taglio è mostrato in (c).
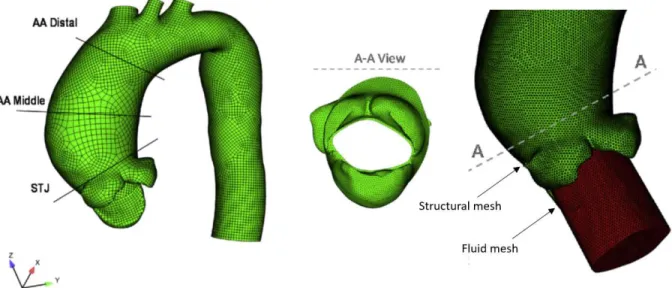
Il dominio fluido e quello solido sono stati discretizzati in ANSYS, dopo un’analisi di sensitività, con ~2.7 milioni e ~500k elementi tetraedrici, rispettivamente (Figura 3). La dimensione caratteristica della mesh è 1 mm e 1.25 mm per la mesh fluida e solida rispettivamente. Per la mesh fluida, è stata utilizzata una mesh dinamica, poiché le pareti si deformano durante la simulazione, ottenuta combinando gli schemi smoothing e remeshing disponibili in ANSYS.
x
Proprietà dei materiali
Tre materiali interagiscono nel modello: il sangue, la parete arteriosa e il graft in PET. Il sangue è
stato modellato come un fluido newtoniano con densità 𝜚 = 1060 kg/m3 [21] e viscosità 𝜇 = 4 cP
[22]. Il flusso è stato assunto laminare [17]. Il tessuto della parete è stato modellato come un materiale isotropo elastico-lineare, con modulo di Young 𝐸 = 1.5 MPa, coefficiente di Poisson 𝜈 = 0.4, e densità 𝜚 = 1120 kg/m3 [23]. Il PET è stato modellato come un materiale isotropo elastico-lineare, con modulo di Young 𝐸 = 11.84 Mpa, coefficiente di Poisson 𝜈 = 0.3 e densità pari a 600 kg/m3 [24].
Condizioni al contorno
Sulla superficie interna del dominio solido è stata imposta un’interfaccia fluido-struttura come condizione di carico; le estremità sono state fissate (spostamento = 0). All’ingresso del dominio fluido è stato assegnato un profilo di velocità paziente specifico ottenuto con un codice MATLAB™ sviluppato dal nostro gruppo. La velocità è stata assegnata attraverso le sue componenti per riprodurre correttamente l’asimmetria e l’inclinazione del profilo entrante (Figura 4). Alle uscite è stato assegnato come BC il modello a tre elementi di Windkessel (WK3), che consiste in una resistenza caratteristica (Z), una compliance (C) ed una resistenza distale (R). C ed R sono in parallelo. I parametri del modello WK3 sono stati calcolati con relazioni da letteratura [14, 25-27] e sono riportati in Tabella I. Sulla parete del vaso è stata applicata la condizione no-slip (velocità nulla a parete).
xi Outlet Z C R Outlet Z C R BCA 5.39 × 10⁷ 2.14 × 10⁻⁹ 7.62 × 10⁸ BCA 3.33 × 10⁷ 3.23 × 10⁻⁹ 5.08 × 10⁸ LCCA 1.35 × 10⁸ 1.00 × 10⁻⁹ 1.61 × 10⁹ LCCA 1.14 × 10⁸ 1.51 × 10⁻⁹ 1.05 × 10⁹ LSA 5.68 × 10⁷ 1.14 × 10⁻⁹ 1.47 × 10⁹ LSA 5.29 × 10⁷ 1.72 × 10⁻⁹ 9.63 × 10⁸ DAO 1.08 × 10⁷ 1.00 × 10⁻⁸ 1.64 × 10⁸ DAO 1.04 × 10⁷ 1.51 × 10⁻⁸ 1.06 × 10⁸
Tabella I. Valori utilizzati per il modello Windkessel (pre-intervento a sinistra, post a destro). I valori sono riportati in unità S.I., Pa∙s/m3 per le resistenze e m3/Pa per le compliance.
Soluzione numerica
L’analisi FSI è stata condotta in ANSYS v.17.2 (ANSYS Inc., Canonsburg, PA, USA), con un time step di 1 ms, accoppiando il solutore strutturale (ANSYS Mechanical) e quello fluido (ANSYS Fluent), con il tool System Coupling, incluso nel pacchetto ANSYS. È stata adottata la descrizione cinematica ALE. Le simulazioni di due cicli cardiaci hanno richiesto una media di 10 giorni, utilizzando 24 CPU.
Il solutore strutturale scelto utilizza lo schema di Newton-Raphson per risolvere l’equazione che governa il problema agli elementi finiti nell’approccio agli spostamenti:
xii
definita tramite uno smorzamento di Rayleigh [28].
Il solutore fluido utilizza l’algoritmo PISO (Pressure-Implicit with Splitting of Operators) per risolvere le equazioni di continuità e di Navier Stokes nella configurazione ALE.
𝜌 𝜕𝐯
𝜕𝑡 + 𝐯 − 𝐯g ⋅ ∇ 𝐯 = −∇𝑝 + 𝜇∇
2𝐯
∇ ⋅ 𝐯 = 0
(2) Dove 𝜌 è la densità del fluido, 𝐯 la velocità, 𝐯g la velocità della mesh, p la pressione e 𝜇 la viscosità dinamica.
Simulazioni CFD
In parallelo alla simulazione FSI è stata eseguita un’analisi CFD con le stesse BCs per confrontare i risultati. Inoltre, è stata condotta una analisi di sensitività delle condizioni al contorno di ingresso sul modello pre-operazione, testando tre diversi profili di ingresso: uno piatto, uno parabolico e uno paziente specifico.
Postprocessing
Il WSS è stato confrontato al picco sistolico (in occorrenza del massimo) tra i modelli pre e post-intervento. Il WSS gioca un ruolo fondamentale nell’innesco del processo aterogenico, specialmente se cambia in modulo e direzione nel tempo [5,6], pertanto è stato calcolato l’OSI (oscillatory shear index). Lo sforzo medio percepito dalla parete arteriosa è invece espresso dal TAWSS (time average WSS). Le velocità sono state visualizzate come streamlines e mappe su dei piani di sezione, per confrontare i risultati delle simulazioni numeriche con il 4D flow. La pressione è stata estratta all’ingresso del modello e confrontata con quella sistolica e diastolica misurata clinicamente. Lo sforzo principale, la deformazione principale e lo spostamento della parete arteriosa sono stati confrontati qualitativamente, con mappe di distribuzione.
Risultati
Sensitività alle condizioni di ingresso
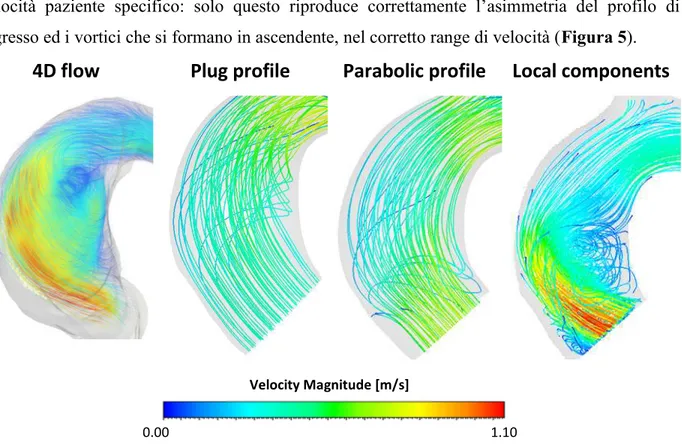
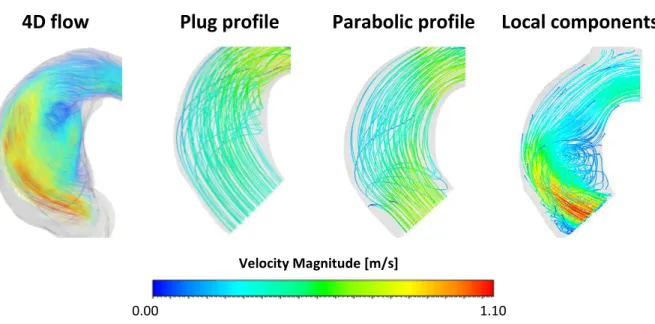
Il confronto delle streamlines in aorta ascendente con mostra un pattern molto diverso nel caso dei profili piatto e parabolico rispetto al 4D flow, mentre c’è un buon accordo nel caso del profilo di
xiii
4D flow
Plug profile
Parabolic profile Local components
Figura 5. Streamlines al picco sistolico ottenute con 4D flow e 3 simulazioni CFD con diverse condizioni di ingresso. Solo la CFD paziente specifico è in grado di riprodurre correttamente il pattern in ascendente.
Sensitività al metodo risolutivo: FSI v. CFD
Il confronto tra le velocità ottenute da 4D flow, FSI e CFD è stato fatto su 6 piani di sezione (3 in ascendente e 3 in discendente) con un’ANOVA. Sia nel caso pre-intervento che post-intervento, non è stata rilevata una differenza statistica (p>0.05) tra le velocità da FSI e da 4D flow, mentre è stata osservata una differenza marcata tra CFD e 4D flow, specialmente in aorta discendente, sia nel modello pre-intervento (in cui la differenza è maggiore) che post-intervento (Figura 6). Le steamlines sono state confrontate al picco sistolico tra FSI e 4D flow. Nel modello pre-operazione è stato osservato un buon accordo tra le due, con una corretta inclinazione e asimmetria del profilo di ingresso e formazione di vortici all’intradosso dell’aorta ascendente. Il pattern di streamlines è concorde anche nel modello post-operazione, che mostra un flusso sostenuto senza ricircoli.
Inoltre, è stato effettuato un confronto qualitativo tra le mappe di velocità sui piani di sezione dell’aorta. In generale si osserva una buona riproduzione del pattern di velocità con velocità più elevate nel modello CFD (Figura 7).
Velocity Magnitude [m/s]
1.10 0.00
xiv
Location 4D flow FSI CFD
Ascending aorta
Descending aorta
Figura 7. Pattern di velocità su due piani di sezione (in ascendente e discendente) per il modello pre-operazione.
Pre-intervento vs. post-intervento
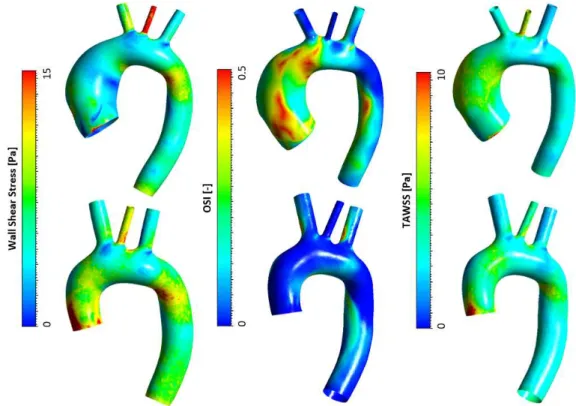
Il WSS sistolico assume un valore massimo in aorta discendente maggiore del 28% nel caso post, rispetto al modello pre-intervento. È stata osservata una distribuzione di OSI con valori più elevati nel modello pre-intervento, con OSI prossimi a 0.5 (soglia critica) in aorta ascendente e all’intradosso della discendente. La distribuzione di TAWSS non rivela differenza significativa (Figura 8). È stato effettuato un t-test delle distribuzioni di WSS, OSI e TAWSS in aorta discendete, trovando WSS significativamente (p<0.001) più elevati ed OSI significativamente
Velocity Magnitude [m/s]
1.10 0.00
xv
Lo sforzo in parete risulta significativamente alterato nel modello post-intervento: lungo il sito di sutura del graft si osserva un’intensificazione degli sforzi con valori di circa 500kPa, causata dal mismatch di compliance tra graft e parete arteriosa.
Figura 8. Distribuzione di WSS, OSI e TAWSS ottenuti dall’analisi FSI. Configurazione pre-intervento (riga superiore) e post-intervento (riga inferiore).
Figura 9. t-test della distribuzione di WSS, OSI e TAWSS ottenuti dall’analisi FSI in discendente. Gli asterischi indicano il p-value: * = p<0.05, ** = p<0.01, *** = p<0.001 and **** = p<0.0001.
Discussione
Con questo lavoro di tesi, si è sviluppato un approccio innovativo per la valutazione dell’emodinamica in pazienti operati con chirurgia VSR per aTAA. È stato utilizzato un modello FSI combinato con la PC-MRI, per una fedele riproduzione della biomeccanica aortica.
xvi
correttamente la biomeccanica dell’aorta, è necessaria un’analisi FSI.
Il confronto tra diverse condizioni di ingresso del flusso ha mostrato che soltanto un profilo paziente specifico riproduce correttamente tutti gli aspetti emodinamici in ascendente.
Il risultato del confronto tra pre e post-intervento è in accordo con precedenti studi condotti con l’analisi 4D flow [4]: le velocità e il WSS aumentano notevolmente in discendente dopo la chirurgia VSR. Alti WSS in discendente rappresentano un fattore di rischio per l’innesco del processo aterogenico e quindi la formazione di un TAA. La distribuzione di OSI presenta valori significativamente più bassi nel modello post-intervento, con valore massimo all’intradosso della discendente. Pertanto, dopo la chirurgia VSR, l’aorta discendente rappresenta la regione di maggiore rischio per la formazione di un TAA. L’intensificazione degli sforzi lungo il sito di sutura è un aspetto significante: il compliance-mismatch dovuto al cambio repentino di rigidezza dei tessuti causa un significativo aumento dello sforzo. Precedenti studi [38] hanno suggerito che il picco di sforzo a parete come parametro per valutare il rischio di accrescimento e rottura dell’aneurisma, pertanto un approfondimento di questo aspetto è auspicabile.
Conclusioni
Il modello FSI sviluppato fornisce un’analisi approfondita della biomeccanica di una aorta patologica e poi ricostruita con operazione VSR. Il modello è in grado di riprodurre le condizioni di lavoro dell’aorta del paziente e permette di analizzare sia aspetti fluidodinamici che strutturali. Il confronto tra approccio FSI e CFD ha dimostrato che una semplice CFD fornisce risultati non attendibili (sovrastimati). Inoltre, si è dimostrato che l’abilità nel riprodurre correttamente la fluidodinamica aortica non dipende soltanto dalle corrette condizioni al contorno di ingresso, ma anche dal tipo di approccio numerico adottato.
Questo lavoro getta le basi per una promettente metodologia per l’ottimizzazione della procedura chirurgica per il trattamento degli aTAA, essendo in grado di prevedere – per uno specifico paziente – le regioni in cui la fluidodinamica risulta alterata e, di conseguenze, il rischio di innesco del processo aterogenico è più elevato. Sviluppi futuri per questo lavoro potrebbero consistere nel riprodurre il workflow proposto su un più ampio gruppo di pazienti ed indagare gli effetti che diversi tipi di graft (e.g. diversa lunghezza, rigidezza…) inducono.
xvii
topics/cardiovascular-diseases/#tab=tab_1.
[2] K. H. Chau and J. A. Elefteriades, “Natural history of thoracic aortic aneurysms: Size matters, plus moving beyond size,” Prog. Cardiovasc. Dis., vol. 56, no. 1, pp. 74–80, 2013, doi: 10.1016/j.pcad.2013.05.007.
[3] R. De Paulis et al., “Long-term results of the valve reimplantation technique using a graft
with sinuses,” J. Thorac. Cardiovasc. Surg., vol. 151, no. 1, pp. 112–119, 2016, doi: 10.1016/j.jtcvs.2015.08.026.
[4] M. Gaudino, C. Lau, M. Munjal, D. Avgerinos, and L. N. Girardi, “Contemporary
outcomes of surgery for aortic root aneurysms: A propensity-matched comparison of valve-sparing and composite valve graft replacement,” J. Thorac. Cardiovasc. Surg., vol. 150, no. 5, pp. 1120-1129.e1, 2015, doi: 10.1016/j.jtcvs.2015.07.015.
[5] J. M. Zhang, L. P. Chua, D. N. Ghista, S. C. M. Yu, and Y. S. Tan, “Numerical investigation
and identification of susceptible sites of atherosclerotic lesion formation in a complete coronary artery bypass model,” Med. Biol. Eng. Comput., vol. 46, no. 7, pp. 689–699, 2008, doi: 10.1007/s11517-008-0320-4.
[6] D. N. Ku, D. P. Giddens, C. K. Zarins, and S. Glagov, “Pulsatile flow and atherosclerosis
in the human carotid bifurcation. Positive correlation between plaque location and low and oscillating shear stress,” Arteriosclerosis, vol. 5, no. 3, pp. 293–302, 1985, doi: 10.1161/01.atv.5.3.293.
[7] H. Meng, V. M. Tutino, J. Xiang, and A. Siddiqui, “High WSS or Low WSS? Complex
interactions of hemodynamics with intracranial aneurysm initiation, growth, and rupture: Toward a unifying hypothesis,” Am. J. Neuroradiol., vol. 35, no. 7, pp. 1254–1262, 2014, doi: 10.3174/ajnr.A3558.
[8] R. Campobasso, F. Condemi, M. Viallon, P. Croisille, S. Campisi, and S. Avril,
“Evaluation of Peak Wall Stress in an Ascending Thoracic Aortic Aneurysm Using FSI Simulations: Effects of Aortic Stiffness and Peripheral Resistance,” Cardiovasc. Eng.
[9] V. Mendez, M. Di Giuseppe, and S. Pasta, “Comparison of hemodynamic and structural
xviii
[10] F. Cuomo, S. Roccabianca, D. Dillon-Murphy, N. Xiao, J. D. Humphrey, and C. A. Figueroa, “Effects of age-associated regional changes in human central artery mechanics on systemic hemodynamics revealed by computational modeling,” PLoS One, vol. 12, no. 3, pp. 1– 21, 2017, doi: 10.7302/Z24B2Z7Z.
[11] T. Khamdaeng and P. Terdtoon, “Regional pulse wave velocity and stress in aneurysmal arch-shaped aorta,” Biomed. Mater. Eng., vol. 29, no. 4, pp. 527–549, 2018, doi: 10.3233/BME-181007.
[12] R. Jayendiran, B. Nour, and A. Ruimi, “Fluid-structure interaction (FSI) analysis of stent-graft for aortic endovascular aneurysm repair (EVAR): Material and structural considerations,” J. Mech. Behav. Biomed. Mater., vol. 87, no. May, pp. 95–110, 2018, doi: 10.1016/j.jmbbm.2018.07.020.
[13] C. J. Drewe, L. P. Parker, L. J. Kelsey, P. E. Norman, J. T. Powell, and B. J. Doyle, “Haemodynamics and stresses in abdominal aortic aneurysms: A fluid-structure interaction study into the effect of proximal neck and iliac bifurcation angle,” J. Biomech., vol. 60, pp. 150–156, 2017, doi: 10.1016/j.jbiomech.2017.06.029.
[14] N. Xiao, J. Alastruei, and C. A. Figueroa, “A systematic comparison between 1-D and 3-D hemodynamicsin compliant arterial models,” Int. Journey Numer. methods Biomed. Eng., 2014. [15] S. Lin, X. Han, Y. Bi, S. Ju, and L. Gu, “Fluid-structure interaction in abdominal aortic aneurysm: Effect of modeling techniques,” Biomed Res. Int., vol. 2017, 2017, doi: 10.1155/2017/7023078.
[16] P. Reymond, P. Crosetto, S. Deparis, A. Quarteroni, and N. Stergiopulos, “Physiological simulation of blood flow in the aorta: Comparison of hemodynamic indices as predicted by 3-D FSI, 3-D rigid wall and 1-D models,” Med. Eng. Phys., vol. 35, no. 6, pp. 784–791, 2013, doi: 10.1016/j.medengphy.2012.08.009.
[17] R. Savabi, M. Nabaei, S. Farajollahi, and N. Fatouraee, “Fluid structure interaction modeling of aortic arch and carotid bifurcation as the location of baroreceptors,” Int. J. Mech. Sci., vol. 165, no. July 2019, 2020, doi: 10.1016/j.ijmecsci.2019.105222.
xix
10.1016/j.jbiomech.2017.06.005.
[19] C.-Y. Liu, D. Chen, D. A. Bluemke, and W. G. Hundley, “Evolution of aortic wall thickness and stiffness with atherosclerosis: Long-term follow up from the Multi-Ethnic Study of Atherosclerosis (MESA),” HHS Public Access, vol. 69, no. 1, pp. 110–120, 2015, doi: 10.1016/j.socscimed.2009.04.010.Are.
[20] W. Karel van den Hengel, “Abdominal aortic wall thickness and compliance The possibilities to measure and the effect of variation in the analysis of aneurysms,” Blood, no. April, 2008.
[21] J. D. Cutnell and K. W. Johnson, Physics (4th Edition, Volume 1). 1997.
[22] L. Dintenfass, Blood Viscosity, Hyperviscosity & Hyperviscosaemia. Springer Science & Business Media, 1985.
[23] T. Khamdaeng, J. Luo, J. Vappou, P. Terdtoon, and E. E. Konofagou, “Arterial stiffness identification of the human carotid artery using the stress – strain relationship in vivo,” Ultrasonics, vol. 52, no. 3, pp. 402–411, 2012, doi: 10.1016/j.ultras.2011.09.006.
[24] G. Tasca et al., “Aortic Root Biomechanics After Sleeve and David Sparing Techniques: A Finite Element Analysis,” Ann. Thorac. Surg., vol. 103, no. 5, pp. 1451–1459, 2017, doi: 10.1016/j.athoracsur.2016.08.003.
[25] J. F. Ladisa et al., “Computational simulations for aortic coarctation: Representative results from a sampling of patients,” J. Biomech. Eng., vol. 133, no. 9, 2011, doi: 10.1115/1.4004996. [26] A. S. Les et al., “Quantification of hemodynamics in abdominal aortic aneurysms during rest and exercise using magnetic resonance imaging and computational fluid dynamics,” Ann. Biomed. Eng., vol. 38, no. 4, pp. 1288–1313, 2010, doi: 10.1007/s10439-010-9949-x.
[27] P. Reymond, F. Merenda, F. Perren, D. Rüfenacht, and N. Stergiopulos, “Validation of a one-dimensional model of the systemic arterial tree,” Am. J. Physiol. - Hear. Circ. Physiol., vol. 297, no. 1, pp. 208–222, 2009, doi: 10.1152/ajpheart.00037.2009.
[28] T. E. Tezduyar, S. Sathe, T. Cragin, B. Nanna, and M. Schwaa, “Modelling of fluid– structure interactions with the space–time finite elements: Arterial fluid mechanics,” Int. J. Numer. Methods Fluids, vol. 54, no. October 2010, pp. 901–922, 2007, doi: 10.1002/fld.
xxi
Introduction
Cardiovascular diseases (CVDs) represent the leading cause of death in the Western World, taking approximatively 17.1 million lives each year (31% of all death worldwide). One third of deaths occur prematurely in people under 70 years of age. CVDs include a wide range of pathologies (heart disorders, coronary disease, rheumatic fever…), among these thoracic aortic aneurysm (TAA) represents a condition affecting ~1/10000 persons that causes 152000 deaths per year worldwide. Since TAAs of the ascending aorta (aTAA), represent 60% of aortic aneurysms, the focus will be shifted on them [1] [2].
Surgical procedure for the treatment of aTAA consists in composite graft replacement of the ascending segment. Generally, the aortic valve is compromised too and gets substituted with a mechanical or biological valve sutured to the graft, however in patients that still have normal aortic valve leaflets, a valve-sparing reconstruction (VSR) is possible. The “dimensional criterion” represent the gold standard to decide whether to operate a patient with elective surgery: patients with aneurysm larger than 5.5 cm must be operated. However, the choice to intervene is arbitrary and depends on the physician and statistically, 31% of patients affected by aTAA suffer from acute complication before the aneurysm reaches its critical size [2].
Elective surgery for the reconstruction of the ascending aorta is a consolidated procedure with very low unsuccess rate (0.2%). At 13 years from the surgery, the survival rate is still >81%, however some complications may occur, mainly including aortic valve insufficiency, descending TAA formation and acute endocarditis that may lead to rheumatic fever [3]. The implantation of a prosthetic graft causes alteration in blood fluid dynamics, especially in the descending aorta, where higher velocities and wall shear stress (WSS) can be observed [4]. Altered hemodynamics represents one of the causes of the atherogenic process starting [5-7], thus, its analysis can be a useful tool in clinical follow up. The most common tool exploited to study postsurgical fluid dynamics in patient treated for aTAA is phase contrast magnetic resonance imaging (PC-MRI, or 4D flow). 4D flow is a technique that permits an in vivo measurement of velocity field in the patient’s aorta, from which streamlines, WSS, etc. can be derived.
xxii
flow at sub-voxel scale. WSS is derived from spatial gradient of velocity, thus 4D flow results may be not accurate. Numerical models can go beyond these limitations and provide not only accurate values of WSS and related indexes, but also a deep insight into the interaction between the arterial wall and blood. In this work of thesis, a fluid-structure interaction (FSI) approach will be exploited to compare the hemodynamics of a patients prior and after VSR, and deepen the role played by the graft in the structural and fluid dynamic behavior of the aorta after the surgery.
State of Art
In the last years, a growing interest developed for FSI aortic modeling. In literature various works can be found [8-17], focusing on the physiologic or pathologic configuration of the aorta. Savabi et al. [17] used an FSI approach to assess the hemodynamic forces and structural response in proximity of baroceptors. They reconstructed the geometry of the aorta from MRI images and applied as boundary conditions physiological flow rate (inlet) and pressure (outlets) waveforms. Wall was assumed linear elastic. Wall shear stresses and Von-Mises stresses were found to be higher in the bifurcations of supra-aortic branches; circumferential stretch was measured and proposed as criterion for baroceptors functioning. Campobasso et al. [8] performed an FSI analysis on the effect of the stiffening of the arterial wall. The geometry of the proximal thoracic aorta was reconstructed from MRI images and the following boundary conditions were set: a patient specific velocity profile (inlet), patient specific flow rates (supra-aortic outlets) and Windkessel model (descending aorta). Arterial wall was assumed linear elastic. They observed an increase in wall stress when the aortic wall became stiffer and thus, proposed the peak wall stress as a risk evaluation parameter for the rupture of the aneurysm. Mendez et al. [9] compared different modeling approaches (computational fluid dynamics (CFD) and FSI). The geometry was reconstructed from electrocardiogram-gated computed tomography angiography, the aortic wall was assumed anisotropic hyperelastic and the following boundary conditions were set: a flow rate from literature (inlet) and Windkessel models (outlets). Their findings suggested that, due to wall stiffening, the results provided by CFD and FSI are not significantly different.
These studies show the potentialities that FSI approach may offer in clinical procedures but presented aspects to be improved: (i) Using a uniform flow rate waveform as inlet boundary
xxiii
to properly replicate the hemodynamics in the aorta. (iii) The aorta must be reconstructed entirely (root, arch, descending). (iv) No study has been carried on the postsurgical configuration. To the best of author’s knowledge, no FSI analysis has been conducted to compare the hemodynamics before and after elective surgery for aTAA patients. This set the basis for the current thesis work.
Material and Methods
This work of thesis aims to develop an FSI model consisting in two numerical simulations: one reproducing the presurgical condition, the other reproducing the postsurgical. In parallel with the FSI model, a CFD model was developed, to determine whether is possible or not to obtain similar results with a less expensive model. Results from numerical simulations were compared with 4D flow analysis. The workflow that was adopted is the following:
o MRA and PC-MRI acquisition.
o Segmentation: MRA images were segmented to reconstruct the geometry. o Meshing: the solid and fluid domain were discretized in finite elements.
o Material properties assignment: properties of blood, arterial tissue and PET were found in literature.
o Boundary conditions: patient specific inlet velocity was extracted from PC-MRI and Windkessel parameters were tuned for the outlets.
FSI simulations (2 cycle) CFD simulations (2 cycle) o Postprocessing
Geometry and meshing
Magnetic resonance angiography (MRA) and phase contrast acquisition (PC-MRI) were prospectively performed, on a 48-years-old male patient, pre and post-operatively. Segmentation was performed on MRA images to reconstruct the STL of the anatomy, that was co-registered to PC-MRI and imported in Autodesk Meshmixer. The STL was smoothed and cut to generate flow inlet and outlets. The wall was extruded in normal direction by 2 mm [19-20], to generate the solid domain (i.e. aortic wall). Figure 1 illustrates the resulting geometry.
xxiv
adjusted in Meshmixer (b). Zoom-in of the inlet of the solid domain (c).
The postsurgical STL was overlapped to MRA images in ParaView, to cut it along the suture site and generate the PET graft in the ascending segment (Figure 2a).
Figure 2. Figure shows MRI images where suture site is highlighted by the red arrows (a) and the STL geometry co-registered (b). The slicing plane is showed in (c).
The solid and fluid domain were discretized in ANSYS – after a sensitivity analysis – with ~2.7 million and ~500k tetrahedral elements respectively (Figure 3). The average size of the elements is 1 mm for the fluid mesh and 1.25 mm for the structural mesh. Dynamic meshing was exploited for the fluid mesh, since the wall deforms throughout the simulation. A combination of the smoothing (spring constant = 0.1) and remeshing (maximum cell skewness =0.85, face skewness = 0.8, length scale = 0.5–1.5 mm) scheme was adopted.
xxv
Material properties
Three materials interact in the model: blood (that was treated as a fluid), arterial wall tissue and
PET graft. Blood was modeled as a Newtonian fluid with a density 𝜚 = 1060 kg/m3 [21] and a
viscosity equal to 𝜇 = 4 cP [22]. Flow was assumed to be laminar [17]. Arterial wall tissue was modeled as an isotropic linear elastic material, with a Young’s modulus 𝐸 = 1.5 MPa, a Poisson ratio 𝜈 = 0.4, a density 𝜚 = 1120 kg/m3 [23]. PET was modeled as an isotropic linear elastic
material, with a Young’s modulus 𝐸 = 11.84 MPa and a Poisson ratio 𝜈 = 0.3 and density equal to 600 kg/m3 [24].
Boundary conditions
At the inner surface of the solid domain, a fluid-solid interface was applied as load condition; at each extremity, no displacement was allowed. At the inlet of the fluid domain, a patient specific velocity profile – obtained through an in-house MATLAB™ code – was assigned. Velocity was set through its components to reliably reproduce the skewness of the profile and its inflow angle (Figure 4). The three-elements Windkessel (WK3) model – consisting in a proximal (or characteristic) resistance 𝑍, a capacitor 𝐶 and a distal resistance 𝑅 (𝐶 and 𝑅 are in parallel) – was set as boundary condition at each outlet. The WK3 parameters were evaluated through equations from literature [14,25-27] and are summarized in Table I. On the wall of the fluid domain, the no-slip boundary condition was applied.
xxvi Outlet Z C R Outlet Z C R BCA 5.39 × 10⁷ 2.14 × 10⁻⁹ 7.62 × 10⁸ BCA 3.33 × 10⁷ 3.23 × 10⁻⁹ 5.08 × 10⁸ LCCA 1.35 × 10⁸ 1.00 × 10⁻⁹ 1.61 × 10⁹ LCCA 1.14 × 10⁸ 1.51 × 10⁻⁹ 1.05 × 10⁹ LSA 5.68 × 10⁷ 1.14 × 10⁻⁹ 1.47 × 10⁹ LSA 5.29 × 10⁷ 1.72 × 10⁻⁹ 9.63 × 10⁸ DAO 1.08 × 10⁷ 1.00 × 10⁻⁸ 1.64 × 10⁸ DAO 1.04 × 10⁷ 1.51 × 10⁻⁸ 1.06 × 10⁸
Table I. Used values of the 𝑅𝐶𝑅 Windkessel model for the pre (left) and post-operation (right) model. 𝒁 = proximal resistance, 𝑪 = compliance, 𝑹 = peripheral resistance. Values are given in S.I. units, Pa∙s/m3 for resistances and m3/Pa for compliances.
Numerical solution
FSI analysis was run in ANSYS v.17.2 (ANSYS Inc., Canonsburg, PA, USA) with a time step Δ𝑡 = 0.001 s, coupling the structural solver – ANSYS Mechanical – and the fluid solver – ANSYS Fluent – using the embedded System Coupling module. ALE kinematic description was exploited. Simulations of two cardiac cycle took an average of 10 days running on 24 cores on a cluster server.
The structural solver solved the governing equation (Equation 1) of the finite element problem in the displacement-based approach using Newton-Raphson scheme.
xxvii
was defined through a Rayleigh damping [28].
The fluid solver used the Pressure-Implicit with Splitting of Operators (PISO) algorithm to solve the Navier-Stokes and continuity equations (Equation 2) in the ALE configuration.
𝜌 𝜕𝐯
𝜕𝑡 + 𝐯 − 𝐯g ⋅ ∇ 𝐯 = −∇𝑝 + 𝜇∇
2𝐯
∇ ⋅ 𝐯 = 0
(2) Where 𝜌 is the fluid density, 𝐯 the velocity, 𝐯g the velocity of the mesh, p the pressure and 𝜇 the dynamic viscosity.
CFD simulations
In parallel with FSI, a CFD simulation with the same boundary conditions was performed to compare results. Furthermore, a sensitivity analysis of the inlet boundary conditions was performed for the presurgical model, testing three different inflow: a flat velocity profile, a parabolic velocity profile and the patient specific velocity profile.
Postprocessing
WSS were compared between the pre and post-intention model at systolic peak, when they reach their maximum. WSS plays a fundamental role in the triggering of the atherogenic process, especially when changes in direction and modulus [5,6]. Thus, the oscillatory shear index (OSI) was computed. The average shear stress experienced by the wall tissue was expressed through the time average wall shear stress (TAWSS). Velocities were visualized as streamlines and contours on section planes, to compare results from numerical simulations and 4D flow analysis. Pressure was exported at the inlet and compared with clinically measured systolic and diastolic pressures. The maximum principal stress, the maximum principal strain and displacement distribution of the wall were qualitatively compared with contour plots.
Results
Sensitivity to inlet boundary condition.
The comparison of the streamlines in the ascending aorta showed a very different patter with the flat and parabolic profile, while a good agreement was observed with the patient specific velocity
xxviii
4D flow
Plug profile
Parabolic profile Local components
Figure 5. Streamlines at systolic peak obtained with 4D flow and 3 simulations with different boundary condition. Only the local velocity components profile was able to properly capture the hemodynamic in the ascending aorta.
Sensitivity to solution method: FSI v. CFD
The comparison between 4D flow, FSI and CFD velocity population was performed on six cross sectional planes (3 in ascending aorta, 3 in descending aorta) with an ANOVA. Both for the presurgical and postsurgical model, no significant difference was obtained (p>0.05) between FSI and 4D flow velocities, while a marked difference was observed in the descending aorta between CFD and 4D flow, both in the pre and postsurgical model. Difference was more marked in the pre-intervention configuration (Figure 6).
Streamlines were compared at systolic peak between the two FSI models and 4D flow analysis. A good agreement was found in the presurgical case, with correct inflow skewness and angle and vortical structures formation in the intrados of the ascending aorta. Streamlines pattern matched in the postsurgical case too, which showed a sustained flow with no recirculation.
Furthermore, a qualitative comparison was achieved between the velocity contours on cross sectional planes of the aorta. A good agreement of the contour pattern was generally observed, with significantly higher velocity in the CFD model (Figure 7).
Velocity Magnitude [m/s]
1.10 0.00
xxix
Location 4D flow FSI CFD
Ascending aorta
Descending aorta
Figure 7. Velocity pattern on cross sectional plane in ascending and descending aorta for presurgical model.
Pre-intervention v. post-intervention
Systolic peak WSS reached a maximum value in descending aorta, in post-intervention model, greater by 28% than in pre-intervention model. OSI distribution assumed higher values in the presurgical model, with OSI close to 0.5 (critical threshold) in the ascending aorta and in the intrados of descending aorta. No significant difference was observed in TAWSS distribution (Figure 8). An t-test of WSS, OSI and TAWSS distribution in the descending aorta was performed.
Velocity Magnitude [m/s]
1.10 0.00
xxx
The intramural stress was significantly altered in the postsurgical model: an intensification of stresses with values of ~500kPa was observed along the suture site, due to the compliance mismatch.
Figure 8. WSS, OSI and TAWSS distributions obtained from FSI analysis. Presurgical (top row) and postsurgical (bottom row) configurations.
Figure 9. Results of t-test of WSS, OSI and TAWSS in the descending aorta obtained from FSI analysis. Asterisks indicate the p-value: * = p<0.05, ** = p<0.01, *** = p<0.001 and **** = p<0.0001.
Discussion
With this thesis work an innovative approach for the assessment of the hemodynamics in patients operated for aTAA with VSR technique was developed. FSI modeling combined with PC-MRI boundary conditions, was exploited for a reliable reproduction of patient’s aortic biomechanics.
xxxi
replicate the aortic biomechanics.
The comparison of different inlet boundary conditions revealed that only the patient specific profile was able to properly capture the hemodynamics in the ascending aorta.
The comparison between the pre and postsurgical configurations showed results in agreement with previous studies [4] performed with 4D flow analysis: velocities and WSS significantly increase in the descending aorta after valve sparing surgery. High WSS in the descending tract represent a risk factor for the atherogenic process triggering, and consequently the formation of a TAA in descending aorta. The OSI distribution was characterized by significantly lower values in the postsurgical case, that assumed maximum value in the descending aorta intrados. Thus, after VSR surgery, descending aorta represent a risky region for TAA development.
The intensification of stress along the suture site is a significant aspect to be considered. The compliance mismatch due to the sharp change in stiffness between graft and native wall caused and significant increase in wall stress. Previous studies [8] suggested peak wall stress as a parameter to evaluate the aneurysm growing, thus an insight of this aspect would be recommended.
Conclusion
The developed FSI model provided a comprehensive insight into the biomechanics of a pathologic and a VSR treated aorta. The model was able to reproduce the operative condition of the vessel and permitted to investigate both fluid dynamics and structural aspects. The comparison between FSI and CFD approach demonstrated that, a simpler CFD provides unreliable results. Furthermore, we demonstrated that the ability to reproduce properly the aortic fluid dynamics doesn’t depend on the boundary conditions only, but also on the type of modeling approach that is adopted. The current work set the basis to a promising methodology for the optimization of surgical procedure for the treatment of aTAAs, since it is able to predict – for a specific patient – regions where the fluid dynamics results altered and consequently the atherogenic process will most likely take place. A further development for this study may consist in reproduce this modeling on a wider pool of patients and investigate the effect that different graft (e.g. different length, stiffness…) induce.
xxxii
topics/cardiovascular-diseases/#tab=tab_1.
[2] K. H. Chau and J. A. Elefteriades, “Natural history of thoracic aortic aneurysms: Size matters, plus moving beyond size,” Prog. Cardiovasc. Dis., vol. 56, no. 1, pp. 74–80, 2013, doi: 10.1016/j.pcad.2013.05.007.
[3] R. De Paulis et al., “Long-term results of the valve reimplantation technique using a graft
with sinuses,” J. Thorac. Cardiovasc. Surg., vol. 151, no. 1, pp. 112–119, 2016, doi: 10.1016/j.jtcvs.2015.08.026.
[4] M. Gaudino, C. Lau, M. Munjal, D. Avgerinos, and L. N. Girardi, “Contemporary
outcomes of surgery for aortic root aneurysms: A propensity-matched comparison of valve-sparing and composite valve graft replacement,” J. Thorac. Cardiovasc. Surg., vol. 150, no. 5, pp. 1120-1129.e1, 2015, doi: 10.1016/j.jtcvs.2015.07.015.
[5] J. M. Zhang, L. P. Chua, D. N. Ghista, S. C. M. Yu, and Y. S. Tan, “Numerical investigation
and identification of susceptible sites of atherosclerotic lesion formation in a complete coronary artery bypass model,” Med. Biol. Eng. Comput., vol. 46, no. 7, pp. 689–699, 2008, doi: 10.1007/s11517-008-0320-4.
[6] D. N. Ku, D. P. Giddens, C. K. Zarins, and S. Glagov, “Pulsatile flow and atherosclerosis
in the human carotid bifurcation. Positive correlation between plaque location and low and oscillating shear stress,” Arteriosclerosis, vol. 5, no. 3, pp. 293–302, 1985, doi: 10.1161/01.atv.5.3.293.
[7] H. Meng, V. M. Tutino, J. Xiang, and A. Siddiqui, “High WSS or Low WSS? Complex
interactions of hemodynamics with intracranial aneurysm initiation, growth, and rupture: Toward a unifying hypothesis,” Am. J. Neuroradiol., vol. 35, no. 7, pp. 1254–1262, 2014, doi: 10.3174/ajnr.A3558.
[8] R. Campobasso, F. Condemi, M. Viallon, P. Croisille, S. Campisi, and S. Avril,
“Evaluation of Peak Wall Stress in an Ascending Thoracic Aortic Aneurysm Using FSI Simulations: Effects of Aortic Stiffness and Peripheral Resistance,” Cardiovasc. Eng.
[9] V. Mendez, M. Di Giuseppe, and S. Pasta, “Comparison of hemodynamic and structural
xxxiii
[10] F. Cuomo, S. Roccabianca, D. Dillon-Murphy, N. Xiao, J. D. Humphrey, and C. A. Figueroa, “Effects of age-associated regional changes in human central artery mechanics on systemic hemodynamics revealed by computational modeling,” PLoS One, vol. 12, no. 3, pp. 1– 21, 2017, doi: 10.7302/Z24B2Z7Z.
[11] T. Khamdaeng and P. Terdtoon, “Regional pulse wave velocity and stress in aneurysmal arch-shaped aorta,” Biomed. Mater. Eng., vol. 29, no. 4, pp. 527–549, 2018, doi: 10.3233/BME-181007.
[12] R. Jayendiran, B. Nour, and A. Ruimi, “Fluid-structure interaction (FSI) analysis of stent-graft for aortic endovascular aneurysm repair (EVAR): Material and structural considerations,” J. Mech. Behav. Biomed. Mater., vol. 87, no. May, pp. 95–110, 2018, doi: 10.1016/j.jmbbm.2018.07.020.
[13] C. J. Drewe, L. P. Parker, L. J. Kelsey, P. E. Norman, J. T. Powell, and B. J. Doyle, “Haemodynamics and stresses in abdominal aortic aneurysms: A fluid-structure interaction study into the effect of proximal neck and iliac bifurcation angle,” J. Biomech., vol. 60, pp. 150–156, 2017, doi: 10.1016/j.jbiomech.2017.06.029.
[14] N. Xiao, J. Alastruei, and C. A. Figueroa, “A systematic comparison between 1-D and 3-D hemodynamicsin compliant arterial models,” Int. Journey Numer. methods Biomed. Eng., 2014. [15] S. Lin, X. Han, Y. Bi, S. Ju, and L. Gu, “Fluid-structure interaction in abdominal aortic aneurysm: Effect of modeling techniques,” Biomed Res. Int., vol. 2017, 2017, doi: 10.1155/2017/7023078.
[16] P. Reymond, P. Crosetto, S. Deparis, A. Quarteroni, and N. Stergiopulos, “Physiological simulation of blood flow in the aorta: Comparison of hemodynamic indices as predicted by 3-D FSI, 3-D rigid wall and 1-D models,” Med. Eng. Phys., vol. 35, no. 6, pp. 784–791, 2013, doi: 10.1016/j.medengphy.2012.08.009.
[17] R. Savabi, M. Nabaei, S. Farajollahi, and N. Fatouraee, “Fluid structure interaction modeling of aortic arch and carotid bifurcation as the location of baroreceptors,” Int. J. Mech. Sci., vol. 165, no. July 2019, 2020, doi: 10.1016/j.ijmecsci.2019.105222.
xxxiv
10.1016/j.jbiomech.2017.06.005.
[19] C.-Y. Liu, D. Chen, D. A. Bluemke, and W. G. Hundley, “Evolution of aortic wall thickness and stiffness with atherosclerosis: Long-term follow up from the Multi-Ethnic Study of Atherosclerosis (MESA),” HHS Public Access, vol. 69, no. 1, pp. 110–120, 2015, doi: 10.1016/j.socscimed.2009.04.010.Are.
[20] W. Karel van den Hengel, “Abdominal aortic wall thickness and compliance The possibilities to measure and the effect of variation in the analysis of aneurysms,” Blood, no. April, 2008.
[21] J. D. Cutnell and K. W. Johnson, Physics (4th Edition, Volume 1). 1997.
[22] L. Dintenfass, Blood Viscosity, Hyperviscosity & Hyperviscosaemia. Springer Science & Business Media, 1985.
[23] T. Khamdaeng, J. Luo, J. Vappou, P. Terdtoon, and E. E. Konofagou, “Arterial stiffness identification of the human carotid artery using the stress – strain relationship in vivo,” Ultrasonics, vol. 52, no. 3, pp. 402–411, 2012, doi: 10.1016/j.ultras.2011.09.006.
[24] G. Tasca et al., “Aortic Root Biomechanics After Sleeve and David Sparing Techniques: A Finite Element Analysis,” Ann. Thorac. Surg., vol. 103, no. 5, pp. 1451–1459, 2017, doi: 10.1016/j.athoracsur.2016.08.003.
[25] J. F. Ladisa et al., “Computational simulations for aortic coarctation: Representative results from a sampling of patients,” J. Biomech. Eng., vol. 133, no. 9, 2011, doi: 10.1115/1.4004996. [26] A. S. Les et al., “Quantification of hemodynamics in abdominal aortic aneurysms during rest and exercise using magnetic resonance imaging and computational fluid dynamics,” Ann. Biomed. Eng., vol. 38, no. 4, pp. 1288–1313, 2010, doi: 10.1007/s10439-010-9949-x.
[27] P. Reymond, F. Merenda, F. Perren, D. Rüfenacht, and N. Stergiopulos, “Validation of a one-dimensional model of the systemic arterial tree,” Am. J. Physiol. - Hear. Circ. Physiol., vol. 297, no. 1, pp. 208–222, 2009, doi: 10.1152/ajpheart.00037.2009.
[28] T. E. Tezduyar, S. Sathe, T. Cragin, B. Nanna, and M. Schwaa, “Modelling of fluid– structure interactions with the space–time finite elements: Arterial fluid mechanics,” Int. J. Numer. Methods Fluids, vol. 54, no. October 2010, pp. 901–922, 2007, doi: 10.1002/fld.
1
Chapter 1
Introduction
Chapter summary
In this chapter an overview on the anatomy, physiology and pathologies of the aorta will be given. Attention will focus on aneurysm of the ascending thoracic aorta (aTAA), and the surgical procedures performed for the reconstruction of the aortic root. In the last section, an insight into phase contrast magnetic resonance imaging (PC-MRI) and its potentialities and limitations for the measurement of hemodynamic quantities will be provided.
2
1.1 Anatomy and physiology
Cardiovascular system is an organs system that carries oxygen, nutrients and hormones within human body, as well as waste products (e.g. carbon dioxide) that get removed later. It is composed by three main elements: the heart, blood and the vessels [1]. A brief description of these components is provided below.
1.1.1 The heart
The heart consists of four chambers: two atria and two ventricles, separated by the interventricular septum (Figure 1.1). Atria receive blood from the body – the right one from systemic circulation through vena cava, the left one from pulmonary circulation through pulmonary vein – while ventricles pump blood towards the body – the right one to lungs through pulmonary artery, the left one to systemic circulation through the aorta – in order to guarantee flow unidirectionality. Atria and ventricles are separated by the tricuspid and mitral valve, pulmonary and aortic valve separate the ventricles from pulmonary artery and aorta respectively. Valves open and close passively due pressure difference upstream and downstream the valve itself. This four valves system permits to maintain a one-way flow of blood in the heart [1].
Figure 1.1. Anterior view of the heart showing the four chambers, the major vessels and their early branches, as well as the four valves [2].
3
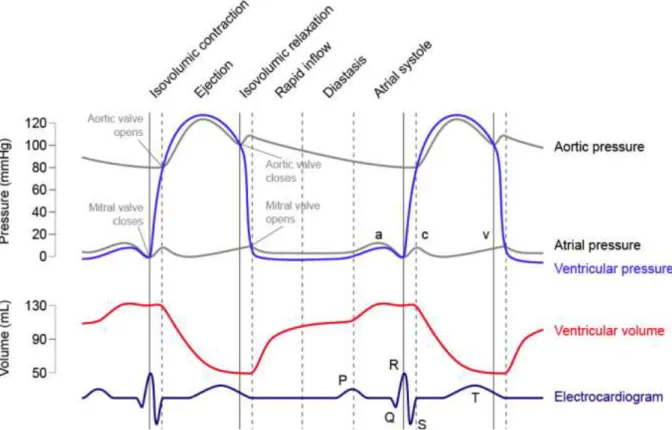
Heart serves as a pulsatile pump for blood, in a lifespan it can push into circulation up to 200 million liter [3]. A cardiac cycle (Figure 1.2) is divided in two phases: systole and diastole. Systole is generally identified as the time interval between the mitral valve closure instant and the end of ejection, diastole is the retainer [1]. One cycle consists in the following sequence of events:
o Ventricular filling: after the tricuspid and mitral valve open at the beginning of diastole the ventricles start to fill. The process is enhanced by the elastic recoil from systolic configuration.
o Atrial systole: once the ventricles are filled, the atria contract causing a reverse pressure gradient across the mitral and tricuspid valve, that close.
o Blood ejection: an electric stimulus initiates the ventricular contraction, that causes a sharp increase in blood pressure. When pressure exceeds the afterload, the pulmonary and aortic valve open and the cardiac output is ejected. When the ejected blood starts to decelerate, pressure decreases leading to the closure of the pulmonary and aortic valve.
Figure 1.2. From the top: pressure waveforms of the left atrium and ventricle (mmHg); variation of the left ventricle volume (mL); electrocardiogram (ECG).
4
1.1.2 The blood
Bloodis one of human body connective tissue. It consists of specialized cells that reside in a
liquid extracellular matrix, the plasma. The corpuscular part of blood is called hematocrit and it’s a suspension of mainly red blood cells (RBCs), white blood cells (WBCs) and platelets (~45% of blood volume). The plasma is a liquid (~55% of blood volume) that consist of water, metabolites and ions. RBCs are made up of a compound called hemoglobin, a protein that binds to oxygen and carry it through the body, WBCs protect body against infection and platelets are involved in the clotting process (i.e. blood coagulation) [4].
1.1.3 The vessels
Blood flows through human body within blood vessels. The circulation(Figure 1.3) is divided
in two sub-system: the pulmonary and the systemic circulation. Pulmonary circulation carries blood through lungs and toward the left atrium, systemic circulation carries blood through the rest of organs and towards the right atrium.
Figure 1.3. Pulmonary circuit moves blood from the right heart to the lungs and back to the left heart. Systemic circuit moves blood from the left heart through the whole body and back to the right heart. Arrows indicates the directionality of the flow [2].
5
Figure 1.4. Anatomy of the thoracic and proximal abdominal aorta [2].
Vessels are classified in arteries, which carry oxygenated blood, capillaries, very small arterial branches where mass exchange process between organs and blood actually takes place, and veins, that carry deoxygenated blood back to the right atrium [1].
The aorta (Figure 1.4) is the main artery of the systemic circulation and the largest artery of the whole circulatory system. It originates from the left ventricle outflow tract (LVOT) and consists of different sectors: the aortic root (or sinuses of Valsava), the ascending thoracic aorta, the aortic arch – from which arteries perfusing the upper-body arise – the descending thoracic aorta and the abdominal tract, from which the celiac truck arises and perfuses visceral organs. The aorta ends with the aorto-iliac junction at the level of the lumbar vertebra L4, where it splits into the two iliac arteries, that perfuse legs. Aortic inner diameter reduces from the root to the iliac junction, with an average value of 25 mm [1] [5].
All of the arteries that form the systemic circulation arise from the aorta or from one of the aortic branches. The first main branches are the two coronary arteries, these originate from the sinuses of Valsalva and perfuses the heart during the diastolic phase.
6
From the aortic arch three branches arise (Figure 1.4) that perfuse the upper part of the body: o Brachiocephalic trunk (BCA), that gives rise in turn to the right subclavian (RSA) and
right common carotid artery (RCCA). Those perfuse the right arm and the right part of the neck respectively.
o Left common carotid artery (LCCA), that perfuses the left part of the neck. o Left subclavian artery (LSA), that perfuses the left arm.
Variations in the aortic arch and its branches are not rare. Rarely, the left common carotid artery may originate from the right-sided brachiocephalic artery rather than the aortic arch. In other individuals, the left common carotid and the brachiocephalic artery may have a common origin. In even rare cases, the brachiocephalic artery may give rise to all 3 branches [6].
1.2 Histology of blood vessels
Arteries are elastic multilayer structures with compliant features. The microstructure of the arterial wall varies with the location along the vascular tree and consequently their compliant capability, but regardless of its location, all arteries consist of three layers: tunica intima, tunica media and tunica adventitia (Figure 1.5) [1].
Figure 1.5. Schematic representation of the layer structure of the aortic wall (a) and histology (b) showing the relative difference in thickness in a healthy subject [2].
The intima consists of a monolayer of endothelial cells (ECs) and basal lamina of type IV collagen (as all the arteries) with an additional layer of connective tissue and smooth muscle
7
cells (SMCs). The tunica intima provides structural support to the arterial wall and is separated from media by an elastic lamina. The media contains SMCs embedded in an extracellular matrix of elastin and collagen (type I, III and V) and proteoglycans. The collagen fiber orientation of the medial constituents is such that they promote vessel contraction. In the aorta, SMCs are organized in 40 to 70 concentric layers, separated by a thin fenestrated sheet of elastin, those form a structural and functional unit called musculo-elastic fascicle. The number of layers increases with the diameter of the aorta, making the arterial wall thicker for larger diameters, a general rule is that the thickness increases of 0.05 mm for every 1 mm increase in the diameter. The adventitia is a dense network of type I collagen fibers, that contains nerves, fibroblasts and vasa vasorum. It comprises only 10% of the arterial wall in elastic arteries and primarily serves as a protective sheath, in many vessels the adventitia is contiguous with perivascular tissue, which provides additional structural support [1].
1.3 Physiology of the aorta
The aorta plays a crucial role in blood circulation, as systemic circulation starts form it. Through vasomotion, that is the spontaneous contraction of the arterial wall, the aorta provides support to the pumping action of the heart and increase blood flow rate towards the body. Being the most proximal artery to the heart, it also acts as a compliance that dampens the pulsatile flow, received from the heart, in nearly steady flow in peripheral vessels. The elasticity of the wall allows the vessel to expand and accommodate a fraction of the stroke volume (SV), working as a reservoir. During systole, the reservoir expands and receive blood, during diastole it discharges blood through the systemic circulation, thanks to the elastic recoil. This mechanic action causes the smoothing of the flow rate waveform that combined to the effect due to progressive stiffening of the arterial wall in peripheral vessels, makes the flow almost steady [7].
In the wall of the aortic arch baroreceptors are located, when the aortic wall is stretched, receptors produce a signal, that is sent through the vagus nerve to the nucleus of the solitary tract in the brainstem. This latter can activate and inactivate the sympathetic and parasympathetic system, helping to prevent rapid variations in blood pressure. This mechanism helps to accomplish blood pressure homeostasis [6].
8
Another role that the aorta accomplishes is monitoring blood composition. Peripheral chemoreceptors control the partial pressure of carbon monoxide and oxygen in blood. When their amount changes, a signal is sent via the vagus nerve to the dorsal respiratory group, which responds regulating breathing [6].
1.4 Pathologies of the aorta
Cardiovascular diseases (CVDs) represent the leading cause of death in the Western World, taking approximately 17.1 million lives each year (31% of all deaths worldwide). One third of deaths occur prematurely in people under 70 years of age [8] [9]. CVDs include heart disorders, coronary heart disease, rheumatic fever, blood vessels disorders and other conditions [8]. Main pathologies that involve the aorta are herein described.
1.4.1 Aortic coarctation (CoA)
Aortic coarctation is a congenital disease with an incidence of 4/10000 live births [10] that causes the focal narrowing of the aortic segment (Figure 1.6), generally near the ligamentum arteriosum. The ligamentum arteriosum is a small ligament that is remnant of the ductus Botalli, a vessel that connects the aorta and the pulmonary vein in the fetus and that close at birth. When the ductus fails to close at birth, it results in a condition called patent ductus arteriosum (PDA), that increase the risk to develop a CoA. Generally, the stenotic area is focused at the level of the aortic isthmus (the connection point between the arch and the descending aorta), but its extent may involve part of the arch as well. CoA is generally diagnosticated in infancy, when untreated main complications involve hypertension and aortic dissection [11].
Figure 1.6. Healthy aorta on the left and coarcted aorta on the right. Stenotic area is generally located in the descending tract.
9
1.4.2 Aortic dissection (AD)
Aortic dissections occur generally after the lesion of the innermost layer of the aorta, the tunica intima, that causes its separation from the other two layers. This separation allows blood to flow into the media layer creating a false lumen (Figure 1.7). The main risk associated to AD is the rupture of the aorta, due to the pressurized false lumen compressing the true lumen [5]. AD is a relatively rare event, that occurs in 3/100000 patients per year [12].
Figure 1.7. Stanford and DeBakey classification of aortic dissection. Aortic dissection is classified based on the anatomy of the problem: type A involves the whole aorta, starting from the ascending tract, type B begins beyond the left subclavian artery.
1.4.3 Atherosclerosis
Atherosclerosis is due to a focal accumulation of lipids, calcium and necrotic debris within the intimal layer. This causes a narrowing of the lumen (i.e. stenosis), that compromise blood flow. The main complications is the rupture of the plaque, which can coagulate, causing the complete occlusion of the vessel and leading to myocardial infarction or stroke [1]. Other disorders associated with aortic atherosclerosis are coronary artery disease, carotid artery disease and aneurysms. Atherosclerosis of the aorta is a relatively common disorder, affecting ~7% of population, but it is most of the time asymptomatic. Only in less than 1% of cases it leads to other complication in the patient [13].
Aortic atherosclerotic is strictly related with thoracic aortic aneurysm: severe aortic plaque (thicker than 5 mm) is found in ~52% of patients with aneurysm.
10
1.4.4 Thoracic aortic aneurysm (TAA)
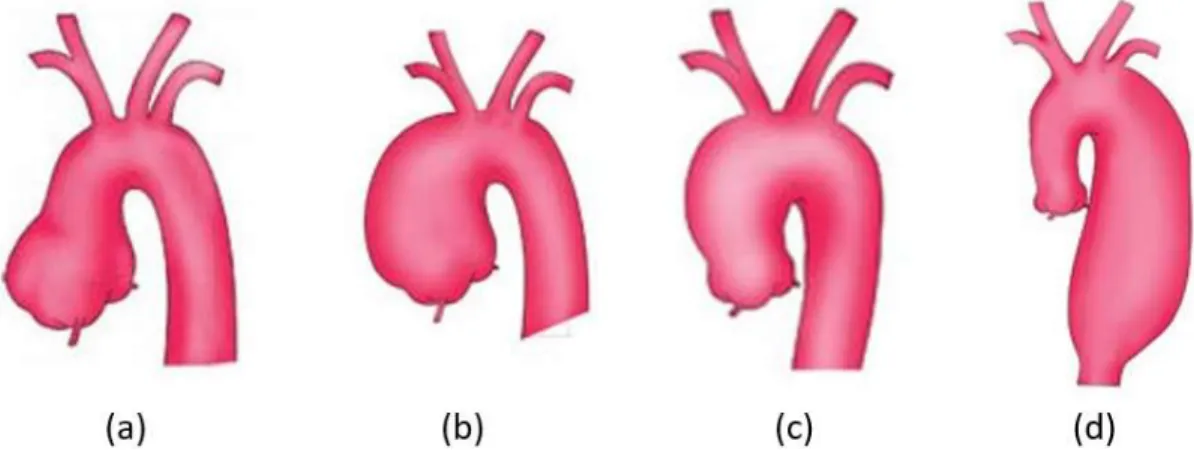
Thoracic aortic aneurysm (TAA) is a focal dilatation of the vessel, caused by a local weakening of the arterial wall. The vessel grows silently in most cases and can end up into a rupture of the wall, with catastrophic consequence for the subject [1]. Depending on their location along the aortic lumen, TAAs are classified in aortic root aneurysm, ascending aorta aneurysm (aTAA), aortic arch aneurysm and descending aortic aneurysm (dTAA) as Figure 1.8 shows. In the United States of America (that is a good world-representative sample) TAAs have an incidence of ~1/10000 persons [9]. Mortality is remarkable, indeed TAA results in approximatively 152000 deaths per year worldwide [14].
Figure 1.8. Classification of thoracic aortic aneurysm. From left to right: aortic root aneurysm (a), ascending aorta aneurysm (b), aortic arch aneurysm (c) and descending aorta aneurysm (d).
TAA is a lethal disease that in 95% of cases its diameter grows asymptomatically, with a rate of 1 mm per year, until the occurrence of an acute event [9]. According to clinical practice, the size of an aneurysm is the most important parameter to be considered in the follow up of the patient, since it has been showed that the risk of natural complications increases as the TAA gets larger. Hence, patients are chosen for elective surgery, basing on the size of the aneurysm [9].
In most cases the developing of an aTAA is due to cystic medial degeneration (MD), which consist in the loss and disorganization of SMCs and elastic fibers, laminar medial collapse and fibrosis (Figure 1.9). MD is naturally due to aging, but it can also be induced by other pathologies such as hypertension, bicuspid aortic valve (BAV) and Marfan syndrome (MFS) [3].
![Figure 1.11. Effects of aortic size aneurysm on cumulative, lifetime incidence of complications for (a) ascending aorta and (b) descending aorta [9]](https://thumb-eu.123doks.com/thumbv2/123dokorg/7511895.105308/49.918.141.805.573.799/effects-aneurysm-cumulative-lifetime-incidence-complications-ascending-descending.webp)