IRELAND
Serena Favarin directed by: Ernesto U. Savona
Martina Rotondi Serena Favarin
Series: The Factbook on the Illicit Trade in Tobacco Products Issue 3
Series editor: Ernesto U. Savona
Transcrime – Joint Research Centre on Transnational Crime
Università Cattolica del Sacro Cuore di Milano – Università degli Studi di Trento Milan office (headquarters): Largo Gemelli, 1 – 20123 Milano (Italy)
Phone: +39 02 7234 3715 / 3716; Fax: +39 02 7234 3721 www.transcrime.it
2013
ISBN 978–88–8443–485–2
Suggested Citation: Calderoni Francesco, Martina Rotondi and Serena Favarin. Ireland. The Factbook on the Illicit Trade in Tobacco Products 3. Trento: Transcrime – Università degli Studi di Trento, 2013.
© 2013 Transcrime – Joint Research Centre on Transnational Crime
All rights reserved. No part of this publication may be reproduced, stored in a retrieval system or transmitted in any form or by any means electronic, mechanical, photocopying, recording or otherwise, without the prior written permission of the author.
Credits: Keith–McGovern (cover), Sebastian Dooris (picture p.19), Luciano Belviso (picture p.27), Pawel Loj (picture p.35), Karrie Nodalo (picture p.43), creative commons licence; http://dublinobserver.com/?p=985 (picture p.49) Graphic project: Anna Maria Stefani, Andrea Pesoli and Damiano Salvetti – Transcrime
Transcrime
The factbook on the illicit trade in tobacco
products
Acknowledgments
Executive summary
Introduction
Why focus on the ITTP in Ireland?
What can be found in this report?
Chapter 1
: the five drivers
Society and economy
Legal market
Regulation
Crime environment
Enforcement
Chapter 2
: the four components
The demand
The supply
The products
Modus operandi
and geographical distribution
Chapter 3:
framing the components in the drivers
The five key factors of the ITTP
The demand for illicit tobacco and the drivers
The supply of illicit tobacco and the drivers
The products and the drivers
The modus operandi
and geographical distribution of
the ITTP and the drivers
Conclusions
References
1 3 5 7 15 15 16 18 19 27 35 43 49 58 59 64 68 81 83 85 87 61 91 95 78 791
The factbook on the illicit trade in tobacco products
IRELAND
Official website:www.transcrime.it
Transcrime is the Joint Research Centre on Transnational Crime of Università Cattolica del Sacro Cuore of Milan and the University of Trento. The Centre, directed by Ernesto U. Savona, Professor of Criminology at Università Cattolica, represents the multiannual union between experience and innovation in the field of criminological research.
There are offices in Milan and in Trento. In each office there is a team of researchers and secretariat/ management personnel. Transcrime aims at being a national and international point of reference in the criminological field.
The vision of the Centre is to increase knowledge in the criminological field and in the prevention of crimes, developing innovative ideas and cutting–edge techniques. Transcrime combines its experience in applied research with the consolidated scientific tradition of Università Cattolica del Sacro Cuore in Milan and University of Trento, mixing a practice–oriented approach with a profound understanding of criminal phenomena.
Through this experience, it developed a solid network of relationships in the academic field, institutions, international organisations and businesses.
The Centre also plays an important role in the support and development of educational activities at Università Cattolica del Sacro Cuore of Milan. Its principal aim is to achieve close integration between scientific innovation and academic education. In particular, since the academic year 2005/06, Transcrime has managed a MA programme dedicated to crime and security (until academic year 2012/13 the curriculum Crime&Tech: Crime Sciences
and Technologies for Security within the MA in Applied
Social Sciences; since the 2013/14 academic year Curriculum POLISI: Policies for security within the MA in Public Policy). In addition, the Centre has contributed to the development of the International Ph.D. programme in Criminology, coordinated by Professor Savona, which is currently the only doctoral course dedicated to Criminology in Italy.
Transcrime is an independent academic centre. It pursues an autonomous research agenda, which may be developed also through contracts and funding by private and public local, national and international institutions. The source of funding is always made public through Transcrime’s website.
3
The factbook on the illicit trade in tobacco products
IRELAND
TRADE IN
TOBACCO
PRODUCTS
This report is part of the project The Factbook on the
Illicit Trade in Tobacco Products (henceforth ITTP).
The project has been developed by Transcrime after the Round Table on Proofing EU Regulation against the
Illicit Trade in Tobacco Products hosted by Università
Cattolica of Milan, on 5 May 2011. During the Round Table, participants (researchers and policymakers with experience in the field of the illicit trade in tobacco products) agreed on a research agenda concerning the ITTP (Transcrime 2011b). Items 3 and 6 of the research agenda focused on the need for better analysis of the tobacco market taking account of its dual nature (i.e. legal and illicit) and on how licit and illicit markets vary across different countries and regions. Given these considerations, Transcrime has developed the Factbook on the ITTP, a multi–annual research plan providing detailed analyses of the ITTP and of its relations with the legal market and other socioeconomic and political factors in a number of countries around the world.
The aim of the Factbook is to provide an innovative instrument able to shed light on the complex mechanisms behind the ITTP in different countries. This report focuses on Ireland. Given the close geographical, social, economic and cultural connections, it also focuses, where appropriate, on Northern Ireland, a part of the United Kingdom.1
Tobacco consumption is undoubtedly a danger for human health, and governments should carefully regulate the tobacco market. Illicit tobacco avoids state regulation and taxation and may jeopardize tobacco control policies.
The Factbook will contribute to raising awareness about the global importance of the ITTP and about the strategies available to prevent it. The Factbook has been developed for a wide readership ranging from policymakers, through academics, to interested stakeholders, the intention being to provide a support to develop knowledge-based debates and policies on the ITTP.
The information gathered for this report originates from academic literature, grey literature, open sources, questionnaires and interviews with experts and
stakeholders. While there are some studies on the ITTP in Ireland, the data–gathering phase of the projects encountered major difficulties due to the number of sources, institutions and stakeholders involved. The results of the report do not claim to be exhaustive, nor an accurate reflection of criminal practices. They provide an initial assessment of the ITTP in Ireland and a starting point for future research.
As a concerned stakeholder in the fight against the illicit trade in tobacco products, Philip Morris International (PMI) welcomed Transcrime’s initiative to develop the Factbook on the ITTP with financial support and the provision of relevant data. However, Transcrime retained full control and stands guarantor for the independence of the research and its results. Information and data for the study have been collected by Transcrime and have not been shared with PMI.
1. The first country profile of the project The Factbook on the ITTP focused on the UK and was released in January 2013. See http:// transcrime.cs.unitn.it/tc/1104.php.
5
The factbook on the illicit trade in tobacco products
IRELAND
Special thanks go to (in alphabetical order) Richard Brophy (Coordinator, Retailers Against Smuggling), Vincent Byrne (former Detective Sergeant, Criminal Assets. Bureau), Michael J. Doherty (Assistant Principal, Investigations & Prosecutions Division, Revenue Commissioners), Benny Gilsenan (National
Spokesperson, Retailers Against Smuggling), Deirdre Healy (CA Director at John Player/Imperial Tobacco, ITMAC), Will O’Reilly (former Detective Chief Inspector, Scotland Yard) and John Whiting (Assistant Director HMRC Criminal Investigation Carne House).
7
The factbook on the illicit trade in tobacco products
IRELAND
This report is part of the project The Factbook on the
Illicit Trade in Tobacco Products. It focuses on Ireland,
where the illicit trade in tobacco products has been an important concern since 2007–2008. According to unofficial estimates, 29.7% of total tobacco consumption was illicit in 2012, when Ireland ranked 3rd (after Latvia and Lithuania) among 22 European countries for illicit tobacco penetration (Euromonitor International 2013a). To tackle the ITTP, the Revenue Commissioners have launched the Revenue’s Strategy on Combating the Illicit Tobacco Trade (2011–2013), the aim of which is to deter people from buying illicit trade products and to reduce their availability. Given the close geographical (shared land border), social, economic and cultural connections, the report also focuses, where appropriate, on Northern Ireland, a part of the United Kingdom.
WHAT CAN BE FOUND IN THIS
REPORT?
This report is organised into three chapters:
••
Chapter one deals with the five drivers of the ITTP: society and economy, the legal market, regulation, the crime environment and enforcement. The drivers areimportant areas whose structures may positively or negatively impact on the ITTP. To enable comparison with other country profiles, five key indicators have been selected for each driver. The
data for the driver indicators come from comparable sources (last available years). When possible, the report provides the most up-to-date data from national sources.
••
Chapter two focuses on the four components of the ITTP: demand, products, supply, modus operandi and geographical distribution.••
Chapter three identifies the key factors of the ITTP in Ireland and frames the drivers in the components, analysing how different elements of the drivers influence the components of the ITTP.THE FIVE DRIVERS
••
Society and economy: Ireland is one of the last countries in Western Europe to become multicultural. From 1994 to 2007 Ireland experienced an economic boom that earned it the name of the “Celtic Tiger”. The global financial crisis severely affected the country, but Ireland showed great capacity for recovery. The effects of the crisis, however, are still apparent: Ireland has high unemployment and the largest public debt among the EU Member States. However, consumption expenditures have slightly increased.••
Legal market: Ireland has not been a cigarettes producer since 2006. Factories moved to Northern Ireland, owing to its lower production costs. The only remaining facility produces HRT. Ireland has the second highest cigarette prices in Europe. Tobacco consumption has declined, and the market has entered a downtrading trend, with smokers switching to cheaper products.8
••
Regulation: the tobacco market is highly regulated in Ireland, which was the first country in the world to ban smoking in all indoor places in 2004. Tax incidence is high. There is a high level of supply chain control and on tobacco consumption, as well as on tobacco advertising and promotion.••
Crime environment: Ireland has low crime levels. There are various organised crime groups and paramilitary groups operating within the country. The level of corruption is low. Drug use in the country is relatively high, if compared to other countries (6.3% for cannabis, 1.7% for cocaine and 0.7% for opioids). This signals that illicit distribution networks may provide opportunities for illicit traffic, from drugs to illicit tobacco.••
Enforcement: Ireland has efficient law enforcement with an average number of police officers and low rates of judges and prison population. The Government is taking specific actions against the illicit trade in tobacco, and there is a medium–high level of anti–ITTP action.THE FOUR COMPONENTS OF THE ITTP
••
The demand: the main causes of the demand for illicittobacco are the low prices in comparison to the price of legal product and its availability. Illicit cigarettes cost half the legal price (or slightly more). Consumers are mainly working–class males between 18 and 39 years old or under–age people.
••
The supply: the supply of illicit tobacco is influenced by its high profitability, with relatively low risks of detection and conviction. There is a wide variety of actors involved in ITTP, such as serious organised crime groups, based in both Ireland and Northern Ireland, foreign–based groups, opportunistic groups, and individual bootleggers.••
The products: the Revenue Commissioners report official estimates of the illicit tobacco market. KPMG Star Report provides a further assessment of the illicit market. In addition, there are various unofficial estimates. The main illicit products are illicit whites (according to seizures and interviews with experts) and contraband cigarettes (according to Empty Pack Survey data). Counterfeit cigarettes are not widespread and have a low incidence.••
Modus operandi and geographical distribution: the modus operandi of the illicit tobacco trade varies according to the type of trade, the destination, and the level of controls. In Ireland, ports are crucial for the ITTP, but smugglers also use air transport, small vehicle transport, and postal transport. The consumption of non–domestic tobacco varies among the different areas of the country.FRAMING THE COMPONENTS IN THE
DRIVERS
The five key factors of the ITTP
The report identifies five key factors of the ITTP in Ireland. They are fundamental determinants of the illicit trade and affect all its components. Hereafter, four subsections analyse how the five drivers impact on the key factors and in turn the components of the ITTP. The key factors are:
••
Accessibility: the price of illicit tobacco, andparticularly its relative price compared to legal products, is a crucial factor in determining the scope and prevalence of the ITTP.
••
Availability: the diffusion and accessibility of illicit tobacco products has an important impact on the ITTP.••
Profitability: the ITTP is an extremely profitable activity owing to the high income that it offers compared with the operational costs.••
Risk: the threat of detection/accusation/conviction and the sanctions imposable impact on the diffusion of the ITTP.••
Opportunity: the ITTP exploits different opportunities in society, the market, the crime environment, and the law enforcement system.This study analyses the complex interactions among the drivers, the key factors and the components of the ITTP. The following figures synthesise the main interactions, highlighting the multifaceted nature of the ITTP in Ireland.
9
The factbook on the illicit trade in tobacco products
IRELAND
Source:Transcrime elaboration
negative effect positive effect (increases the ITTP) (decreases the ITTP) Figure 1. The interaction between the demand for illicit tobacco and the five drivers
regulation
DEMAND FOR
ILLICIT TOBACCO
ACCESSIBILITY:
tax increases reduce the accessibility of legal products and thereby increase demand for illicit products
OPPORTUNITY:
plain packaging may reduce consumers’ capacity to spot counterfeits and differentiation between genuine and illicit tobacco
crime environment
AVAILABILITY:
high demand for illicit drugs may increase the availability of smuggled tobacco due to the habit of consuming smuggled products
legal market
ACCESSIBILITY:
increases in the prices of legal tobacco products may stimulate the demand for cheap and illicit tobacco
AVAILABILITY:
different channels may supply illicit tobacco products in Ireland; this may positively influence the demand
society & economy
OPPORTUNITY:
attempts to maintain
consumption habits at a time of crisis may induce consumers to buy illicit tobacco
AVAILABILITY & ACCESSIBILITY:
the low price of illicit tobacco (50–60% less) may favour demand among economically disadvantaged groups and the availability of such products
RISK:
the absence of fines for buyers of illicit tobacco may influence the demand for illicit tobacco
RISK:
the lack of public awareness campaigns on the health consequences of illicit tobacco consumption prevents reduction of the black market’s clients
enforcement
The demand for illicit tobacco and the
drivers
The main factors affecting the demand are the accessibility and the availability of illicit tobacco (Figure 1).
Society and economy. In 2008–2009, the global financial crisis provoked major economic difficulties for Ireland. Nevertheless, household expenditure slightly increased. Expenditure on cigarettes increased as well, but consumers switched to cheaper products (downtrading). The high price of legal cigarettes and the low price of illegal ones may induce lower income groups to switch to illicit tobacco in order to maintain their habits.
Legal market. Ireland has the second highest cigarette prices among the European countries. Tobacco consumers are changing their habits and shifting to cheaper products, such as HRT. This trend may also include illicit tobacco, which is widely available in Ireland.
Regulation. Tax incidence on tobacco products in Ireland is high. This may affect the demand for cheaper illicit tobacco. Furthermore, the proposed introduction of plain packaging may reduce consumers’ capacity to spot counterfeits as well as the differentiation between genuine and counterfeit products. This may increase the demand for illicit tobacco.
Crime environment. Ireland has relatively high levels of drug consumption and a large drugs market. The annual prevalence of cannabis (6.3%), cocaine (1.7%) and opioids (0.7%) is high if compared with other countries. A high demand for illicit commodities, such as illicit substances and drugs, may increase the availability of smuggled tobacco.
Enforcement. The criminal penalties against the ITTP appear to be mild in Ireland. Furthermore, there are no fines for the purchase/possession of illicit tobacco and no public awareness campaigns funded by the Government. These factors may prevent the reduction of consumption of illicit tobacco.
10
Source:Transcrime elaboration
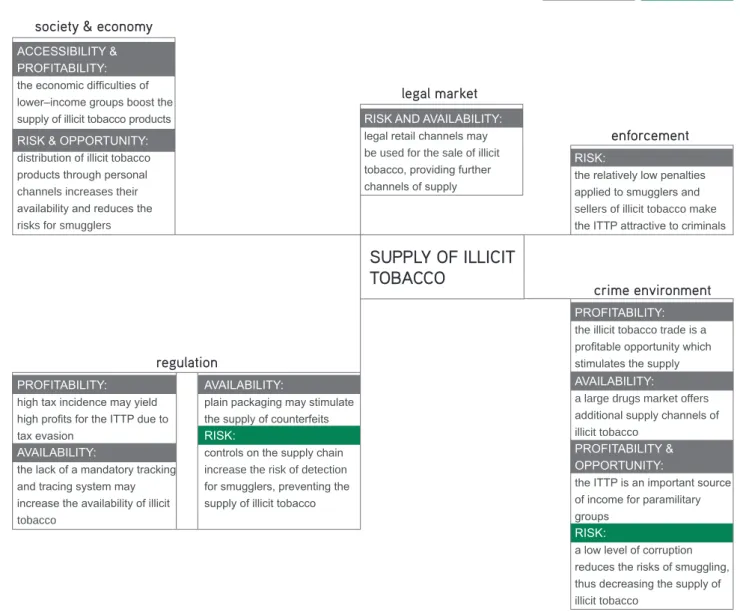
negative effect positive effect (increases the ITTP) (decreases the ITTP) Figure 2. The interaction between the supply of illicit tobacco and the five drivers
regulation
SUPPLY OF ILLICIT
TOBACCO
PROFITABILITY:
high tax incidence may yield high profits for the ITTP due to tax evasion
AVAILABILITY:
the lack of a mandatory tracking and tracing system may increase the availability of illicit tobacco
crime environment
PROFITABILITY:
the illicit tobacco trade is a profitable opportunity which stimulates the supply
AVAILABILITY:
a large drugs market offers additional supply channels of illicit tobacco
PROFITABILITY & OPPORTUNITY:
the ITTP is an important source of income for paramilitary groups
RISK:
a low level of corruption reduces the risks of smuggling, thus decreasing the supply of illicit tobacco
legal market
RISK AND AVAILABILITY:
legal retail channels may be used for the sale of illicit tobacco, providing further channels of supply
society & economy
ACCESSIBILITY & PROFITABILITY:
the economic difficulties of lower–income groups boost the supply of illicit tobacco products
RISK:
the relatively low penalties applied to smugglers and sellers of illicit tobacco make the ITTP attractive to criminals
enforcement
RISK & OPPORTUNITY:
distribution of illicit tobacco products through personal channels increases their availability and reduces the risks for smugglers
AVAILABILITY:
plain packaging may stimulate the supply of counterfeits
RISK:
controls on the supply chain increase the risk of detection for smugglers, preventing the supply of illicit tobacco
The supply of illicit tobacco and the
drivers
Risk, profitability and availability are important factors in the supply of illicit tobacco (Figure 2).
Society and economy. Economic difficulties and the crisis may provide incentives for participation in the ITTP. Illicit cigarettes can be easily purchased in street markets or through personal channels, and this may reduce the risks for smugglers.
Legal market. Illicit tobacco can be available in certain pubs, street markets, willing retailers and from street or door–to–door dealers. Ireland has the second highest cigarette prices among the European countries. As a consequence, the Irish market has entered a downtrading trend, with people switching to cheaper cigarettes and to HRT. The growing demand for HRT may increase the availability of illicit HRT in forthcoming years.
Regulation. High tax incidence, implementation of a display ban at all tobacco points of sale, and the lack of a tracking and tracing system may increase the availability of illicit tobacco. However, measures such as mandatory licensing for tobacco retailers and manufacturers and customer identification during tobacco sales transactions may decrease the availability of illicit tobacco and increase the risks for smugglers. The proposed introduction of plain packaging, potentially in 2014, may increase the availability of smuggled tobacco products. Crime environment. Ireland has low levels of corruption and a relatively limited presence of organised crime activity. This may reduce opportunities to smuggle tobacco and increase the likelihood of detection/
accusation/conviction of potential smugglers. Conversely, paramilitary groups are involved in ITTP and the
existence of consolidated smuggling routes as well as of a large drugs market may positively affect the supply side of the illicit tobacco trade.
11
The factbook on the illicit trade in tobacco products
IRELAND
Source:Transcrime elaboration
negative effect positive effect (increases the ITTP) (decreases the ITTP) Figure 3. The interaction between the products and the five drivers
Enforcement. In Ireland, criminal law seems to have a limited deterrent effect. In a serious case of ITTP, the suspects may face a fine of up to €126,970 (or a maximum of three times the evaded duty) or a term of imprisonment not exceeding five years, or both. Furthermore, there is no minimum fine, and the fines imposed in practice are low compared with the maximum imposable fines.
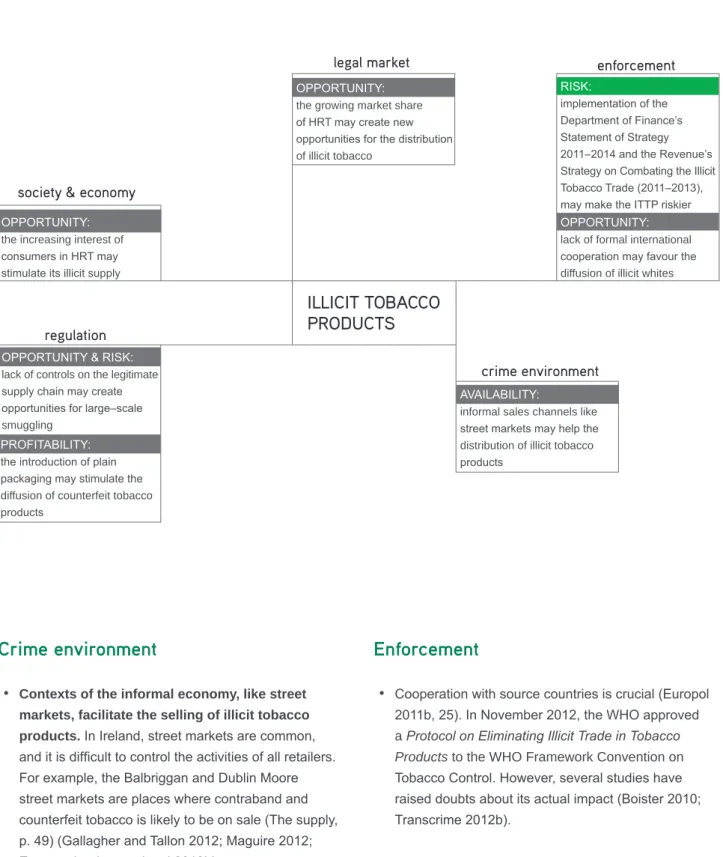
The products and the drivers
The main factors determining the development and diffusion of different types of products are opportunity and risk (Figure 3).
Society and economy. Social, cultural and economic factors affect the types of illicit products consumed by smokers. For example, HRT is a growing product due to its cheaper price. This may increase the supply of illicit HRT.
Legal market. HRT consumption has increased, and smugglers seem to adapt to this growing demand by increasing the trade of HRT.
Regulation. The absence of a national tracking and tracing system may favour different types of ITTP. This loophole can make it more difficult to spot counterfeit products. Further, the introduction of plain packaging may stimulate the diffusion of counterfeit products.
Crime environment. Contexts of the informal economy, like street markets, facilitate the sale of illicit tobacco products. Street markets are a feature in Ireland, and it is difficult to control the activities of all street retailers. Enforcement. There are no formal international cooperation agreements with other countries. However, the authorities of the Republic of Ireland and Northern Ireland are working closely to fight the illicit trade.
regulation
ILLICIT TOBACCO
PRODUCTS
OPPORTUNITY & RISK:lack of controls on the legitimate supply chain may create opportunities for large–scale smuggling
crime environment
AVAILABILITY:
informal sales channels like street markets may help the distribution of illicit tobacco products
legal market
OPPORTUNITY:
the growing market share of HRT may create new opportunities for the distribution of illicit tobacco
society & economy
OPPORTUNITY:
the increasing interest of consumers in HRT may stimulate its illicit supply
RISK:
implementation of the Department of Finance’s Statement of Strategy 2011–2014 and the Revenue’s Strategy on Combating the Illicit Tobacco Trade (2011–2013), may make the ITTP riskier
OPPORTUNITY:
lack of formal international cooperation may favour the diffusion of illicit whites
enforcement
PROFITABILITY:
the introduction of plain packaging may stimulate the diffusion of counterfeit tobacco products
12
Source:Transcrime elaboration
negative effect
positive effect (increases the ITTP) (decreases the ITTP) Figure 4. The interaction between the modus operandi and geographical distribution of the ITTP and the five drivers
regulation
RISK:
the maximum quantities imposed on tobacco that travellers can bring into the country may deter passengers from small–scale smuggling
crime environment
RISK & OPPORTUNITY:
the low level of corruption increases the risks of importing illicit tobacco products
OPPORTUNITY & AVAILABILITY:
drug trafficking and ITTP may share scope and learning economies
OPPORTUNITY:
organised and paramilitary groups already present in the illicit drugs market also take part in the ITTP
legal market
OPPORTUNITY & AVAILABILITY:
the absence of free trade zones in Ireland may reduce the risk of illicit tobacco trading
society & economy
OPPORTUNITY:
internet sales may facilitate the distribution of illicit
tobacco products RISK:
the relatively low penalties applied to smugglers and sellers of illicit tobacco make the ITTP attractive to criminals
enforcement
OPPORTUNITY & AVAILABILITY:
plain packaging may favour the penetration of counterfeit products
MODUS OPERANDI AND GEOGRAPHICAL DISTRIBUTION
OPPORTUNITY:
economic difficulties may stimulate engagement in small–scale contraband
The modus operandi and geographical
distribution and the drivers
Opportunity and risk play a crucial role in influencing the
modus operandi and the geographical distribution of the
ITTP (Figure 4).
Society and economy. People in Ireland have started using the Internet to buy cheaper tobacco products. The websites are often registered abroad and not subject to Irish regulation. High levels of unemployment and the financial crisis have stimulated small–scale smuggling. Legal market. Ireland has no Free Trade Zones. The Shannon Free Trade Zone is just a government owned developed company for a region.
Regulation. The presence of rules and restrictions on the personal transportation of tobacco products in Ireland may deter travellers from illegal imports, small–scale smuggling, and bootlegging. Further, the proposed introduction of plain packaging may favour the penetration of counterfeit products.
Crime environment. Smugglers may import illicit tobacco products through the same channels as drugs. Various actors participate in the ITTP, such as occasional smugglers, professional bootleggers, Irish and foreign criminal organisations, and paramilitary groups. Enforcement. In Ireland, new forms of ITTP have emerged in recent years and made new products available. Only the three major Irish ports are staffed by law enforcement and have detection devices available. This may create new opportunities for smugglers.
Conclusions
The Revenue Commissioners provide official estimates of ITTP in Ireland. Another source is the KPMG Star Report, which estimates the ITTP penetration in all the EU countries. Further, there are also unofficial estimates, which furnish different figures. Despite discrepancies, the illicit tobacco trade in Ireland appears to be high if compared with other European countries. According to various sources, the ITTP consists mainly of contraband products and illicit whites.
13
The factbook on the illicit trade in tobacco products
IRELAND
The results of the study show the need for more data and research. Required in particular is investigation of the demand for illicit products and the types of products. First, there is no research on the consumers of illicit tobacco, and this makes it difficult to determine what drives the demand for cheap tobacco. Further, there is no agreement on the most widespread types of illicit tobacco, and there are difficulties in distinguishing between non–domestic legal and illegal cigarettes. Furthermore, additional research is needed to assess the impact of new policy measures, such as plain packaging.
The ITTP is a complex problem, not limited to an issue of law enforcement and criminal justice policy alone. According to the Revenue Commissioners, government measures halted the growth of the ITTP in 2009 and 2011. However, other sources report an increase in the ITTP in recent years. Additional preventive measures, such as a national public awareness campaign and a mandatory tracking and tracing system for all manufacturers, may be necessary. Effective action against the ITTP requires comprehensive strategies including criminal law, administrative sanctions, and other indirect measures aimed at reducing crime opportunities.
The evolution of the project showed that countries have very different situations in relation to the available data on the ITTP. In some cases, the quality of the available data is low and there are no official, regularly updated, data. Inevitably, this may affect the quality and reliability of the results. In these cases, institutions, businesses and other stakeholders concerned by the ITTP should consider how to improve the data collection on illicit tobacco. This will result in an improvement in the knowledge of the ITTP and, in turn, in better tobacco control policies, since quite often the impact of specific policy measures upon crime may be overlooked due to the lack of reliable data.
Following the completion of the first phase of the project focused on collecting facts and data through the country profiles, Transcrime will perform a comparative analysis of the selected countries. This will provide additional insights in the complexity of the ITTP and allow for the elaboration of policy recommendations.
14
Source: The World Bank Location:
Ireland is an island in the North–Western Europe. It is the third largest island in Europe and it is surrounded by the Irish Sea. To the East of Ireland, there is the island of Great Britain. Politically, Ireland is divided between the Republic of Ireland and Northern Ireland (which is formally part of the United Kingdom). The Republic of Ireland is divided in four regions and in twenty–six traditional counties.
Population: 4,576,317 (2011)
Male: 2,290,447 (50.05%)
Female: 2,285,870 (49.95%)
Growth Annual Rate: 0.28% (2011)
Age Structure: (0–14) 21.33%; (15–64) 66.77%; (65+) 11.90%
Fertility Rate: 2.05 children born/woman (2011)
Life expectancy at birth (years): 80.5 (2011)
GDP: $ 217,274,951,000 (2011)
GDP growth: -0.7% (2011)
Inflation consumer price: 2.6% (2011)
Income level: High
Blanchardstown Waterford Leinster Limerick Cork Munster Connacht Ulster
Galway ClondalkinTallaght Dublin
Celtic Sea
15
The factbook on the illicit trade in tobacco products
IRELAND
WHY FOCUS ON THE ITTP IN IRELAND?
The Republic of Ireland (henceforth Ireland) is
geographically part of Ireland, the second biggest island of the British Isles. The Republic of Ireland borders with Northern Ireland, which is part of the United Kingdom. Owing to its geographical position, Ireland is primarily a destination for ITTP, but it is also a country of transit towards Northern Ireland and the UK.
The Revenue Commissioners provide official estimates on the ITTP. According to these estimates, 13% of Ireland’s total cigarettes market was illicit in 2012 (Revenue Commissioners 2013a). Another source is the KPMG Star Report, which estimates the illicit market at 19.1% of the total consumption (KPMG 2013). There are also unofficial estimates. These show that the ITTP increased in 2007–2008, after increases in tobacco tax incidence, and would reach 29.7% of the total market in 2012 (Euromonitor International 2013a). This would made Ireland 9th out of 80 countries in terms of the illicit trade in 2012, 3rd among 22 European countries (Euromonitor International 2013a). Ireland has a high level of tax incidence on tobacco products, the second highest cigarette retail prices among EU countries, and a high level of unemployment. These factors make the country vulnerable to the illicit tobacco trade.
In 2011, the Revenue Commissioners launched the
2011–2013 Strategy on combating the illicit tobacco trade (Revenue Commissioners 2011a). It aims to deter
the purchase of illicit trade products and to reduce their availability. In the long term, the Strategy will increase the amount of tax and duties paid, protect legitimate businesses, and deter criminal activity. This demonstrates the Government’s commitment to combating the ITTP. The report also provides information about the ITTP in Northern Ireland, part of the UK. The close geographical, social, economic and cultural connections between the two countries require the joint analysis of specific issues.
Tobacco is a dual market consisting of a legal and an illegal part (Figure 5). The two sides of the market are connected with each other: actions affecting one side of the market influence the other side as well.
The ITTP comprises different activities and products: Smuggling (or contraband): the unlawful movement or transportation of tobacco products (genuine or counterfeit) from one tax jurisdiction to another without the payment of applicable taxes or in breach of laws prohibiting their import or export (Joossens and Raw 2008).
Counterfeiting: the illegal manufacturing of a product bearing or imitating a trademark without the owner’s consent. Illegally manufactured products can be sold in the source country or smuggled into another country (Joossens and Raw 2008).
Bootlegging: the legal purchase of tobacco products in a low–tax country and the illegal resale of these products in a high–tax country. Bootlegging concerns individuals or small groups who smuggle small quantities of cigarettes, taking advantage of tax differentials, with the aim of making extra income (Hornsby and Hobbs 2007).
Unbranded tobacco: manufactured, semi–manufactured and even loose leaves of tobacco (also known as “chop–chop” (Geis 2005)), illegally sold by weight (e.g. in large plastic bags, also known as “baggies”), with no labelling or health warnings and consumed in
roll–your–own cigarettes or in empty cigarette tubes (Walsh, Paul, and Stojanovski 2006).
Figure 5. The dual tobacco market
legal market
illegal market
overlap in
16
Cheap Whites or Illicit Whites: cigarettes produced legally in one country, but normally intended for smuggling into countries where there is no prior legal market for them. Taxes in production countries are normally paid, while they are avoided/evaded in destination countries (Allen 2011).
Illegal manufacturing: cigarettes manufactured for consumption, which are not declared to the tax authorities. These cigarettes are sold without tax and may be manufactured in approved factories or illegal covert operations (Joossens et al. 2010).
Studies on the ITTP in Ireland are provided by official and unofficial sources. However, the official source is available only since 2009, which has limited the inquiry. The main sources used by this study have been the Revenue Commissioners data on ITTP and on illicit tobacco products seizures, KPMG and Euromonitor International data, empty pack surveys commissioned by the tobacco industry, interviews with officials, key informants, and media news. Unofficial sources are treated with caution to minimise the impact of their possible bias.
WHAT CAN BE FOUND IN THIS
REPORT?
This report is organised into three chapters.
Chapter 1 is composed of five subsections analysing the five drivers of the ITTP:
1) society and economy 2) the legal market 3) regulation
4) the crime environment 5) enforcement
The drivers are important areas whose structures may influence the ITTP positively or negatively. Transcrime selected the drivers based on a review of the literature on the ITTP and discussions with stakeholders and experts. Each subsection provides information on the key aspects of each driver.
To enable comparison with other country profiles, each driver has five key indicators. The data for
the drivers’ indicators come from different sources, to ensure comparability among different countries to the last available years (e.g. World Bank, WHO, UN). When possible, the report provides the most up–to–date data from national sources. For four indicators, Transcrime has elaborated composite indicators (see
Regulation p. 35 and Enforcement p. 49). Composite indicators assess the presence of specific policy measures in the country and range from 0 (no measure is present) to 5 (all measures are present). A higher value on the composite indicators does not always imply a better situation. Their purpose is rather to assess the intensity of policy measures in a specific field. The information used for the assessment is drawn from the literature, official sources (reports, websites, legislation) and experts.
Chapter 2 analyses the illicit trade in Ireland, dividing it into its four components of the ITTP:
1) the demand 2) the supply 3) the products
4) the modus operandi and geographical distribution. Chapter 3 combines the results of the two previous chapters to identify the key factors behind the ITTP and show how the various elements of the drivers influence the illicit trade.
19
The factbook on the illicit trade in tobacco products
IRELAND
SOCIETY &
ECONOMY
A
fter an economic boom between the mid–1990s and the 2000s, Ireland has been
severely affected by the global financial crisis. It has shown a great capacity for recovery.
Household expenditure has slightly increased, but unemployment and the public debt are still
high.
0.29
22 out of 34 countries
(late 2000s)
Income Inequality
GINI coefficient after taxes
Source: OECD
Education System
Education expenditure
as % of GDP
Source: The World Bank
5.6%
15 out of 157 countries
(2010)
20.1%
37 out of 213 countries
(2010)
Unemployment
Total unemployment
rate (% of labour force)
Source: OECD
14.6%
3 out of 34 countries
(2011)
Adult Population
Population aged 15+
Source: The World Bank
78.7%
65
out of 193 countries
(2011)
Migration
International migrant stock
as % of population
Source: The World Bank
High % Low % High Low High % Low % High % Low % High % Low %
Last national available data (May 2013):
13.7%
(Central Statistics Office 2013e)20
298.8 2004 294.9 2005 2006 320.5 2007 331.1 2008 321.6 2010 329.7 2009 78.5 2010 79.5 2006 4.8 2005 4.7 2006 4.7 2007 12.2 2009 13.9 2010 8.3 2008 79.4 79.4 79.3 79.1 79.0 78.8 78.7 2005 2006 2007 2008 2009 2010 2011 79.4 79.4 79.3 79.1 79.0 78.8 78.7 2005 2006 2007 2008 2009 2010 2011 0.31 0.29 mid-2000s late-2000s 5.4 5.4 5.8 7.2 6.2 5.6 2005 2006 2007 2008 2009 2010 14.8 20.1 2005 2010 4.6 5.8 14.6 2004 2008 2011 5,645 5,401 4,984 4,512 4,206 4,099 3,801 2006 2007 2008 2009 2010 2011 2012 -2,452 -3,711 -3,105 -3,048 -3,001 -2,991 -2,997 2006 2007 2008 2009 2010 2011 2012 9.5 2010 7.7 8.0 8.0 7.5 69.0* 16 14 14 19 25 2008 2009 2010 2011 2012 1.3 1.5 1.8 1.1 1.3 1.2 2005 2006 2007 2008 2009 2010 0.7 1.7 6.3 2012 15.9 16.0 15.8 15.6 15.5 15.4 2002 2003 2004 2005 2006 2007 3.0 3.0 3.3 2003 2004 2005 2006 2007 2008 2009 2010 306.5 31 28 2006 2009 Value Rank Opioids Cocaine Cannabis 2008 2009 2010 2011 2012 HRT (kg) Cigarettes (kg) 67 234 75 249 115 2,432 2,083 3,985 4,900 3,046 79.5 2008 2010 328.8 78.5 373.3Tax % final retail price Tax per 1,000 sticks/Int.$, PPP
298.8 2004 294.9 2005 2006 320.5 2007 331.1 2008 321.6 2010 329.7 2009 78.5 2010 79.5 2006 4.8 2005 4.7 2006 4.7 2007 12.2 2009 13.9 2010 8.3 2008 79.4 79.4 79.3 79.1 79.0 78.8 78.7 2005 2006 2007 2008 2009 2010 2011 79.4 79.4 79.3 79.1 79.0 78.8 78.7 2005 2006 2007 2008 2009 2010 2011 0.31 0.29 mid-2000s late-2000s 5.4 5.4 5.8 7.2 6.2 5.6 2005 2006 2007 2008 2009 2010 14.8 20.1 2005 2010 4.6 5.8 14.6 2004 2008 2011 5,645 5,401 4,984 4,512 4,206 4,0993,801 2006 2007 2008 2009 2010 2011 2012 -2,452 -3,711 -3,105 -3,048 -3,001 -2,991 -2,997 2006 2007 2008 2009 2010 2011 2012 9.5 2010 7.7 8.0 8.0 7.5 69.0* 16 14 14 19 25 2008 2009 2010 2011 2012 1.3 1.5 1.8 1.1 1.3 1.2 2005 2006 2007 2008 2009 2010 0.7 1.7 6.3 2012 15.9 16.0 15.8 15.6 15.5 15.4 2002 2003 2004 2005 2006 2007 3.0 3.0 3.3 2003 2004 2005 2006 2007 2008 2009 2010 306.5 31 28 2006 2009 Value Rank Opioids Cocaine Cannabis 2008 2009 2010 2011 2012 HRT (kg) Cigarettes (kg) 67 234 75 249 115 2,432 2,083 3,985 4,900 3,046 79.5 2008 2010 328.8 78.5 373.3
Tax % final retail price Tax per 1,000 sticks/Int.$, PPP
298.8 2004 294.9 2005 2006 320.5 2007 331.1 2008 321.6 2010 329.7 2009 78.5 2010 79.5 2006 4.8 2005 4.7 2006 4.7 2007 12.2 2009 13.9 2010 8.3 2008 79.4 79.4 79.3 79.1 79.0 78.8 78.7 2005 2006 2007 2008 2009 2010 2011 79.4 79.4 79.3 79.1 79.0 78.8 78.7 2005 2006 2007 2008 2009 2010 2011 0.31 0.29 mid-2000s late-2000s 5.4 5.4 5.8 7.2 6.2 5.6 2005 2006 2007 2008 2009 2010 14.8 20.1 2005 2010 4.6 5.8 14.6 2004 2008 2011 5,645 5,4014,984 4,512 4,206 4,099 3,801 2006 2007 2008 2009 2010 2011 2012 -2,452 -3,711 -3,105 -3,048 -3,001 -2,991 -2,997 2006 2007 2008 2009 2010 2011 2012 9.5 2010 7.7 8.0 8.0 7.5 69.0* 16 14 14 19 25 2008 2009 2010 2011 2012 1.3 1.5 1.8 1.1 1.3 1.2 2005 2006 2007 2008 2009 2010 0.7 1.7 6.3 2012 15.9 16.0 15.8 15.6 15.5 15.4 2002 2003 2004 2005 2006 2007 3.0 3.0 3.3 2003 2004 2005 2006 2007 2008 2009 2010 306.5 31 28 2006 2009 Value Rank Opioids Cocaine Cannabis 2008 2009 2010 2011 2012 HRT (kg) Cigarettes (kg) 67 234 75 249 115 2,432 2,083 3,985 4,900 3,046 79.5 2008 2010 328.8 78.5 373.3
Tax % final retail price Tax per 1,000 sticks/Int.$, PPP
298.8 2004 294.9 2005 2006 320.5 2007 331.1 2008 321.6 2010 329.7 2009 78.5 2010 79.5 2006 4.8 2005 4.7 2006 4.7 2007 12.2 2009 13.9 2010 8.3 2008 79.4 79.4 79.3 79.1 79.0 78.8 78.7 2005 2006 2007 2008 2009 2010 2011 79.4 79.4 79.3 79.1 79.0 78.8 78.7 2005 2006 2007 2008 2009 2010 2011 0.31 0.29 mid-2000s late-2000s 5.4 5.4 5.8 7.2 6.2 5.6 2005 2006 2007 2008 2009 2010 14.8 20.1 2005 2010 4.6 5.8 14.6 2004 2008 2011 5,645 5,401 4,984 4,512 4,206 4,0993,801 2006 2007 2008 2009 2010 2011 2012 -2,452 -3,711 -3,105 -3,048 -3,001 -2,991 -2,997 2006 2007 2008 2009 2010 2011 2012 9.5 2010 7.7 8.0 8.0 7.5 69.0* 16 14 14 19 25 2008 2009 2010 2011 2012 1.3 1.5 1.8 1.1 1.3 1.2 2005 2006 2007 2008 2009 2010 0.7 1.7 6.3 2012 15.9 16.0 15.8 15.6 15.5 15.4 2002 2003 2004 2005 2006 2007 3.0 3.0 3.3 2003 2004 2005 2006 2007 2008 2009 2010 306.5 31 28 2006 2009 Value Rank Opioids Cocaine Cannabis 2008 2009 2010 2011 2012 HRT (kg) Cigarettes (kg) 67 234 75 249 115 2,432 2,083 3,985 4,900 3,046 79.5 2008 2010 328.8 78.5 373.3
Tax % final retail price Tax per 1,000 sticks/Int.$, PPP
21
The factbook on the illicit trade in tobacco products
IRELAND
••
Ireland experienced an economic boom between the 1990s and the 2000s.•
From 1994 to 2007 Ireland experienced an economic boom, which earned it the name of the “Celtic Tiger”. Yearly GDP growth averaged 7% and per capita incomes exceeded the EU average to reach “the fourth highest level of GDP per capita in the OECD” (OECD 2011, 5).•
The economic expansion, since 2001 was mainly based on construction, credit and consumption. This resulted in an unbalanced growth. In the second half of the 2000s the burst of the property bubble had serious economic consequences.•
Between 2004 and 2006 a growth of around 30% was recorded in bank lending fuelling further the construction boom of the 2000s. The main reasons for this increase were low real interest rates and an integrated financial market. Credits grew more than deposits, and Irish banks started to borrow resources from abroad to finance the property boom. In 2005–2009, the nation borrowed about 4% of the national income from abroad (Department of Finance 2012c).•
In 2008–2009 the global financial crisis exacerbated these difficulties and Ireland entered a recession. GDP decreased by 5.2% in 2008, 9.8% in 2009 and 3% in 2010 (Central Statistics Office 2011, 17). The situation changed in 2011, when GDP grew by 1.6% (Central Statistics Office 2011, 17). Preliminary estimates indicate that GDP increased by 0.9% between 2011 and 2012 (Central Statistics Office 2013a).••
Ireland showed great capacity of recovery from recession.•
The government reacted by recapitalising the banks through public funds in 2009. The National Asset Management Agency (NAMA), a state bank, played an important role in cleaning up the bank system. It forced banks to concentrate on new lending, acknowledging their losses. NAMA acquired 11,500 property development–related loans, with nominal loan balances of €71.2 billion. It paid a consideration of €30.2 billion, a discount of 58%, in return for NAMA bonds. The government used bonds as guarantee for the European Central Bank (OECD 2011, 19).•
The public debt increased due to the financial crisis and state support for the banking sector. It rose from 25% to 108% of GDP between 2007 and 2011. Ireland has the highest public balance deficit among EU Member States, just above 13% of GDP (Central Statistics Office 2011, 22).•
However, NAMA interventions were insufficient. In 2010 Ireland entered the EU–IMF Programme of Support, receiving €67.5 bn on the basis of specific conditions (Department of Finance 2012c).•
The government implemented further austerity measures in order to meet the EU–IMF conditions, such as pay reductions for all public servants (CIA 2012).•
According to the chief economist of the Bank of Ireland, Dan McLaughlin, the GDP will grow by 1.5% in 2013 (Percival 2013). However, preliminary estimates for the first quarter of 2013 show that GDP declined by 0.6%, if compared to the fourth quarter 2012. Further, GDP decreased by 0.9%, if compared with the first quarter of 2012 (Central Statistics Office 2013b).••
Ireland is increasing its exports.•
The European Commission forecasts an increase of Irish exports amounting to around 110% of GDP in 2013. In particular there will be a concentration of services and technology exports (Department of Finance 2012c, 43).•
Ireland is a country promoting entrepreneurship. It ranked 10th in the World Bank’s 2012 Ease of Doing Business Index (The World Bank 2012).•
According to the Human Development Report, Ireland has the 7th Human Development Index (HDI) out of 187 countries in 2011 (UNDP 2011). In 2012, Ireland ranks again 7th out of 187 countries in HDI (UNDP 2013).••
The country still shows signs of difficulties (employment rate and internal demand).22
Figure 6. Household final consumption expenditure, PPP (constant 2005 International $) (1996–2011)
Source: Transcrime elaboration of World Bank (2012) data
0% 5% 10% 15% 20% 25% 30% 35% 00 01 02 03 04 05 06 07 08 09 10 11 12 Euromonitor International ITMAC Flows Model Revenue KPMG
Empty Pack Surveys
JTI 0 2 4 6 8 10 12 0 50 100 150 200 250 2006 2007 2008 2009 2010 2011 2012
Cigarettes (million sticks) HRT (tonnes) 0 10 20 30 40 50 60 70 80 90 96 97 98 99 00 01 02 03 04 05 06 07 08 09 10 11 36.1% 25.3% 15.6% 11.1% 4.2%
3.7%2.4% 1.6% Social & Family Affairs Health & Children Education & Science General Governement Service
Justice, Equality & Law Reform Transport Finance Defence 0 1,000 2,000 3,000 4,000 5,000 6,000 7,000 8,000 9,000
Production Import Export Sales
Ci gar et te s (m n st ic ks ) 98 99 00 01 02 03 04 05 06 07 08 09 10 11 12 0 50 100 150 200 250 300 350 400 2006 2007 2008 2009 2010 2011 2012 91.6% 6.8% 1.6% Cigarettes HRT Cigars 0% 5% 10% 15% 20% 25% 30% 35% 2006 2007 2008 2009 2010 2011 2012 Female Male 72% 74% 76% 78% 80% 82% 84% 86%
Apr July Nov
2002
Aug
2003 2004 2005
Jan July
2007
July Jan July
2009 July 2010 July 2011 July 2012 July 2013 2001
Apr Dec May July
2006
Jan
2008
Jan Jan March Jan Jan 0.0
0.2 0.4 0.6 0.8 1.0 1.2 1.4 1.6 1.8 2.0 95 96 97 98 99 00 01 02 03 04 05 06 07 08 09 10 0% 1% 2% 3% 4% 5% 6% 7%
Opioids Cocaine Cannabis
0% 2% 4% 6% 8% 10% 12% 2002/2003 2006/2007 2010/2011
Adults 15-64 years Young Adult 15-34
0% 1% 2% 3% 4% 5% 6% 7% Q4 2010 2011Q2 2011Q4 2012Q2 2012Q4 0.05% 0.10% 0.15% 0.20% 0.25% 0.35% 0.40% 0.45% Q4 2010 2011Q2 2011Q4 2012Q2 2012Q4 0.30% 0.00% 0% 5% 10% 15% 20% 25% 30% 35% 40% Clare Cork Done gal Dublin Du n-Laogh aire Fingal Galw ay Kerry Kildare Limeric k
Louth Meath Sligo South Dublin South Tippe rary Waterf ord Westm eath Wexfo rd Wicklo w Q2–2012 Q4–2012 0% 5% 10% 15% 20% 25% 30% 35% Q4 2010 2011Q2 2011Q4 2012Q2 2012Q4
Northern Ireland UK Ireland
0.0% 0.5% 1.0% 1.5% 2.0% 3.0% 3.5% 2002/2003 2006/2007 2010/2011
Adults 15-64 years Young Adult 15-34 2.5%
% of TIRSP (Retail Selling Price) % of WAP (Weighted Average Price)
0 20 40 60 80 100 29 1 17 7 45 2006 73 11 8 2 6 2008 78 5 2 6 10 2009 70 5 3 5 18 2010 64 6 4 6 19 2011 61 6 6 10 17 2012 Poland Romania Hungary Lithuania Other countries
54 5 10 30 2007 1 0% 2% 4% 6% 8% 10% 12% 14% 16% 18% 20% 25% Derry
Fermanagh Tyrone Down Armagh Antrim
Bn Int. $
% of total packs collected
% of total packs collected
•
Unemployment is high. Ireland ranks 3rd among the OECD countries, with an unemployment rate of 14.6% in 2011 (OECD 2012a). In January 2013, the rate was 14.6%, and the figure was stable after January 2012 (14.9%) (Central Statistics Office 2013c). In May 2013, the standardised unemployed rate was 13.7%, slightly changed from the revised February 2013 rate (14.0) (Central Statistics Office 2013e). Forecasts for 2013 are negative, estimating that the unemployment rate will reach 15% (Percival 2013).•
The decline in labour–market participation mainly affects young people with low qualifications (OECD 2011, 21). It has especially affected the public, financial and construction sectors (IBEC 2012b). This may result in persistent underemployment, as occurred between the mid–1970s and the mid–1990s, with risks of social conflict (OECD 2011, 21).•
Domestic demand also fell in 2011. Investments decreased by 10.6%, personal consumption by 2.7%, and government spending by 3.7%. The situation is now better than in the previous years, thanks to the growth of exports and employment (Department of Finance 2012c).••
Ireland became a consumer society after the economic boom in the 1990s. Recent economic difficulties have slightly affected consumption.•
Household final consumption expenditure increaseduntil 2007; it then slightly decreased in 2008–2009, with a new increase in 2010 (Figure 6) (The World Bank 2012).
•
According to the latest Household Budget Survey – carried out between August 2009 and September 2010 – average weekly household expenditure increased from €787 in 2005 to €811 in 2010 (+3%) (Central Statistics Office 2012a, 7).•
In 2009–2010 housing (rent and mortgage) accounted for 18.2%, up by 56% since 2004–2005. Food expenditure decreased by 8% (from 18.1% in 2004–2005 to 16.2% in 2009–2010). Expenditure on fuel and light increased by 15.3% as a result of the rising prices of energy. The worst decrease (16.3%) was in the consumption of alcoholic drink and tobacco (respectively 6.0% and 4.9%) (Central Statistics Office 2012a, 16).•
Urban households spend more than rural households as a result of their higher expenditure on rents and mortgages in urban locations (Central Statistics Office 2012a, 15).•
Households at risk of poverty spend more on housing than those not at risk (19.5% compared with 18.1%), food (19.3% compared with 15.8%), fuel and light (5.9% compared with 4.2%) (Central Statistics Office 2012a, 15).••
According to the last Household Budget Survey, expenditure on cigarettes and alcohol dropped by more than 16% between 2005 and 2010 (below €40 per week).•
Weekly expenditure on tobacco increased from €12.19 in 2004–2005 to €13.09 in 2009–2010. Instead, alcohol expenditure decreased from €34.99 to €26.40 per week (Central Statistics Office 2012a, 7).•
In 2010, there were differences in alcoholic drink and tobacco expenditure between urban and rural areas. Urban households spent €42.15 per week on tobacco and alcoholic drink (5.1% of the total expenditure), rural households €34.98 per week (4.5% of the total expenditure) (Central Statistics Office 2012a, 15). Households at risk of poverty spent more than those not at risk on alcoholic drink and tobacco (6.3% compared with 4.7%) (Central Statistics Office 2012a, 30).23
The factbook on the illicit trade in tobacco products
IRELAND
••
Ireland envisages cuts to the social welfare system.•
Scholars classify the Irish welfare system between the liberal and corporatist models (Payne and McCashin 2005, 16).•
To reduce the budget deficit to below the 3% of GDP by 2015, the government envisages cuts to public sector wages, social welfare, and capital spending (OECD 2011, 14).•
In OECD countries, average health spending accounted for 9.5% of GDP in 2010, while in Ireland it was slightly less (9.2%). However, between 2007 and 2009, health spending in Ireland rose from 7.8% to 9.9% of GDP (OECD 2012b).•
Health spending in Ireland increased between 2000and 2009 at a rapid rate of 8.4% per year in real terms on average, but it decreased by 7.6% in 2010 owing to a sharp reduction in public spending on health as part of government–wide efforts to reduce the large budgetary deficit.
•
Ireland ranked 15th out of 157 countries in 2010 foreducation expenditure (5.6% of GDP in 2010). This shows that Ireland has a high interest in education system (The World Bank 2012).
•
In 2009, life expectancy in Ireland was 81 years, better than OECD countries average (79.8 years), but lower than in other countries, such as Japan, Switzerland, Italy and Spain (82 years) (OECD 2012b; UNDP 2013).Figure 7. Composition of total public spending (estimates), 2011
Source: Transcrime elaboration on Department of Public Expenditure and Reform (2011) data 0% 5% 10% 15% 20% 25% 30% 35% 00 01 02 03 04 05 06 07 08 09 10 11 12 Euromonitor International ITMAC Flows Model Revenue KPMG
Empty Pack Surveys
JTI 0 2 4 6 8 10 12 0 50 100 150 200 250 2006 2007 2008 2009 2010 2011 2012
Cigarettes (million sticks) HRT (tonnes) 0 10 20 30 40 50 60 70 80 90 96 97 98 99 00 01 02 03 04 05 06 07 08 09 10 11 36.1% 25.3% 15.6% 11.1% 4.2%
3.7%2.4% 1.6% Social & Family Affairs Health & Children Education & Science General Governement Service
Justice, Equality & Law Reform Transport Finance Defence 0 1,000 2,000 3,000 4,000 5,000 6,000 7,000 8,000 9,000
Production Import Export Sales
Ci gar et te s (m n st ic ks ) 98 99 00 01 02 03 04 05 06 07 08 09 10 11 12 0 50 100 150 200 250 300 350 400 2006 2007 2008 2009 2010 2011 2012 91.6% 6.8% 1.6% Cigarettes HRT Cigars 0% 5% 10% 15% 20% 25% 30% 35% 2006 2007 2008 2009 2010 2011 2012 Female Male 72% 74% 76% 78% 80% 82% 84% 86%
Apr July Nov
2002
Aug
2003 2004 2005
Jan July
2007
July Jan July
2009 July 2010 July 2011 July 2012 July 2013 2001
Apr Dec May July
2006
Jan
2008
Jan Jan March Jan Jan 0.0
0.2 0.4 0.6 0.8 1.0 1.2 1.4 1.6 1.8 2.0 95 96 97 98 99 00 01 02 03 04 05 06 07 08 09 10 0% 1% 2% 3% 4% 5% 6% 7%
Opioids Cocaine Cannabis
0% 2% 4% 6% 8% 10% 12% 2002/2003 2006/2007 2010/2011
Adults 15-64 years Young Adult 15-34
0% 1% 2% 3% 4% 5% 6% 7% Q4 2010 2011Q2 2011Q4 2012Q2 2012Q4 0.05% 0.10% 0.15% 0.20% 0.25% 0.35% 0.40% 0.45% Q4 2010 2011Q2 2011Q4 2012Q2 2012Q4 0.30% 0.00% 0% 5% 10% 15% 20% 25% 30% 35% 40% Clare Cork Done gal Dublin Du n-Laogh aire Fingal Galw ay Kerry Kildare Limeric k
Louth Meath Sligo South Dublin South Tippe rary Waterf ord Westm eath Wexfo rd Wicklo w Q2–2012 Q4–2012 0% 5% 10% 15% 20% 25% 30% 35% Q4 2010 2011Q2 2011Q4 2012Q2 2012Q4
Northern Ireland UK Ireland
0.0% 0.5% 1.0% 1.5% 2.0% 3.0% 3.5% 2002/2003 2006/2007 2010/2011
Adults 15-64 years Young Adult 15-34 2.5%
% of TIRSP (Retail Selling Price) % of WAP (Weighted Average Price)
0 20 40 60 80 100 29 1 17 7 45 2006 73 11 8 2 6 2008 78 5 2 6 10 2009 70 5 3 5 18 2010 64 6 4 6 19 2011 61 6 6 10 17 2012 Poland Romania Hungary Lithuania Other countries
54 5 10 30 2007 1 0% 2% 4% 6% 8% 10% 12% 14% 16% 18% 20% 25% Derry
Fermanagh Tyrone Down Armagh Antrim
Bn Int. $
% of total packs collected
% of total packs collected
•
Estimates for public spending in Ireland in 2011 concentrated on social protection (36.1%), health and children (25.3%), and education and science (15.6%) (Figure 7) (Department of Public Expenditure and Reform 2011).••
Ireland has recently become a multicultural society.•
Ireland has 4.5 millions inhabitants and amedium–high percentage of adult population (78.7%). It ranked 65th out of 193 countries in 2011 (The World Bank 2012).