O R I G I N A L A R T I C L E
Fine Tuning of Synaptic Plasticity and Filtering by GABA
Released from Hippocampal Autaptic Granule Cells
Pierluigi Valente
1,2
, Marta Orlando
1
, Andrea Raimondi
1
, Fabio Benfenati
1,2
,
and Pietro Baldelli
1,2
1
Department of Neuroscience and Brain Technologies, Istituto Italiano di Tecnologia, Genova 16163, Italy, and
2Department of Experimental Medicine, Section of Physiology, University of Genova, Genova 16132, Italy
Address correspondence to Pietro Baldelli, Department of Experimental Medicine, School of Medicine and Pharmacy, University of Genova, Viale Benedetto XV 3, Genova 16132, Italy. Email: [email protected]Abstract
The functional consequence of γ-aminobutyric acid (GABA) release at mossy fiber terminals is still a debated topic. Here, we provide multiple evidence of GABA release in cultured autaptic hippocampal granule cells. In∼50% of the excitatory autaptic neurons, GABA, VGAT, or GAD67 colocalized with vesicular glutamate transporter 1-positive puncta, where both GABABand
GABAAreceptors (Rs) were present. Patch-clamp recordings showed a clear enhancement of autaptic excitatory postsynaptic
currents in response to the application of the GABABR antagonist CGP58845 only in neurons positive to the selective granule cell
marker Prox1, and expressing low levels of GAD67. Indeed, GCP non-responsive excitatory autaptic neurons were both Prox1-and GAD67-negative. Although the amount of released GABA was not sufficient to activate functional postsynaptic GABAARs,
it effectively activated presynaptic GABABRs that maintain a tonic “brake” on the probability of release and on the size of the
readily releasable pool and contributed to resting potential hyperpolarization possibly through extrasynaptic GABAAR
activation. The autocrine inhibition exerted by GABABRs on glutamate release enhanced both paired-pulse facilitation and
post-tetanic potentiation. Such GABABR-mediated changes in short-term plasticity confer to immature granule cells the capability to
modulate their filtering properties in an activity-dependent fashion, with remarkable consequences on the dynamic behavior of neural circuits.
Key words: GABABreceptors, GABA-glutamate corelease, granule cells, short-term plasticity, synaptic filtering
Introduction
The notion that neurons can release more than 1 transmitter, initially proposed by the pioneering work of Thomas Hökfelt (Hökfelt et al. 1980), is now widely accepted. Neuropeptides stored in large dense-core vesicles are frequently colocalized and coreleased by monoaminergic, cholinergic, and GABAergic neurons (seeHnasko and Edwards 2012for review). However, for many years, it has generally been assumed that neurons could release only one of the classical neurotransmitters (NTs), such as glutamate or γ-aminobutyric acid (GABA), which mediate the vast majority of excitatory and inhibitory transmission in the brain. Thus, while glutamatergic and GABAergic synaptic vesicles
(SVs) share H+-ATPase (Forgac 2007), they express distinct
vesicu-lar NT transporters such as vesicuvesicu-lar glutamate transporters (VGLUT) 1, 2, and 3 and vesicular GABA transporter (VGAT) (Edwards 2007;Grønborg et al. 2010).
In the last years, an increasing amount of experimental evi-dence has demonstrated an abundant coexpression of VGLUT1 and VGAT in retina bipolar cells as well as in cortical and hippo-campal glutamatergic synapses (Kao et al. 2004;Fattorini et al. 2009;Zander et al. 2010). Moreover, electrophysiological studies suggested that GABA is coreleased from glutamatergic hippo-campal mossy fiber terminals (MFTs) during postnatal develop-ment (Walker et al. 2001;Gutiérrez 2003;Safiulina et al. 2006) or
© The Author 2014. Published by Oxford University Press. All rights reserved. For Permissions, please e-mail: [email protected] Cerebral Cortex, 2015, 1–19
doi: 10.1093/cercor/bhu301 Original Article
1
in the adult after induction of hyperexcitability (Gutiérrez 2000;
Gutiérrez and Heinemann 2001;Gómez-Lira et al. 2002; Romo-Parra et al. 2003;Treviño and Gutiérrez 2005). Although initially argued (Uchigashima et al. 2007), the growing and convincing ex-perimental evidence (Safiulina et al. 2006; for review, seeGutiérrez 2009;Beltrán and Gutiérrez 2012;Cabezas et al. 2012) strengthened considerably the notion of GABA corelease at MFs. Previous data have shown that GABA, coreleased at these glutamatergic synap-ses, mainly activates postsynaptic (Gutiérrez 2003;Safiulina et al. 2006) and presynaptic (Ruiz et al. 2003) ionotropic type A GABA receptors (GABAARs). More recently, GABA release at immature
MF–CA3 connections was shown not only to evoke inhibitory post-synaptic currents (IPSCs) but also to negatively modulate the prob-ability of GABA release at MFTs (Safiulina and Cherubini 2009) via the activation of presynaptic G-protein-coupled type B GABA receptors (GABABRs). Interestingly, presynaptic GABAB
autorecep-tors activated by GABA released from granule cells (GCs) modulate MFs excitability by transiently reducing the probability of evoked antidromic spikes (Cabezas et al. 2012). This suggests that GABA release from GCs primarily affects the presynaptic rather than the postsynaptic cellular element.
Here, we show that, in cultured hippocampal autaptic neu-rons, only GCs expressing glutamic acid decarboxylase-67 (GAD67) show presynaptic GABABRs that negatively modulate
ex-citatory postsynaptic current (EPSC) amplitude and tonically ac-tivated extrasynaptic GABAARs contributing to membrane
hyperpolarization under resting conditions. Although these glu-tamatergic autapses also express functional synaptic GABAARs,
we never observed any GABAAR-mediated phasic IPSC. We
found that GABA coreleased by cultured autaptic GCs specifically activates presynaptic GABABRs that reduce the probability of
re-lease (Pr) and the readily releasable pool (RRP) size of EPSCs and thus affecting synaptic facilitation, depression, and post-tetanic potentiation (PTP).
Our results suggest that, in addition to its putative role in the functional maturation of adult neuronal circuits (Safiulina and Cherubini 2009;Safiulina et al. 2010) and in preventing excessive postsynaptic depolarization at glutamatergic synapses (Gutiérrez and Heinemann 2001), GABA corelease may also represent an autocrine mechanism to fine-tune the filtering properties of GCs excitatory synapses through a modulation of their short-term plasticity properties.
Results
Inhibitory Markers Are Expressed in a Broad Population of Autaptic Glutamatergic Neurons
Primary cultures of hippocampal autaptic neurons offer the fun-damental advantage of recording synaptic currents from isolated neurons, thus activating a defined and homogeneous population of synapses. More importantly, due to the extremely low cell density, they permit to precisely control the extracellular me-dium surrounding the cell under study (Bekkers and Stevens 1991;Chiappalone et al. 2009), thus avoiding paracrine effects ex-erted by NTs or other neuromodulators released by neighboring neurons.
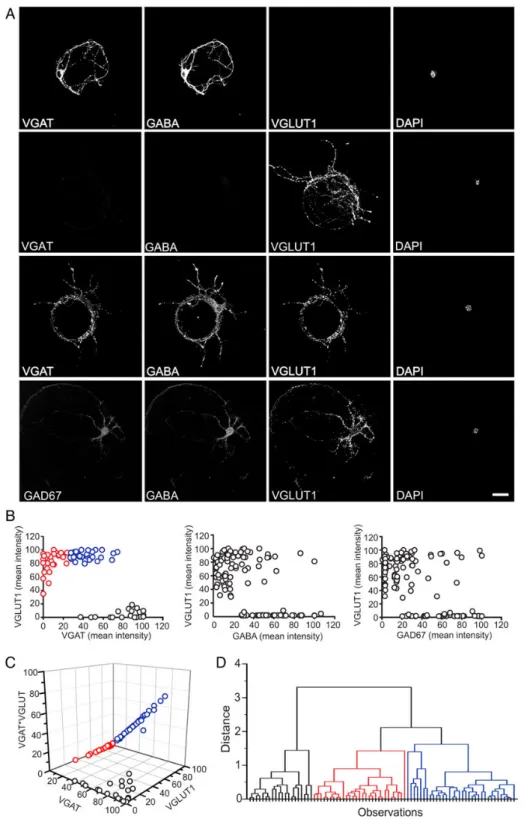
Given that the type of NT transporters expressed on SVs (Grønborg et al. 2010) defines the nature of glutamatergic and GABAergic synapses, cultured autaptic neurons (10–15 days in vitro, div) were triple-immunostained for either VGLUT1, VGAT, and GABA or for VGLUT1, GABA, and GAD67 (Fig.1). On the basis of these experiments, it was possible to identify: 1) pure inhibitory neurons that were immunopositive for VGAT
and GABA, but not for VGLUT1 (Fig.1A, first row); 2) pure excita-tory neurons that were positive for VGLUT1, but not for either VGAT or GABA (Fig.1A, second row) or GABA and GAD67 (not shown); and 3) VGLUT1-positive neurons that also expressed de-tectable amounts of either GABA and VGAT (Fig.1A, third row) or GABA and GAD67 (Fig.1A, fourth row).
When the VGLUT1 expression levels of individual autaptic neurons were plotted against those of VGAT, GABA, or GAD67 (Fig.1B), 2 distinct populations of neurons could be clearly distin-guished, namely 1) autaptic cells characterized by high levels of VGAT, GABA, or GAD67 and the absence (or very low levels) of VGLUT1 (bona fide pure GABAergic neurons) and 2) autaptic cells expressing high or moderate levels of VGLUT1 in parallel with very heterogeneous levels of GABAergic markers, ranging from absence/very low levels (bona fide pure glutamatergic neu-rons) to medium/high levels. To quantitatively distinguish the latter subpopulation from the other ones, we calculated the prod-uct VGLUT1*VGAT (that is enhanced in neurons positive for both markers) and studied the three-dimensional distribution of VGLUT1 and VGAT levels versus VGLUT1*VGAT (Fig.1C, left). Cluster analysis subsequently applied to the three-dimensional representation separated the third cellular population of autaptic cells coexpressing VGLUT1 together with VGAT (blue symbols; 41% of total neurons) from the populations of pure glutamatergic neurons (red symbols; 35% of total neurons) and pure GABAergic neurons (black symbols; 24% of total neurons), respectively (Fig.1D). This analysis confirms that a consistent fraction of hip-pocampal excitatory neurons is potentially able to synthesize and possibly corelease GABA.
The colocalization of VGLUT1 with VGAT or GABA was studied at the level of single synaptic contacts in autaptic glutamatergic neurons (Fig.2A). The frequency distribution of the immunos-tained synaptic boutons revealed a high level of colocalization of VGLUT1-positive pixels with VGAT-positive ones (Pearson’s coefficient 0.70 ± 0.01, n = 110; Fig.2B, left). As expected from the more widespread distribution of GABA, the colocalization between VGLUT1 and GABA was slightly lower, as shown by the left-shift in the distribution histogram with respect to the VGAT/ VGLUT1 distribution (Pearson’s coefficient 0.54 ± 0.02, n = 66; Fig.2B, right).
Since many glutamatergic autaptic neurons were found to ex-press GABAergic markers, we next examined whether these cells also coexpress GABAARs and GABABRs. Neurons were
double-stained for VGLUT1 and either GABAAγ2Rs or GABABR1s
(Fig.2C). High magnification images of the dendritic trees re-vealed that both GABAAγ2Rs and GABABR1s are expressed at
exci-tatory synaptic terminals and strongly colocalize with VGLUT1 in the majority of excitatory neurons (Fig.2C), with high levels of the Pearson’s coefficient for the GABAAR/VGLUT1 colocalization
(0.66 ± 0.14, n = 133; Fig.2D, left) and GABABR/VGLUT1
colocaliza-tion (0.73 ± 0.01, n = 147; Fig.2D, right). These data demonstrate that many glutamatergic synapses are fully equipped with GABAAand GABABRs.
GABA Release at Glutamatergic Autaptic GCs Modulates the Strength of Excitatory Synaptic Currents by Activating Presynaptic GABABRs
We then recorded synaptic currents by whole-cell patch-clamp of autaptic neurons obtained from a strain of glutamic acid decarb-oxylase-green fluorescence protein (GAD67-GFP) knock-in mouse (Tamamaki et al. 2003). The use of these mice offered us the op-portunity to identify the expression levels of GAD67 in cultured live neurons before patch-clamp recordings. By this approach,
Figure 1. Coexistence of excitatory and inhibitory markers in a broad population of autaptic neurons. (A) Representative confocal fluorescence microscopy images of autaptic neurons stained for VGAT, GAD67, GABA, and VGLUT1. From top row to bottom row: an inhibitory autaptic neuron immunonegative for VGLUT1, but positive for VGAT and GABA; an excitatory autaptic neuron immunopositive VGLUT1, but negative for VGAT and GABA; an excitatory autaptic neuron positive for VGLUT1, but also for VGAT and GABA; an excitatory autaptic neuron positive for VGLUT1, but also for GABA and GAD67. Scale bar, 25 μm. (B) Distribution of the staining intensities of VGLUT1 versus VGAT, vGLUT1 versus GABA, and VGLUT1 versus GAD67 in the population of autaptic neurons analyzed (each circle represents an individual neuron; n = 82, n = 122, and n = 118 for VGLUT1 versus VGAT, vGLUT1 versus GABA, and VGLUT1 versus GAD67 respectively). The population of inhibitory neurons almost exclusively expressing VGAT, GABA, or GAD67 showed the lowest level of VGLUT1 intensity; pure excitatory neurons almost exclusively expressing VGLUT1 showed low levels of VGAT, GABA, or GAD67 and a consistent percentage of VGLUT1-positive autaptic neurons was also positive for VGAT, GABA, and GAD67. Colors in the left panel refer to the results of the cluster analysis of Panel D. (C) Three-dimensional representation of VGLUT1 versus VGAT versus VGLUT1*VGAT from the data presented in B. (D) Tree diagram (dendrogram) showing the arrangement in 3 clusters generated by hierarchical cluster analysis applied to the data reported in C (cluster method: group average; distance type: Euclidean).
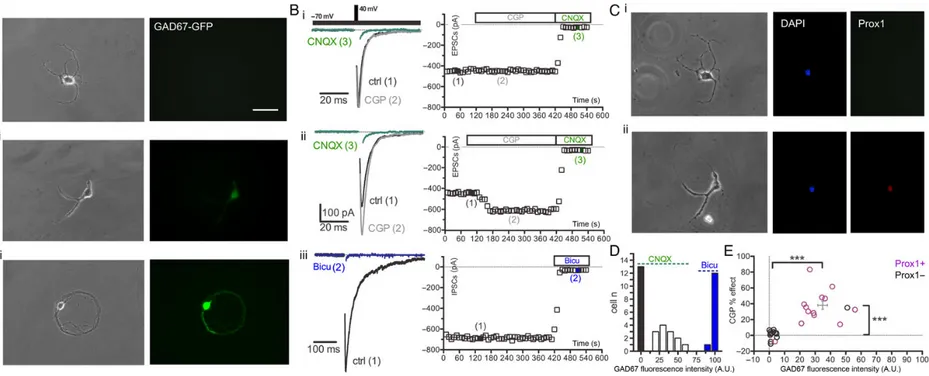
an equal number of cells (13), visually identified as negative, moderately and highly positive to GAD67, have been imaged (Fig.3Ai–iii images on the left) and successively patch-clamped to analyze their postsynaptic responses. Autaptic neurons were held at−70 mV, and their electrophysiological phenotypes were identified by using specific blockers of excitatory (CNQX, 20 μ) and inhibitory (bicuculline, 30 μ) transmission. We tested the effect of the selective GABABR antagonist CGP55845 (CGP 5 μ)
on the EPSC amplitude in excitatory autaptic neurons. Each exci-tatory autaptic neuron was stimulated at 0.1 Hz with a paired-pulse stimulation (inter event interval 50 ms) for over 2 min to obtain a stable baseline before CGP was applied. A first group of autaptic neurons (n = 13), chosen for their high positivity to GAD67-GFP, (Fig.3Aiii, left images) showed slow decaying of post-synaptic currents (PSCs) that were rapidly and completely blocked by bicuculline (Fig.3Biii). A second group of autaptic cells (n = 13) completely negative to GAD67-GFP (Fig.3Ai, left images) showed fast decaying PSCs that were fully blocked by CNQX and did not respond to the application of the selective GABABR antagonist CGP (Fig.3Bi). On the contrary, a third class
of cells (n = 13) characterized by a moderate expression of GAD67-GFP (Fig.3Aii, left images) showed fast decaying glutama-tergic PSCs that were fully blocked by CNQX and were significant-ly enhanced (from 288.3 ± 50.94 to 382.9 ± 68.4 pA, n = 13; P < 0.001) by CGP application (Fig.3Bii). The CGP effect on the EPSC ampli-tude had a rapid progression, reaching a current steady state after less than 1 min of treatment (Fig.3Bii).
Each patched excitatory neuron was retrospectively analyzed for the expression of Prox1, the selective marker that defines GCs identity (Iwano et al. 2012). The totality (13 of 13) of the GAD67-GFP-negative cells were CGP non-responsive, and 12 of 13 were Prox1 negative (Fig.3E). On the contrary, all the cells (13 of 13) se-lected for their moderate positivity to GAD67-GFP were all CGP-responsive and 12 of 13 were Prox1 positive (Fig.3E).
To further confirm that GABA corelease is present only in au-taptic GCs, we also tested the effects of the group II metabotropic glutamate receptor agonist, DCG-IV, in excitatory autaptic cells responsive and non-responsive to CGP treatment. In full agree-ment with previous results showing that DCG-IV (1 μ) can be used to identify MFs making synapses with CA3 neurons (Kamiya et al. 1996;Beltrán and Gutiérrez 2012), we observed that in CGP-responsive excitatory neurons, DCG-IV inhibited the EPSC, while it was ineffective in CGP non-responsive cells (Supplementary Fig. 1).
These data show that the majority of cultured autaptic GCs diffusely express GAD67 and corelease GABA that modulates the amplitude of EPSC through the activation of GABABRs.
Inter-estingly, in juvenile mice (p15), GAD67 resulted to be expressed only in a subpopulation of immature GCs (Cabezas et al. 2012), a discrepancy due to higher level of immaturity of the autaptic GCs obtained from mice embryos (E18). Indeed, the Ca2+-binding
protein calretinin, a transient marker of the early postmitotic period that characterizes immature GCs (Kempermann et al. 2004), was found in 96.8 ± 2.1 and 96.1 ± 2.9% of the GCs expres-sing GAD67 in cultured autaptic neurons and low-density neu-rons, respectively (Supplementary Fig. 2).
Considering the surprisingly high percentage of autaptic GCs that we found under our experimental condition, we compared neuronal-identity in low density and autaptic hippocampal neu-rons (14–16 div). The percentage of Prox1-positive neuneu-rons was significantly lower (∼12%) in low-density cultures than that in au-taptic neurons (∼41%) (Supplementary Fig. 3). Such difference suggests that primary cultures of autaptic hippocampal neurons represent an experimental substrate able to favor the in vitro Figure 2. Colocalization of VGLUT1 with inhibitory synaptic markers and
GABARs in excitatory autapses. (A) Representative images of autaptic contacts positive for VGLUT1 and either VGAT (left panels) or GABA (right panels). The bottom row displays the merge of the VGAT/VGLUT1 or GABA/VGLUT1 channels (scale bar, 10 μm). (B) The histograms show the distribution of the Pearson’s correlation coefficient values for VGLUT1 and VGAT (left) and VGLUT1 and GABA (right) with respect to the percentage of synaptic puncta analyzed in glutamatergic autaptic neurons. The median value is shown as a red line (0.709 for VGAT/VGLUT1 and 0.5605 for GABA/VGLUT1). (C) Representative images of excitatory autaptic neurons immunopositive for VGLUT1 and either GABAAγ2 (left) or GABABR1 (right). Scale bar, 25 μm. (D)
Higher magnification of VGLUT1-positive autaptic contacts colocalizing with either GABAAγ2 (left) or GABABR1 (right). Scale bar, 10 μm. (C) The histograms
show the distribution of the Pearson’s correlation coefficient values for VGLUT1 and GABAAγ2 (left) and VGLUT1and GABABR1(right) with respect to
the percentage of synaptic puncta analyzed in glutamatergic autaptic neurons. The median value is shown as a red line (0.696 for GABAAγ2/VGLUT1
Figure 3. Autaptic GCs expressing GAD67 show tonic inhibition of EPSCs by presynaptic GABABRs. (Ai–iii) Representative phase-contrast (left) and fluorescent images (right) of cultured (14 div) autaptic neurons obtained from
GAD67-GFP knock-in mouse (scale bar, 70 μm). (Bi–iii) Autaptic neurons with different levels of fluorescence were patch-clamped to evoke PSCs that were pharmacologically characterized. The Vh was −70 mV, and the neuron was stimulated with a voltage step to +40 mV lasting 0.5 ms, at a stimulation frequency 0.1 Hz. Representative traces for each tested condition are shown with increasing numbers. Three classes of autaptic neurons were identified based on the GAD67-GFP fluorescence level and the response of PSCs to CNQX, CGP and bicuculline: (Ai,Bi) GAD67-GAD67-GFP-negative neurons, whose PSCs were insensitive to CGP and fully blocked by CNQX; (Aii,Bii) neurons moderately positive to GAD67-GAD67-GFP, whose PSCs were enhanced by CGP and fully blocked by CNQX; and (Aiii,Biii) neurons strongly positive for GAD67, whose PSCs were blocked by bicuculline. For each condition studied, the time course of recordings was recorded (right panels). (Ci,ii) Retrospective immunocytochemistry for DAPI and Prox1, a specific nuclear marker for GCs, were performed on non-responsive (Ci) and CGP-responsive excitatory neurons (Cii). To recognize previously patch-clamped neurons, we marked the bottom of the recording chamber just below the neuron with a diamond tip. (D) Distribution histogram of the GAD67-GFP fluorescent intensity for the three subpopulations of autaptic neurons visually selected for their different GAD67-GFP intensity. (E) Correlation between GAD67-GFP fluorescence intensity and the percent effect of CGP on the EPSC amplitude in Prox1-positive (purple; n = 13) and -negative (black; n = 13) excitatory autaptic neurons. Each empty dot represents a single cell (Student’s unpaired two-tailed t-test, ***P < 0.001).
Glutama te-GABA C or elease in Hippocampal Autapti c Gr anule C ells Va le nte et al. | 5
viability of GCs over other cell-types, thus over increasing their relative abundance.
Characterization of the GABABR-Mediated Effects of Coreleased GABA on GC Excitatory Synaptic Currents Characterization of the GABABR-Mediated Modulation of GC EPSCs
due to GABA Corelease
The modulatory action of GABABRs on EPSCs was quantitatively
dissected in the presence of the selective GABAAR antagonist
bi-cuculline to identify glutamatergic autaptic neurons and avoid any possible contribution of GABAAR signaling. Under these
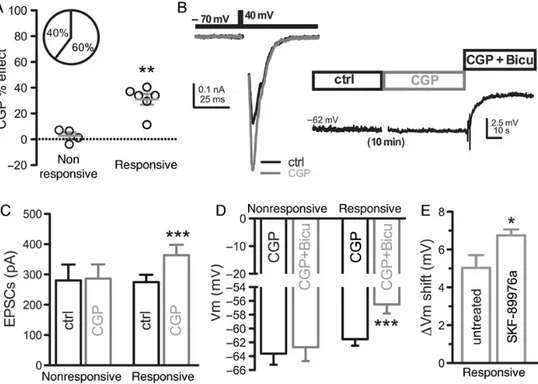
con-ditions, over 60% of the glutamatergic autaptic cells (Fig.4A; n = 72, 46 positives, 26 negatives) displayed∼40% increase of evoked EPSC amplitude in response to CGP (from 242.8 ± 42.4 to 358.4 ± 62.8 pA, n = 11; P < 0.01; Fig. 4B). The application of paired-pulse stimulation (0.1 Hz, interpulse interval 50 ms; Fig.4C) to CGP-responsive neurons allowed us to investigate the mechanism of EPSC inhibition by GABABRs. The treatment with
CGP induced a decrease in the paired-pulse ratio (from 2.13 ± 0.16 to 1.49 ± 0.1, n = 18; P < 0.01; Fig.4D) which indicates the presynaptic origin of the EPSC enhancement by CGP (Figurov et al. 1996;Gottschalk et al. 1998) and suggests the existence of a presynaptic autocrine inhibition of excitatory terminals coreleas-ing GABA by GABA-activated presynaptic GABABRs. To estimate
the magnitude of the physiological effect of GABA corelease on the EPSC amplitude, we maximally stimulated presynaptic GABABRs at excitatory autapses with acute bath application of
exogenous GABA (50 μ) or of the potent and selective GABABRs
agonist baclofen (20 μ) (Fig.4E, left and middle traces). Both GABA and baclofen markedly reduced the EPSC amplitude by
approximately 60% (57 ± 8%, n = 12 and 58 ± 7%, n = 13 for GABA and baclofen, respectively; Fig.4F). On the other hand, the application of CGP on autaptic neurons chronically treated with GABA (1 μ) almost doubled the EPSC amplitude (120 ± 22%, n = 11; Fig.4E, right trace; Fig.4F). The comparison of the latter re-sult with the∼40% increase of the EPSC amplitude induced by the application of CGP under basal conditions demonstrates that the presynaptic inhibition exerted by GABA release in autaptic GCs represents about one-third of the maximal inhibition reached by full activation of presynaptic GABABRs.
To exclude the involvement of presynaptic metabotropic glu-tamatergic receptors in the inhibition of EPSC by GABABRs, we
re-evaluated the CGP effect on the EPSC in the presence of selective antagonists for A1-adenosine receptors (A1Rs) and for the group II/III metabotropic glutamate receptors (mGluR2/3s) DPCPX (1 μ) and LY341495 (4 μ), respectively. When CGP was applied under these conditions, it was still able to induce a significant increase of the mean EPSC amplitude (+42.02%; P < 0.001) in∼60% of the tested glutamatergic neurons (Supplementary Fig. 4A,B) and a decrease in PPR (Supplementary Fig. 4C) that were closely similar to those previously observed in the absence of A1R/mGluR2/3 blockade.
GABA could be released synaptically or extra-synaptically by GCs. Indeed, although high-resolution immunogold cytochemis-try has shown that both GABA and glutamate are associated with SVs in the same MFTs (Bergersen et al. 2003), it was also reported that GABA can be released extra-synaptically in hippocampal neurons through the reverse action of GABA transporter 1, GAT-1 (Wu et al. 2007). Thus, we examined whether the enhance-ment of EPSC amplitude evoked by CGP was still present in the presence of the GAT-1 blocker, SKF (50 μ). The percentage of
Figure 4. GABA corelease modulates the strength of excitatory autapses through activation of presynaptic GABABRs. (A) Mean (± SEM) percentage increase in EPSC
amplitude triggered by CGP application (n = 72, 46 positive, 26 negative; Student’s unpaired two-tailed t-test, ***P < 0.001). Neurons displaying at least 10% enhancement of EPSC amplitude were considered CGP-responsive. In the inset, the percentages of responsive (black; 64.3%) and non-responsive (gray; 35.7%) to the CGP treatment are shown. (B) Effect of CGP on the mean (±SEM) EPSC amplitude. The superimposed symbols represent the mean EPSCs recorded in individual cells before (ctrl) and after CGP treatment (n = 11; Student’s paired two-tailed t-test, **P < 0.01). (C,D) Representative EPSC traces (C) and mean (±SEM) paired-pulse ratio; I2/I1;
(D) showing the effects of a paired-pulse stimulation protocol (interpulse interval 50 ms, 0.1 Hz) administered under control conditions (black trace/empty bar; n = 18) or in the presence of CGP (gray trace/bar; n = 18; Student’s paired two-tailed t-test, **P < 0.01). The AP artifact was blanked for clarity in all synaptic currents. (E) Representative traces showing that the application of GABA (50 μ; left traces) or baclofen (20 μ; middle traces) dramatically inhibits the amplitude of autaptic EPSCs. When CGP (5 μ) was applied on neurons maintained in the presence of GABA (1 μ; right traces), the increase of EPSC was particularly intense. (F) Bars represent the mean (±SEM) value of the EPSC amplitude calculated in neurons perfused with control medium and successively treated with GABA, baclofen, or CGP in the presence of GABA. The superimposed symbols represent the mean EPSC values of individual autaptic neurons recorded before and after 10 min of treatment (ctrl–ctrl2, n = 14; ctrl–GABA, n = 12; ctrl–Baclf, n = 13; GABA–CGP in GABA, n = 12; Student’s paired two-tailed t-test, **P < 0.01; ***P < 0.001).
CGP-responsive cells as well as the increase of the unitary EPSC and the effect on PPR induced by CGP application were virtually unaffected by SKF pretreatment, demonstrating that the reverse action of GAT-1 does not play a role in GABA release in autaptic GCs (Supplementary Fig. 5).
GABA Release in Autaptic GCs Did not Activate Postsynaptic GABABRs
We also studied whether GABA corelease at autaptic GCs could concomitantly activate postsynaptic GABABRs by evaluating
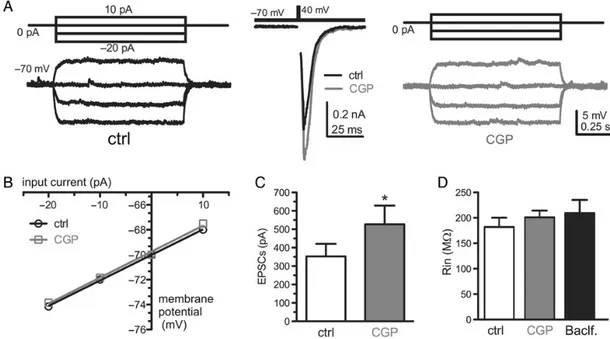
whether CGP application is able to change membrane input re-sistance (Rin) in those cells responding to CGP treatment with an increase of the EPSC amplitude. We injected hyperpolarizing current steps in current-clamp configuration from a holding po-tential (Vh) of−70 mV to precisely define the Rin under control conditions (Fig.5A, left traces). Then, we switched to a voltage-clamp configuration to evoke EPSCs in order to test the effect of CGP application (Fig. 5A, middle traces). For the neurons in which CGP increased the EPSC amplitude, we repeated the Rin measurement in the presence of CGP (Fig.5A, right traces). The Rin was calculated from the slope of the input current/membrane potential relationship (Fig.5B). We never observed a change of Rin due to GCP application in CGP-responsive cells (Fig.5C,D), dem-onstrating that CGP does not act on postsynaptic GABABRs.
Inter-estingly, in the same cells, also baclofen (20 μ) application did not affect Rin (Fig.5D). Such lack of function of the postsynaptic GABABRs is not surprising in cultured neurons obtained from
mouse embryos, as it was previously shown that while GABABRs
are widely distributed at pre- and post-synaptic sites ( López-Bendito et al. 2004), only the presynaptic Rs are functional at birth (Gaiarsa et al. 1995).
GABA Corelease Does not Activate GABAA-Mediated IPSCs
We next investigated whether GABA corelease was able to acti-vate postsynaptic GABAARs. In an autaptic cell, where CGP was
able to enhance EPSCs, the postsynaptic current was blocked by
CNQX (20 μ) (Fig.6A). Under this condition, the residual current was virtually absent and was not further reduced by the applica-tion of bicuculline (30 μ; Fig.6A). This result shows that autaptic glutamatergic synapses coreleasing GABA are postsynaptically silent with respect to GABAARs, although part of these synapses
express GABAAR clusters (see Fig.2C,D) that was previously
re-ported to be postsynaptically functional in newborn (Safiulina et al. 2006) and juvenile (Walker et al. 2001;Gutiérrez 2003) MFs-CA3 synapses. Excitatory autaptic neurons (Fig.6A), where EPSC was fully blocked by CNQX application (Fig.6B-I) and GABABRs inhibited by CGP, were perfused for 120 s with an
extra-cellular solution containing 40 m K+and 100 m GABA (Fig.6
B-II) and then washed for 30 s. This procedure induces GABA load-ing into SVs by endocytosis (Bekkers 2005). Indeed, when these neurons were electrically stimulated (60 s after the GABA-loading procedure), an evoked IPSCs (Fig.6B-III) fully blocked by bicucul-line application was apparent (Fig.6B-IV). This IPSC was charac-terized by activation and decay kinetics very similar to those of IPSCs evoked in autaptic inhibitory neurons (Supplementary Fig. 6). Moreover, after GABA loading, these excitatory autaptic neurons also showed spontaneous IPSCs blocked by bicuculline application (Fig.6C). Thus, GABA loading into SVs uncovers nor-mally silent GABAAR responses in glutamatergic autapses,
con-firming the expression of functional GABAARs observed by
immunolabeling studies (see Fig.2).
Then, we tested whether the GABABR inhibitory effect on
EPSCs was more effective in neurons whose GABA corelease was increased by the GABA-loading procedure. Indeed, the EPSC exhibited a 50% reduction after GABA loading and a subse-quent 2-fold increase when later exposed to CGP (Fig.6D,E). Both effects resembled the decrease of EPSCs observed after acute treatment with GABA or baclofen, and the CGP-triggered EPSCs increase during chronic GABA treatment, respectively (see Fig.4F). Then, the amplitude of the GABABR effect on EPSCs
was compared from the minimal inhibition uncovered by CGP
Figure 5. GABA release in excitatory autaptic GCs did not activate postsynaptic GABABRs. (A) Representative traces showing membrane voltage changes induced by
current-steps injection from a Vh of−70 mV before (black traces on the left) and after (gray traces on the right) GCP application, in a GCP-responsive neuron. In the middle panel, the effect of CGP on the EPSC amplitude is shown. (B) Relationship between the input current and the membrane voltage for the same cell shown in A. The Rin was obtained from the slope of the linear regression fitting the data points. (C) The bar graph shows the mean (±SEM) values of EPSC before and after CGP application (n = 6; Student’s paired two-tailed t-test, *P < 0.1). (D) The bar graph shows the mean (±SEM) values of Rin for the same CGP-responsive cells shown in panel C. The third bar shows the mean (±SEM) value of Rin of autaptic neurons treated with baclofen (20 μ; n = 6; one-way ANOVA followed by Bonferroni’s test).
under basal conditions (Fig.6F; right bar) to the maximal inhib-ition recorded when corelease had been previously boosted by GABA loading of SVs (Fig.6F; middle bar) or by direct activation
of GABABRs by acute administration of exogenous GABA
(Fig.6F; left bar). These results show that the basal inhibition ac-counts for approximately one-third of the maximal effect. Figure 6. Excitatory autapses express functional presynaptic GABAARs that are not activated by GABA corelease. (A) The neuron was stimulated with a voltage step to
+40 mV lasting 0.5 ms, at a stimulation frequency of 0.1 Hz (Vh =−70 mV). Left: the representative EPSC evoked in an autaptic CGP-responsive cell (recorded in the presence of 50 μ D-APV) was fully blocked by the application of CNQX (20 μ; black trace). The residual current was not affected by application of bicuculline (30 μ). Right: a detail at higher magnification of the residual EPSC after CNQX treatment insensitive to the successive application of bicuculline (30 μ). (B) (I) EPSC evoked in an autaptic neuron in the presence of CNQX, D-APV, and CGP. (II) The same neuron was loaded for 2 min with a solution containing 100 m GABA, 2 m CaCl2, and
40 m KCl. Note the large Cl−current due to GABAAR activation. (III) After GABA loading, the same neuron showed a PSC that was completely blocked (IV) by
bicuculline (30 μ). (C) Representative current traces showing spontaneous synaptic activity recorded (Vh =−70 mV) before (upper trace) and after GABA loading (middle trace). GABA loading induced the appearance of spontaneous IPSCs that were fully blocked by bicuculline (bottom trace). (D) Left: representative EPSCs recorded before and after GABA loading in the presence of bicuculline (Traces 1 and 2, respectively) and after addition of CGP (Trace 3). Right: representative time course of the recording described earlier. The neuron was stimulated with a voltage step to +40 mV lasting 0.5 ms, at a stimulation frequency of 0.1 Hz and with Vh =−70 mV. (E) Change in the mean (±SEM) EPSC amplitude before GABA loading, after GABA loading, and after GABA loading in the presence of CGP. The superimposed symbols represent the mean EPSCs recorded in individual cells (n = 7; Friedman test followed by Dunn’s multiple comparison test, *P < 0.05; **P < 0.01). (F) Mean (±SEM) percent increase in EPSC amplitude induced by CGP before GABA loading (n = 11), after GABA loading (n = 7), or under chronic GABA (1 μ; n = 11; one-way ANOVA followed by Bonferroni’s test, *P < 0.05; **P < 0.01). In all the plotted synaptic currents, stimulation artifacts were blanked for clarity.
Overall, the results indicate that GCs autapses express func-tional GABAARs. While the amounts of GABA coreleased at
gluta-matergic autapses are not sufficient to produce the activation of synaptic GABAARs under normal conditions, these GABA
con-centrations appear to be sufficient to activate presynaptic GABA
B-Rs and extrasynaptic GABAARs, which exhibit a 10-fold higher
affinity for GABA than GABAARs (Sodickson and Bean 1996).
GABA Release in Autaptic GCs Affects Their Resting Membrane Potential
The tonic inhibition of EPSC by presynaptic GABABRs suggests
that GABA corelease at GCs could also affect their resting mem-brane potential (Vrest). As it was well demonstrated that ambient GABA due to synaptic spillover is able to affect neuronal Vrest by activation of extra-synaptic GABAARs (Glykys and Mody 2007), we
compared the effect that bicuculline application exerts on the Vrest of CGP-responsive and non-responsive excitatory autaptic neurons (Fig.7A). Interestingly, we observed that all the CGP-responsive neurons also responded to bicuculline application with a depolarization of the Vrest (from −61.53 ± 0.95 mV to −56.50 ± 1.31 mV, n = 6; P < 0.001; Fig.7B–D). On the contrary, in those neurons where the EPSC was insensitive to CGP, the Vrest was not affected by bicuculline application (from−63.62 ± 1.59 to −62.69 ± 1.99 mV, n = 4; P = 0.34; Fig.7C,D). Although we demon-strated that a reverse action of GAT-1 is not involved in GABA cor-elease (seeSupplementary Fig. 5), we considered the possibility the GAT-1 blockade may increase the effect of coreleased GABA on Vrest in CGP-responsive neurons by increasing GABA spill-over. To this end, we compared the acute effect of bicuculline on the Vrest of untreated or SKF-89976a (SKF)-treated CGP-responsive cells. As expected, the blockade of GAT-1 activity by SKF (50 μ) induced a significantly larger voltage shift with
respect to untreated cells (from 5.033 ± 0.67, n = 6 to 6.75 ± 0.31 mV, n = 8; P < 0.05; Fig.7E). The latter result demonstrates that the modulation of Vrest by coreleased GABA is particularly sensi-tive to inhibition of GABA reuptake, while the activation of pre-synaptic GABABRs seems to be relatively independent of GAT-1
activity.
GABA Corelease Modulates the Quantal Properties of Release The main presynaptic factors controlling synaptic strength are the Pr and the size of the RRP of SVs (Zucker and Regehr 2002). Re-cent data obtained at the calix of Held synapse (Thanawala and Regehr 2013) showed that the inhibition of presynaptic Ca2+
in-flux through the activation of GABABRs reduced both Pr and the
synchronous RRP size (RRPsyn). To evaluate the effects of GABA
corelease on these parameters, we analyzed the cumulative amplitude profile during high-frequency stimulation (HFS: 40 Hz train for 1.5 s;Schneggenburger et al. 1999;Baldelli et al. 2005,2007;Medrihan et al. 2013) (Fig.8A). Although we noticed that CGP also increased the asynchronous component of release, we limited our analysis to the synchronous release, knowing that the RRPsyndetermined with this method is an underestimation of
the total RRP size composed of both synchronous and asynchron-ous pools of SVs (Moulder and Mennerick 2005;Stevens and Wil-liams 2007; but see alsoMedrihan et al. 2013).
To ensure the accuracy of our estimation of Pr and RRPsynsize
changes in CGP, the quantal size was determined in each CGP-responsive autaptic neuron before and 10 min after the applica-tion of CGP. No differences in the amplitude of mEPSCs that oc-curred either spontaneously or after a 0.25-s train at 50 Hz were found (10.00 ± 0.44 and 10.01 ± 0.40 pA before and after CGP, re-spectively, n = 8; P = 0.98; data not shown), testifying the substan-tial preservation of the quantal size.
Figure 7. GABA release at autaptic GCs activates extrasynaptic GABAARs that maintain the resting potential hyperpolarized. (A) In 6 of 10 autaptic cells, GCP increased the
amplitude of eEPSC. (B) Example of CGP-induced increase of the eEPSC amplitude. In the same cell, the application of bicuculline (30 μ) depolarized the Vrest measured in current-clamp configuration. (C) The bar graph represents the mean (±SEM) values of eEPSCs amplitude before and after CGP application in CGP non-responsive (n = 4) and responsive cells (n = 6, Student’s paired two-tailed t-test, ***P < 0.001). (D) The bar graph shows the mean (±SEM) Vrest values before and after bicuculline application in CGP non-responsive (n = 4) and responsive cells (n = 6, Student’s paired two-tailed t-test, ***P < 0.001). (E) The bar graph shows the mean (±SEM) Vrest shift induced by bicuculline in untreated (n = 6) and SKF-89976a-treated CGP-responsive cells (n = 8, Student’s unpaired two-tailed t-test, *P < 0.05).
During the trains, a significant depression of EPSCs became apparent and the cumulative profile of repeated EPSC amplitude showed a rapid rise followed by a slower linear increase of vari-ous steepness at later pulses (Fig.8A,B). Assuming that the slow linear rise is attributable to the equilibrium between the release-induced depletion and the constant replenishment of the RRP at a Pr approaching 1.0 during the train, the back-extrapolation of the linear portion to time 0 yields a rough estimation of the total release minus the total replenishment, corresponding to the size of RRPsyn(Schneggenburger et al. 1999). As shown in
Fig-ure 8C, RRPsynwas significantly increased by CGP treatment
(from 2173 ± 360 to 3019 ± 464 pA, n = 7; P < 0.05) to a similar extent
of the increase in amplitude of the first EPSC in the train (from 288 ± 58 to 415 ± 87 pA, n = 7; P < 0.01). The SV release probability Pr, calculated as the ratio between I1and RRPsyn(see Materials
and Methods), was also significantly increased by CGP (from 0.132 ± 0.01 to 0.158 ± 0.046, n = 7; P < 0.05; Fig.8C). Thus, the in-crease of EPSC amplitude, obtained by removing the tonic GABA
B-R-mediated inhibition exerted by GABA corelease, results from a combined increase in RRP size and Pr of synchronous release.
It has recently been reported (Cabezas et al. 2012) that GABABRs activation by endogenous GABA primarily affects
axonal MF excitability through modulation of G protein-coupled inwardly rectifying K+channels (GIRKs) in juvenile (P10–20)
Figure 8. GABA corelease alters quantal parameters of excitatory autapses through presynaptic GABABR activation. (A) Representative recordings of EPSCs evoked by a
short HFS (1.5 s at 40 Hz) under control conditions (black trace) and after 10 min of treatment with CGP (gray trace). Stimulation artifacts were blanked for clarity. (B) Cumulative amplitude profiles for a representative autaptic cell under control conditions (black symbols) and after CGP treatment (gray symbols). Data points in the range 0.5–1.5 s were fitted by linear regression and back-extrapolated to time 0 (dashed lines) to estimate the RRP size. (C) Bars represent the mean (±SEM) amplitude of the first EPSC in the train (EPSC1; left), RRPsynsize (center), and Pr (right) estimated under control conditions (black bars; n = 7) and after CGP treatment (gray bars;
n = 7). Symbols superimposed to the bars represent the parameters of individual neurons before and after the treatments (Student’s paired two-tailed t-test, *P < 0.05; **P < 0.01). (D) Comparison of the mean (±SEM) percent change of the first EPSC in the train (EPSC1; left), RRPsynsize (center), and Pr (right) induced by CGP in control
cells (same data shown in panel C) and in cells pretreated with tertiapin-Q (50 n), a blocker of GIRKs (n = 7; Student’s unpaired two-tailed t-test). (E) Representative current traces showing the first 13 EPSCs evoked during HFS under control conditions (black) and after application of CGP (gray). (F) Plots of normalized mean (±SEM) eEPSC amplitude versus time during repetitive stimulation (0.5 s at 40 Hz) of autaptic neurons before (black symbols; n = 7) and after (gray symbols; n = 6) CGP treatment. Bars represent the mean (±SEM) ratio of the averaged amplitude of the 11th, 12th, and 13th EPSCs, normalized to the first EPSC of the HFS under control conditions (black bars; n = 7) and after CGP treatment (gray bars; n = 7; Wilcoxon Matched-pairs test).
mice. To evaluate whether this process could play a role in the CGP effect on RRP size and Pr, we treated neurons with the high-affinity GIRKs antagonist tertiapin-Q (50 n). The CGP-in-duced enhancement of RRP size and Pr was not affected by the GIRK antagonist (Fig.8D), ruling out an involvement of GIRKs in this effect.
The dynamics of synaptic depression of glutamatergic au-tapses induced by a short (0.5 s) HFS (40 Hz) was also investi-gated. CGP-responsive autaptic GCs exposed to control medium showed a rapid increase in the EPSCs amplitude during the first 2 stimuli of the short train followed by a stepwise reduction to a steady state (Fig.8E,F). The time course of EPSC amplitude, nor-malized to the amplitude of the first stimulus of the train, re-vealed that CGP application abolished synaptic facilitation during the first part of the train. Moreover, CGP increased the syn-aptic depression calculated as the ratio between the average amplitude of the 11th, 12th, and 13th EPSCs normalized to the first EPSC of the HFS (Fig.8E,F). These results clearly demonstrate that, in autaptic GCs, a tonic activation of presynaptic GABABRs
due to GABA corelease increases facilitation and reduces depres-sion limiting SV depletion during HFS via a down-regulation of Pr and RRPsyn.
GABA Corelease Modulates Post-tetanic Potentiation at Glutamatergic Autapses through Presynaptic GABABRs Activation
Sustained synaptic activity, mimicked by a brief HFS, induces PTP of EPSCs in glutamatergic autaptic neurons. This form of short-term plasticity is contributed by an increase in Pr due to intra-terminal Ca2+buildup and a parallel increase in the RRP size
due to enhanced SV mobilization (Zucker and Regehr 2002;
Valente et al. 2012).
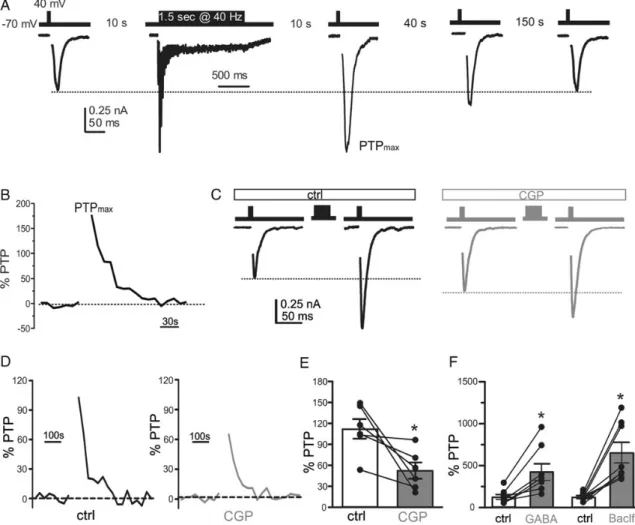
A short HFS (1.5 s at 40 Hz; Fig.9A) was administered, and a single-pulse stimulus was applied 10 s after the end of the train to estimate the maximal percent increase of EPSC amplitude with respect to the basal EPSC amplitude before the train (PTPmax).
Then, single-pulse stimuli were continuously applied at 0.1 Hz for 150 s to monitor the temporal decay of PTP and the return of EPSCs to the basal amplitude (Fig.9B). While CGP-responding autapses exposed to control medium showed a PTP of 100% (Fig.9C–E), they exhibited an impaired PTP with a potentiation of only about 60% when the same autaptic neurons were treated with CGP (Fig.9C–E). These results suggest that PTP in control me-dium is higher because the GABABR-mediated tonic inhibition
keeps the basal Pr and RRP size low. When such inhibition is re-moved by CGP, the pre-train Pr and RRP values increase and the
Figure 9. GABA corelease modulates PTP. (A) The experimental protocol used to investigate PTP was based on single stimuli applied at basal stimulation frequency (0.1 Hz) followed by a train of 1.5 s at 40 Hz, resumed, and repeated until the EPSC amplitude returned to the pre-train level. (B) The maximal PTP (PTPmax) was observed 10 s after
the train and the EPSC amplitude quickly recovered the baseline value within 150 s. (C,D) Representative traces (C) showing EPSCs before and after tetanic stimulation and time courses of PTP (D) for neurons incubated under either control (black) or CGP (gray) conditions. PTP was calculated as the percent increase in eEPSC amplitude with respect to the average EPSC amplitude before the train. (E,F) Bars (means±SEM) represent the amplitude of maximum PTP expressed as the percentage increase with respect to the mean baseline EPSC. Superimposed symbols show PTP changes observed in individual autaptic cells (n = 14 for all conditions; Student’s unpaired two-tailed t-test, **P < 0.01).
magnitude of PTP decreases. Thus, in cultured autaptic GCs, the presence of a tonic presynaptic GABABRs-mediated inhibition
due to GABA corelease modulates the expression of synaptic fa-cilitation, depression, and PTP by adjusting Pr and RRP size values.
Interestingly, PTP increased from≈100% to ≈400 or ≈600% when autaptic GCs under control conditions were stimulated with GABA (50 μ) or baclofen (20 μ), respectively (Fig. 9F). This result clearly confirms (see Fig.7F) that the level of activation of GABABRs, due to GABA corelease, is far from being saturated
and can be considerably increased during sustained tetanic stim-uli through the progressive buildup of coreleased GABA. Presynaptic GABABR Activity Dynamically Modulates the Strength
and Filtering Properties of Glutamatergic Synapses
Short-term plasticity is believed to have a central role in synaptic computation in neural circuits (Abbott and Regehr 2004). In this context, synapses can perform various types of temporal filtering operations by converting patterns of action potentials (APs) into distinct postsynaptic responses (Dittman et al. 2000). We have shown that GABABRs activation by coreleased GABA allows
au-taptic GCs to fine-tune the probability of glutamate release. To evaluate the consequences of this autocrine modulation on the dynamics and filtering properties of autapses, we elicited EPSCs by a short train of 13 stimuli administered at stimulation fre-quencies ranging between 0.01 and 50 Hz (Fig.10A).
The average amplitude of the last 3 EPSCs, normalized to the first EPSC of the train, was plotted as a function of the stimulus frequency both under control conditions and when GABABRs
were activated by baclofen or blocked by CGP (Fig.10B). Under control conditions, CGP-responding excitatory autapses did not show any depression at stimulation frequencies equal or below 0.1 Hz, whereas a clear depression appeared at higher frequen-cies that progressively increased with the frequency. Application of CGP significantly enhanced the steady-state depression (Fig.10B, upper panel; from 0.2 ± 0.02 to 0.1 ± 0.02 at 50 Hz, n = 10; P < 0.001), and baclofen greatly reduced it (Fig.10B, lower panel; from 0.21 ± 0.03 to 0.66 ± 0.1 at 50 Hz, n = 10; P < 0.001) at frequen-cies higher than 0.1 Hz. The data indicate that the stimulation of GABABRs by coreleased GABA (compare the EPSC ratio profiles
under control and CGP conditions) becomes clearly detectable at stimulation frequencies above 1 Hz. Considering that the max-imal presynaptic modulation exerted by GABABRs corresponds to
the difference between the EPSC ratio profiles in baclofen and CGP, the endogenous stimulation of GABABRs by coreleased
GABA accounts for a moderate, but significant, receptor occupancy.
To better understand the consequences of GABABR
modula-tion due to GABA corelease on the dynamic behavior of synaptic responses, EPSCs were recorded during a Poisson stimulation pattern, i.e., during an irregular stimulation train lasting 5 s with an average rate of 20 Hz (a detail of the Poisson stimulation lasting 1 s is shown in Fig.10C). Using a current threshold (It)
value corresponding to the 70% of the maximal EPSC amplitude evoked during the Poisson stimulation, we evaluated the theoret-ical probability of each EPSC to evoke an AP (i.e., the probability that an EPSC exceeds the It; Fig.10C). The probability to evoke
an AP observed under control conditions was markedly reduced during the high-frequency bursts and was followed by a clear re-covery at inter-spike intervals longer than a few hundreds of milliseconds (Fig.10D, black trace). As predicted, synapses fa-vored the transfer of APs from the presynaptic terminal to the postsynaptic side at low stimulation frequencies, whereas they blocked AP propagation at higher frequencies, working as a low
band-pass filter (Fig.10D, black trace). The AP probability in the high-frequency band was further reduced by CGP treatment due to its capability to enhance synaptic depression (Fig.10A–C, D, dark gray traces). This effect demonstrates that the complete removal of the GABABR inhibition exacerbates the low
band-pass filtering properties of excitatory synapses. On the contrary, baclofen, by reducing synaptic depression, favored the AP propa-gation at higher frequencies (Fig.10A–D, light gray trace), switch-ing the synapses toward a higher band-pass mode. These results indicate that GABA corelease at glutamatergic autapses confers tunable active properties with a high dynamic range for band-pass filtering through a use-dependent presynaptic modulation of the quantal release parameters.
Discussion
Over the past 2 decades, several reports have shown that peptides are coreleased with classical NTs (for a recent review, seeHnasko and Edwards 2012). However, an increasing amount of recent evi-dence has demonstrated that also classical transmitters can be coreleased at central synapses (Jonas et al. 1998;Li et al. 2004). One of the most puzzling cases is GABA corelease at glutamater-gic synapses, which has been observed in GCs of the dentate gyrus in juvenile animals (Walker et al. 2001;Gutiérrez et al. 2003;Safiulina et al. 2006;Beltrán and Gutiérrez 2012;Cabezas et al. 2012) or in the adulthood after epileptic discharges (Sloviter et al. 1996;Gutiérrez and Heinemann 2001;Gutiérrez 2000). Al-though MFTs have been shown to contain GABA (Sandler and Smith 1991;Bergersen et al. 2003), GAD (Sloviter et al. 1996) and GAT1 (Zander et al. 2010), the functional role of GABA release at juvenile MFTs is still debated.
Here, we show that, in hippocampal autaptic neurons ob-tained from mouse embryos (E18), a high percentage of glutama-tergic neurons show molecular evidence of a GABAergic phenotype. Patch-clamp recordings revealed that a large propor-tion of glutamatergic autaptic neurons (∼60%) expressing a mod-erate level of GAD67 also responded to CGP with an increase of the EPSC. On the contrary, excitatory autaptic neurons fully nega-tive for GAD67 were non-responsive to CGP. Retrospecnega-tive im-munocytochemistry that followed patch-clamp recordings revealed that all the CGP-responsive excitatory autaptic neurons were GCs positive to the specific marker, Prox1.
The vast majority of previous studies investigating GABA cor-elease at MFTs were looking for the presence of GABAAR
re-sponses, and a similar functional characterization was never performed in depth in autaptic hippocampal neurons. In agree-ment with a previous report (Cabezas et al. 2012), we never ob-served phasic GABAAR responses in autaptic GCs under control
conditions, whereas autaptic IPSCs due to the activation of post-synaptic GABAARs were observed only after the GABA-loading
procedure. However, we observed that all the CGP-responsive neurons also responded to bicuculline application with a Vrest depolarization, demonstrating that GABA release in GCs acti-vates a tonic hyperpolarizing current probably due to extrasynap-tic GABAARs activation. Although functional GABAA and
GABABRs were both expressed at autaptic GCs, it is likely that
the low amount of coreleased GABA may be only sufficient to ac-tivate extrasynaptic GABAARs and presynaptic GABABRs due to
their higher affinity for GABA with respect to postsynaptic GABAARs (Sodickson and Bean 1996;Semyanov et al. 2004).
How-ever, we cannot exclude that the amount of postsynaptic GABA
A-Rs expressed at these primarily excitatory synapses is not adequate to evoke a detectable autaptic IPSC under normal conditions.
The effect of the endogenous GABA corelease on glutamater-gic transmission was uncovered by the significant enhancement of EPSC amplitude (from 242.81 ± 42.42 to 358.45 ± 62.88 pA, n = 11; P < 0.01) coupled to a decreased PPR in response to the application of CGP (from 2.13 ± 16 to 1.49 ± 0.1, n = 18; P < 0.01), a selective
GABABR antagonist. These results indicate that the endogenous
activation of GABABRs by coreleased GABA causes a decrease of
Pr that is likely to occur through Gβγ-mediated inhibition of volt-age-gated Ca2+channels (Wu and Saggau 1995;Dittman and
Re-gehr 1996) and activation of K+channels that shunt the AP and
Figure 10. GABA corelease dynamically modulates the filtering properties of glutamatergic autapses. (A) Representative EPSCs evoked by short train stimulation (250 ms at 50 Hz, inset) under control conditions (black trace) or after 10 min treatment with either CGP (dark gray trace) or baclofen (light gray trace). Stimulation artifacts were blanked for clarity. (B) Average amplitude of the last 3 EPSCs in the train divided by the amplitude of the first EPSC and plotted as a function of the stimulation frequency (0.01, 0.1, 1, 2.5, 10, 20, and 50 Hz) under control conditions (black traces/symbols; n = 10), in the presence of CGP (dark gray traces/symbols; n = 10), or in the presence of baclofen (light gray traces/symbols; n = 10). Data are shown as means±SEM; Student’s unpaired two-tailed t-test, **P < 0.01; ***P < 0.001. (C) Representative time window of 1 s showing EPSCs evoked by a Poisson stimulation (random stimulus train lasting 5 s at an average rate of 20 Hz, top) applied under control conditions (black trace), in the presence of CGP (dark gray trace), or in the presence of baclofen (light gray trace). Each EPSC trace is obtained by averaging 4 trials repeated at 20-s intervals. Stimulation artifacts are blanked for clarity. The current threshold was placed at the 70% of the maximal EPSC (Imax) evoked during the
Poisson stimulation. (D) Time course of the average probability that a single EPSC, evoked during the Poisson stimulation, overtakes the current threshold (70% of the Imax) under control conditions (black, n = 14), after CGP (dark gray, n = 6), or after baclofen (light gray, n = 8).
limit the presynaptic Ca2+influx (Thompson and Gähwiler 1992).
Interestingly, we and others (Thanawala and Regehr 2013) also found that CGP increases the RRP size, indicating that GABABRs
also influence SV trafficking by decreasing the availability and/ or the priming of SVs for release. These additional effects of GABABR activation by coreleased GABA may be mediated by the
inhibition of adenylyl cyclase by Gαi/Gαosubunits (Sakaba and
Neher 2003;Rost et al. 2011) or be the consequence of the de-creased activation of CaM kinases I/II and synapsin phosphoryl-ation by the reduced Ca2+influx (Cesca et al. 2010).
Cultured autaptic neurons represent an artificial system and for this reason results based on this specific experimental sub-strate need to be considered cautiously. In particular, it was pre-viously reported (Rao et al. 2000) that pyramidal excitatory autaptic neurons form clusters of GABAARs in the absence of
GABAergic inputs. These GABAARs clusters facing glutamatergic
terminals have been interpreted as a mismatch, possibly reflect-ing a common signal involved in the alignment of pre- and post-synaptic components during the formation of excitatory and inhibitory synapses (Rao et al. 2000). However, in a more physio-logical system such as acute hippocampal slices, the MFTs showed colocalization of AMPA and GABAARs (Bergersen et al. 2003), and
the functionality of these GABAARs has been widely proved by
electrophysiological studies (Walker et al. 2001;Gutiérrez et al. 2003;Safiulina et al. 2006).
Moreover, cultured glutamatergic autaptic neurons represent a simplified in vitro model of neuronal hyperexcitability due to the reverberant action of their excitatory autapses that produce periods of bursting discharges. Under these conditions, GABA corelease could represent a homeostatic mechanism preserving neurons from excessive hyperexcitability. A similar functional role has been postulated for GABA corelease at MFTs in the CA3 region of the adult hippocampus during epilepsy (Gutiérrez and Heinemann 2001; Treviño and Gutiérrez 2005;Gutiérrez and Heinemann 2006;Treviño et al. 2007;Gutiérrez 2009). In this hip-pocampal area, an altered sprouting and synaptic reorganization of MF axons has been observed in human temporal lobe epilepsy and in various animal models of epilepsy, including kindling (Nadler 2003). Intense activation of MFs, both in vitro and in vivo, results in increased levels of GAD67 and VGAT mRNAs in GCs of the dentate gyrus, which allow GABA to be released from MFTs on CA3 pyramidal cells (Schwarzer and Sperk 1995;
Sloviter et al. 1996;Gutiérrez 2000). Interestingly, GABA is core-leased also by MFTs that make synapses onto interneurons tar-geting CA3 pyramidal cells (Romo-Parra et al. 2003;Safiulina et al. 2006). However, it has been shown (Gutiérrez and Heinemann 2001;
Treviño et al. 2007) that, although pyramidal cells and interneurons receive the same dual MF input, the ratio of the glutamate/GABA release is higher in interneurons than that in pyramidal cells. Thus, inhibition overrides excitation in CA3 pyramidal neurons, contrarily to what happens in interneurons.
An important concern in the evaluation of the functional im-pact of our data is that all the evidence suggesting that GABA cor-elease represents a protective mechanism to preserve neuronal network from hyperexcitability has been observed in adult ani-mals. On the contrary, our data derive from cultured autaptic neurons, obtained from E18 mouse embryos and recorded after 10–15 days of in vitro maturation. Cultured neurons of this age, although electrophysiologically functional (Bekkers and Stevens 1991), are probably still in a postnatal developmental phase. In-deed, we detected, in Prox1/GAD67-positive GCs, the Ca2+
-bind-ing protein, calretinin (Supplementary Fig. 2), a key marker of an early postmitotic stage of immature GCs, that is later ex-changed for the mature GC marker calbindin (Kempermann
et al. 2004). Previous results showed that before P10, GCs of the dentate gyrus express GAD67 and VGAT mRNAs and produce EPSPs that are blocked by bicuculline (Gutiérrez et al. 2003; Ma-queda et al. 2003;Safiulina et al. 2006). At later stages, GABA be-comes hyperpolarizing (Gutiérrez et al. 2003) and, by P22-P23, VGAT and GAD67 mRNAs dramatically decline and no further GABAA currents are detected (Gutiérrez et al. 2003;Maqueda
et al. 2003). These results indicate that another functional role for GABA corelease could be the strengthening of synapses in the developing brain through activation of voltage-gated Ca2+
channels by depolarizing GABA (Cherubini et al. 1998). However, under our conditions, coreleased GABA did not activate any GABAAR-mediated response but rather triggered a GABAB
R-mediated inhibition of EPSC amplitude by down-regulating the Pr and RRP size.
GABA corelease could act as an autocrine mechanism em-ployed by neurons for inducing continuous adjustments in short-term plasticity responses. In agreement with previous observations (Brenowitz et al. 1998), we observed that the GABABR-mediated
inhibition of glutamatergic autapses can switch synaptic re-sponses from low band-pass to high band-pass filtering, strength-ening transmission when autapses are stimulated at high rates. Under this perspective, the GABABR-mediated reduction of
gluta-mate release by coreleased GABA cannot be simply interpreted as an inhibitory homeostatic brake to excitatory transmission. Rather, the effects of coreleased GABA are dependent on the level of activity of the presynaptic neuron. In neurons that are ac-tive at very high rates, an initial inhibition of release ultimately results in an enhancement of synaptic strength by preventing depression and increasing facilitation/potentiation of synaptic transmission.
It is now clear that various synapses have the ability to release multiple SVs in response to a single AP (Tong and Jahr 1994). Mul-tivesicular release is pronounced at high Pr and is dynamically regulated by activity (Wadiche and Jahr 2001; Oertner et al. 2002). The ability to release multiple SVs at individual boutons shifts the quantal release of glutamate from a binary to a graded signal until synaptic transmission becomes saturated. Thanks to the ability to corelease GABA and activate presynaptic GABAB
R-mediated inhibition, glutamatergic autapses can work longer under a non-saturated condition (McAllister and Stevens 2000), thus extending the dynamic range of synaptic communication and ultimately increasing their information capacity.
We have shown that glutamatergic autapses coreleasing GABA can dynamically change the Pr and thus decrease depres-sion and enhance facilitation/potentiation of synaptic transmis-sion during periods of intense activity. Short-term plasticity plays a central role in synaptic computation (Abbott and Regehr 2004). By converting patterns of APs into different postsynaptic responses, synapses perform various types of temporal filtering and burst detection operations (Dittman et al. 2000). On a short time-scale, this form of plasticity depends on presynaptic changes in the release properties (Varela et al. 1997) that in turn influence the generation of the postsynaptic response. The temporal pattern of postsynaptic responses results from the ex-tent of synaptic facilitation and depression that both depend on the quantal properties of release, predominantly Pr. We demon-strated that a change in Pr by GABA corelease and activation of presynaptic GABABRs affects the filtering characteristics of a
given synapse.
Until now, GABA corelease, in the early postnatal life, was in-terpreted as a source of correlated GABAergic activity playing a crucial role in functional maturation of adult neuronal circuits or a homeostatic mechanism preserving neurons from the
excessive postsynaptic depolarization and the emergence of sei-zures (Safiulina and Cherubini 2009). Based on these novel find-ings, GABA corelease also represents an autocrine mechanism that endows excitatory synapses with the ability to actively tune their filtering properties on the basis of the firing frequency to ensure the best output/input ratio and information transfer across the synapse.
Methods
Ethical Approval
All experiments were carried out in accordance with the guide-lines established by the European Community Council (Directive 2010/63/EU of 22 September 2010) and were approved by the Ital-ian Ministry of Health. Autaptic hippocampal neurons were pre-pared from wild-type C57BL6/J mice (Charles River) or from GAD67-GFP transgenic mice (generous gift of Prof Y. Yanagawa;
Tamamaki et al. 2003). Heterozygous mice for the GAD67-GFP al-lele were mated with C57BL⁄6 wild-type mice to obtain the hetero-zygous mice whose GABAergic neurons specifically express fluorescence of GFP (Fig.3). Mice were sacrificed by CO2
inhal-ation, and 17- to 18-day embryos (E17–18) were removed immedi-ately by cesarean section.
Hippocampal Autaptic Cultures
Primary cultures of hippocampal neurons were prepared as de-scribed before (Baldelli et al. 2005,2007). In brief, hippocampi were dissociated by enzymatic digestion in 0.125% Trypsin for 20 min at 37 °C and then triturated with a fire-polished Pasteur pipette. No antimitotic drugs were added to prevent glia prolifer-ation. Autaptic neurons were prepared as described previously (Bekkers and Stevens 1991;Chiappalone et al. 2009) with slight modifications. Dissociated neurons were plated at very low dens-ity (20 cells/mm2) on microdots (40–300 μm in diameter) obtained
by spraying a mixture of poly--lysine (0.1 mg/mL) and collagen (0.25 mg/mL) on Petri dishes or glass coverslip, previously pre-treated with 0.15% agarose. Under this culture conditions, each coverslip showed about 10 isolated single autaptic neurons grown on polylysine microdots. Electrophysiological experi-ments were conducted on single and isolated autaptic neurons between 10 and 15 div.
Primary Antibodies
Antibodies against VGAT (Mouse, 1 : 500, # 131 011; Rabbit, 1 : 500 #131 003), VGLUT1 (Guinea Pig, 1 : 500 # 135 304; Mouse, 1 : 300, # 135 511); GAD67 (Guinea Pig, 1 : 500, # 198 104); GABAAγ2 (Rabbit,
1 : 500, # 224 003) and MAP2 (Guinea Pig, 1 : 500, # 188 004) were obtained from Synaptic System. Anti-GABA (Rabbit, 1 : 1000, # A2052) was obtained from Sigma–Aldrich; anti-GABABR1
(Rab-bit, 1 : 250, # sc-14006) was purchased from Santa Cruz; anti Prox1 (Mouse, 1:500, # MAB5652) and anti Calretinin (Rat; 1 : 1000; # AB5054) were obtained from Millipore.
Immunocytochemistry
Cultured autaptic neurons were fixed with 4% paraformaldehyde in 0.1 phosphate buffer, pH 7.4 for 20 min at room temperature. After several washes in phosphate-buffered saline (PBS), neurons were incubated for 10 min in 50 m NH4Cl, permeabilized and
blocked for 30 min in 5% normal goat serum (NGS)/0.1% saponin in PBS. Samples were incubated with primary antibodies diluted in 5% NGS/0.1% saponin in PBS up to 2 h. Coverslips were then washed twice in 0.1% saponin in PBS and blocked for 10 min in 5% NGS/0.1% saponin in PBS before being incubated in the
same buffer with Alexa-conjugated secondary antibodies (1 : 500, Invitrogen). After several washes in PBS, coverslips were mounted using Prolong Gold antifade reagent with DAPI staining (Invitrogen). As control for the staining and the acquisition pro-cedure, primary antibodies were omitted. Images were acquired using a ×63 objective in a Leica SP5 confocal microscope (Leica Microsystems). Acquired images were analyzed using the ImageJ software (rsb.info.nih.gov/ij/). Only true autaptic neurons (pres-ence of a single DAPI-stained nucleus or DIC image of a single neuron per microisland) were analyzed.
The images of the 3 channels corresponding to VGAT, GABA and VGLUT1 stainings were automatically thresholded, and the values of the mean intensity of the different channels were re-corded. Colocalization analysis was performed using the JACoP plug-in of ImageJ Software: for each multichannel acquired image, the colocalization analysis was performed on a manually selected region of interest (ROI) that contained one single autap-tic bouton (5 randomly selected autapses were analyzed per autaptic neuron). The Pearson’s correlation was performed on single putative excitatory synaptic contacts in which the VGLUT1 signal was detected. Multiple ROIs were defined on the VGLUT1-positive puncta. The other markers GABA, VGAT and GABAA/BRs were thus detected in the same VGLUT1-positive
ROIs, and the Pearson’s correlations between VGLUT1 and each other marker were computed using a plugin of the ImageJ Software.
Pearson’s correlation coefficient was calculated for each au-tapse as an index of the colocalization of 2 channels (namely, VGLUT1/VGAT, VGLUT1/GABA, VGLUT1/GABAAγ2R or VGLUT1/
GABABR1).
Patch-Clamp Recordings, Data Acquisition, and Analysis
Whole-cell patch-clamp recordings were made, as previously de-scribed (Baldelli et al. 2007;Valente et al. 2011). Patch pipettes, prepared from thin borosilicate glass (Hilgenberg), were pulled and fire-polished to a final resistance of 2–4 MΩ when filled with standard internal solution. Evoked EPSCs were recorded using a double EPC-10 amplifier (HEKA Electronic). For whole-cell recordings, whole-cells were maintained in a standard external solution containing (in m): 140 NaCl, 2 CaCl2, 1 MgCl2, 4 KCl,
10 glucose, and 10 HEPES (pH 7.3 with NaOH). Unless otherwise indicated, -(-)-2-amino-5-phosphonopentanoic acid (D-APV; 50 μ; Tocris) and bicuculline methiodide (30 μ, Tocris) were added to the Tyrode external solution to block N-methyl--aspartate (NMDA) and GABAARs, respectively. The standard
intern-al solution contained (in m): 126 K+Gluconate, 4 NaCl, 1 MgSO 4,
0.02 CaCl2, 0.1 BAPTA, 15 glucose, 5 HEPES, 3 ATP, and 0.1 GTP (pH
7.2 with KOH). The selective GABABRs antagonist
((2S)-3-[[(1S)-1-(3,4-Dichlorophenyl)ethyl]amino-2-hydroxypropyl]( phenyl-methyl)phosphinic acid hydrochloride; CGP58845 hydrochloride; 5 μ), the selective GABABRs agonist,
((R)-4-Amino-3-(4-chloro-phenyl)butanoic acid, baclofen 20 μ, Tocris), the group II mGluR receptor blocker ((2S,2′R,3′R)-2-(2′,3′-Dicarboxycyclopro-pyl)glycine, DCG-IV, 1 μ, Tocris), the GAT-1 inhibitor (1-(4,4-Diphenyl-3-butenyl)-3-piperidinecarboxylic acid hydrochloride, SKF-89976A hydrochloride, 50 μ, Tocris), the peptide blocker for GIRKs (sequence: ALCNCNRIIIPHQCWKKCGKK, tertiapin-Q, 50 n, Tocris), the A1 receptor blocker (8-ciclopenti-1,3-dipropil-xantine, DPCPX; 1 μ, Tocris), and the group II/III mGluR receptor blocker (2-[(1S,2S)-2-carboxycyclopropyl]-3-(9H-xanthen-9-yl)--alanine; LY341495, 4 μ, Tocris) were dissolved the same day of the experiments in the external solution. To induce a large loading of GABA into glutamatergic autapses (Bekkers 2005), the external solution containing (in m): 125 NaCl, 3 KCl, 2 Glutamate-GABA Corelease in Hippocampal Autaptic Granule Cells Valente et al. | 15