RED CELLS, IRON, AND ERYTHROPOIESIS
Quantitative analysis of murine terminal erythroid differentiation in vivo:
novel method to study normal and disordered erythropoiesis
*Jing Liu,1,2*Jianhua Zhang,3Yelena Ginzburg,4Huihui Li,4Fumin Xue,3Lucia De Franceschi,5Joel Anne Chasis,1
Narla Mohandas,1and Xiuli An3
1Red Cell Physiology Laboratory, New York Blood Center, New York, NY;2Molecular Biology Research Center, School of Biological Science and Technology and
State Key Laboratory of Medical Genetics of China, Central South University, Changsha, China;3Laboratory of Membrane Biology, New York Blood Center,
New York, NY;4Erythropoiesis Laboratory, New York Blood Center, New York, NY; and5Department of Medicine, University of Verona, Verona, Italy
Key Points
• The study establishes a
reli-able method to quantify
differ-entiating mouse erythroblasts
and to monitor terminal mouse
erythropoiesis in vivo.
• Quantitative analysis of
eryth-ropoiesis of thalassemia mice
revealed stage-specific
changes in terminal erythroid
differentiation.
Terminal erythroid differentiation is the process during which proerythroblasts differen-tiate to produce enucleated reticulocytes. Although it is well established that during murine erythropoiesis in vivo, 1 proerythroblast undergoes 3 mitosis to generate sequentially 2 basophilic, 4 polychromatic, and 8 orthochromatic erythroblasts, cur-rently there is no method to quantitatively monitor this highly regulated process. Here we outline a method that distinguishes each distinct stage of erythroid differentiation in cells from mouse bone marrow and spleen based on expression levels of TER119, CD44, and cell size. Quantitative analysis revealed that the ratio of proerythroblasts:basophilic: polychromatic:orthromatic erythroblasts follows the expected 1:2:4:8 ratio, reflecting the physiologic progression of terminal erythroid differentiation in normal mice. Moreover, in 2 stress erythropoiesis mouse models, phlebotomy-induced acute anemia and chronic hemolytic anemia because of 4.1R deficiency, the ratio of these erythroblast populations remains the same as that of wild-type bone marrow. In contrast, in anemic -thalassemia intermedia mice, there is altered progression which is restored to normal by transferrin treatment which was previously shown to ameliorate the anemic phenotype. The means to quantitate in vivo murine erythropoiesis using our approach will probably have broad application in the study of altered erythropoiesis in various red cell disorders. (Blood. 2013;121(8):e43-e49)
Introduction
Erythropoiesis is a process during which multipotent hematopoietic stem cells (HSCs) proliferate, differentiate, and ultimately produce enucleate reticulocytes. Although erythropoiesis is continuous and dynamic, it is broadly distinguished to occur in 2 phases: erythroid progenitor proliferation and terminal erythroid differentiation. Early stage erythropoiesis refers to the process by which HSCs proliferate, differentiate, and generate erythroid progenitors: burst forming unit-erythroid (BFU-E) and colony forming unit-erythroid (CFU-E). BFU-E and CFU-E are traditionally defined by colony assays.1-4 Abnormal BFU-E or CFU-E colony forming ability
reflects either perturbed commitment of HSCs to the erythroid lineage or intrinsic defects in BFU-E or CFU-E.
Terminal erythroid differentiation begins at the morphologically recognizable proerythroblast stage. Murine proerythroblasts un-dergo 3 mitoses to generate sequentially basophilic, polychromatic, and orthochromatic erythroblasts. Orthochromatic erythroblasts expel their nuclei to produce reticulocytes. Notable cellular changes occur during terminal erythroid differentiation, including decreases in cell size, chromatin condensation, and hemoglobinization. Under physiologic conditions, a single proerythroblast (Pro) will
generate 2 basophilic erythroblasts (Baso), and the 2 basophilic erythroblasts produce 4 polychromatic erythroblasts (Poly). Fi-nally, the 4 polychromatic erythroblasts generate 8 orthochromatic erythroblasts (Ortho). Thus, it is expected that during normal murine terminal erythroid differentiation, the ratio of Pro:Baso:Poly: Ortho follows a 1:2:4:8 pattern.
To understand the molecular basis of abnormal erythropoiesis leading to many inherited and acquired anemias, there is a critical need for a method that quantifies the population of cells at each distinct stage during in vivo terminal differentiation. To address this issue, more than a decade ago, Socolovsky et al introduced a flow cytometry-based assay using TER119 and CD71 as surface markers to distinguish murine erythroblasts at different differentia-tion stages.5The method was subsequently improved by adding
forward scatter (which reflects the cell size) as an additional marker.6 These methods have been extensively used to study
erythropoiesis in a variety of murine models of disordered erythro-poiesis. However, these methods fail to recapitulate the physiologic progression of normal murine terminal erythroid differentiation in a ratio of Pro:Baso:Poly:Ortho of 1:2:4:8. Indeed, in various
Submitted September 11, 2012; accepted December 7, 2012. Prepublished online as Blood First Edition paper, January 3, 2013; DOI 10.1182/blood-2012-09-456079.
*J.L. and J.Z. contributed equally to this work.
The publication costs of this article were defrayed in part by page charge payment. Therefore, and solely to indicate this fact, this article is hereby marked ‘‘advertisement’’ in accordance with 18 USC section 1734.
© 2013 by The American Society of Hematology
e43 BLOOD, 21 FEBRUARY 2013
䡠
VOLUME 121, NUMBER 8published studies hugely variable results were obtained.7-12 To
better resolve distinct stages of murine erythroblasts, we recently examined the expression of individual membrane proteins during murine erythropoiesis and documented that the adhesion molecule CD44 exhibited a progressive and dramatic decrease from Pro to reticulocytes.13Based on the changes in expression levels of GPA,
CD44 and cell size, we developed a cell-sorting strategy to isolate significantly more homogeneous populations of erythroblasts at each stage of terminal differentiation, than had been achieved in earlier work.13 However, this technique was not optimized to
reproducibly quantify the normal physiologic ratio of Pro:Baso:Poly: Ortho of 1:2:4:8 or identify potential pathology in terminal erythroid differentiation in inherited and acquired red cell disorders. Here we outline a method that accurately captures the physi-ologic progression of terminal differentiation in murine bone marrow and spleen. We observe that the ratio of Pro:Baso:Poly: Ortho in mouse bone marrow follows the 1:2:4:8 pattern, demon-strating the expected doubling of cell number with each successive mitosis. To validate this methodology as a tool for study of erythropoiesis in red cell disorders, we analyzed the progression of erythropoiesis in 3 anemic mouse models. We observed a normal progression of erythropoiesis in 2 anemic mouse models: phlebotomy-induced acute anemia and chronic hemolytic anemia because of 4.1R deficiency, indicating no stage-specific defects inhibiting cells from proceeding along the differentiation pathway in normal numbers. In contrast, -thalassemia intermedia (Hbbth1/th1)
mice demonstrated a disordered progression from Pro to Baso erythroblasts. Interestingly, transferrin therapy, which restores the normal erythropoiesis in Hbbth1/th1mice, corrected the disordered
progression. The innovative method we outlined that enables the quantification of cells at each stage of differentiation during in vivo erythropoiesis, should facilitate detailed mechanistic studies to define stage-specific defects in erythroid maturation in various inherited and acquired red cell disorders.
Methods
Mice
The 4.1R knockout mice were previously described14and Hbbth1/th1mice15 in a mixed genetic background were purchased from Jackson Laboratories. Both mice lines were backcrossed onto a C57BL/6 background. C57BL/6 (WT) mice were purchased from Jackson Laboratories. All mice were maintained at the New York Blood Center Animal Facility under specific pathogen free conditions according to institutional guidelines. Animal protocols were reviewed and approved by the Institutional Animal Care and Use Committee. Four to 6-month-old, male WT, 4.1R knockout, and
Hbbth1/th1 mice were used in the studies. WT mice were bled to induce anemia according to the method previously described.16 Hbbth1/th1 mice were treated with 10 mg (400 mg/kg/d) of transferrin or PBS via intraperitoneal injections daily for a total of 20 days; this treatment course correlated with our previous data obtained after 60 days of injections (data not shown).17
Antibodies
CD16/CD32 (Fc␥ III/II Receptor), FITC-conjugated anti-Ter119, APC-conjugated anti-CD44, APC-Cy 7–APC-conjugated anti-CD45, APC-Cy 7–conjugated anti-CD11b, APC-Cy 7–conjugated anti-GR1, and 7AAD were purchased from BD Bioscience. Anti-transferrin receptor antibody was from Invitrogen.
Preparation of bone marrow and spleen single-cell suspensions
For bone marrow single-cell suspension preparation, cells from mice tibia and femur were flushed with PBS/0.5% BSA/2mM EDTA and the cell suspension was gently passed through 271⁄2 G needle 3 to 4 times. For
spleen single cell suspension preparation, a whole spleen was placed into a cell strainer and smashed through the cell strainer into a petri dish. The cell strainer was rinsed with 5 mL cold PBS/0.5%BSA buffer. The cells were transferred to a 15-mL conical tube and centrifuged at 300g for 5 minutes. After centrifugation, the cell pellet was suspended in PBS/0.5% BSA buffer. Depletion of CD45ⴙcells
A single-cell suspension of bone marrow or spleen was centrifuged at 300g for 10 minutes, at 4°C. After centrifugation, 107cells were resuspended in 90L of buffer, to which 10 L of mouse CD45 MicroBeads (Miltenyi Biotec) was added. The mixture was incubated for 15 minutes at 4°C, and after the addition of 1 mL of buffer, centrifuged at 300g for 10 minutes. The cell pellet was resuspended in 500L of buffer. The CD45⫺and CD45⫹ cells were separated by magnetic separation with LS columns according to the instruction from the manufacture (Miltenyi Biotec). The flow through fraction (CD45⫺cells) was collected for further staining.
Staining of CD45ⴚcells and flow cytometric analysis
Cells were suspended in PBS/0.5% BSA buffer at the concentration of 106/80L and incubated with rat anti–mouse CD16/CD32 (2.5 g/106 cells) for 15 minutes on ice. Samples were subsequently stained with FITC-conjugated rat anti–mouse TER-119 (0.5 g/106 cells), APC-conjugated rat anti–mouse CD44 (0.2g/106cells), APC-Cy 7–conjugated anti-CD45 (0.1g/106cells), APC-Cy 7–conjugated anti-CD11b (0.1g/106 cells), and APC-Cy 7–conjugated anti-GR1(0.1g/106cells) on ice for 20 to 30 minutes in the dark. Cells were washed twice with 700 L PBS/0.5% BSA. Finally, cells were suspended in 100L PBS/0.5% BSA and stained with the viability marker 7-AAD (0.25g/106cells) on ice for 10 minutes in the dark. After the staining, cells were suspended in 0.4 mL of PBS/0.5%BSA and analyzed within 1 hour of staining using BD FACSDiva Version 6.1.2 software on a FACSCanto flow cytometer (Becton Dickin-son). The instrument settings were as follows: FSC: 319, SSC: 568; voltage for different fluorescent dyes: FITC:575, PE: 661, APC: 676, APC-Cy 7: 670, 7-AAD: 691. Unstained cells were used as a negative control. Gating procedure
Using 7AAD as a marker, dead cells were gated out. Among live cells, the residual leukocytes, monocytes, and granulocytes remaining after CD45 depletion were gated out using APC-Cy7–conjugated CD45, GR1, and CD11b as markers. CD45⫺GR1⫺CD11b⫺TER119⫹cells were analyzed in 2 ways: TER119 versus CD44 and CD44 versus FSC. Population I was gated on the CD44/TER119 plot, which is defined as CD44hiTER119low popula-tion. All other populations were gated on the CD44/FSC plot. In this plot, there are 2 very clear clusters which we gated as IV and V. A less clear cluster below region V was gated as region VI. Similarly, a less well-defined cluster on the upper-right side of region IV was gated as region III. Finally, the area between region I and region III was gated as region II.
Fluorescence-activated cell sorting
To isolate erythroblasts at different stages of maturation, 200⫻ 106cells were suspended in 8 mL PBS/0.5% BSA in a 50-mL tube. Cells were blocked with rat anti–mouse CD16/CD32 (2.5g /106cells) for 15 minutes and subsequently stained with FITC rat anti–mouse TER-119 (0.5g/106 cells), APC rat anti–mouse CD44 (0.2g/106cells), APC-Cy 7–conjugated anti-CD45(0.1g/106cells), APC-Cy 7–conjugated anti-CD11b (0.1g/106 cells), and APC-Cy 7–conjugated anti-GR1(0.1g/106cells) antibodies, and then incubated on ice for 30 minutes in the dark. Cells were washed twice with 40 mL PBS/0.5% BSA buffer and resuspended in 8 mL PBS/0.5% BSA buffer and stained with the viability marker 7-AAD
(0.25g/106cells) on ice for 10 minutes in the dark. Sorting was performed on a MOFLO high-speed cell sorter (Beckman-Coulter).
Cytospin preparation
One-hundred milliliters of cell suspension containing 105sorted cells was used to prepare cytospin preparations on coated slides, using the Thermo Scientific Shandon 4 Cytospin. The slides were stained with May-Grunwald (Sigma-Aldrich MG500) solution for 5 minutes, rinsed in 40mM Tris buffer (pH 7.2) for 90 seconds, and subsequently stained with 1:10 diluted Giemsa solution (Sigma-Aldrich GS500) for 15 minutes.
Western blot analysis
Serum samples were separated by sodium dodecyl sulfate-polyacrylamide gel electrophoresis (SDS-PAGE) using 10% polyacrylamide gels, and the proteins were electrophoretically transferred to polyvinylidene difluoride membrane (Immobilon-P; Millipore). Membranes were blocked for 1 hour in TBS-T (10mM Tris-HCl, pH 8.0; 150mM NaCl; 0.05% Tween 20) containing 5% skim milk, followed by 1 hour incubation with anti-transferrin receptor antibody. Blots were washed and incubated for 1 hour at room temperature with the secondary antibody (horseradishperoxidase [HRP]–conjugated). Immunoreactive bands were visualized by the en-hanced chemiluminescence (ECL) method (Amersham Bioscience) accord-ing to standard procedures.
Statistical analyses
All data are reported as mean⫾ SD. We performed analysis for statistically significant differences with the student unpaired t test.
Results
Quantitation of in vivo erythropoiesis in murine bone marrow
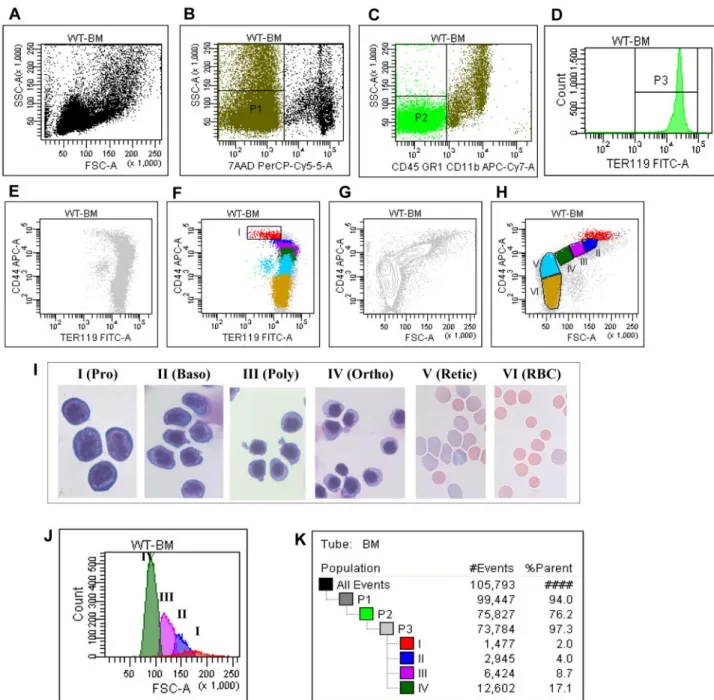
It is well accepted that during murine terminal erythroid differentia-tion the proerythroblast undergoes 3 cell divisions to differentiate sequentially into basophilic, polychromatic, and orthochromatic erythroblasts. Thus, it is expected that under normal physiologic conditions 1 proerythroblast would produce 8 orthochromatic erythroblasts. To develop a method that would accurately reflect the physiologic progression of in vivo terminal differentiation and enable the quantitation of the number of cells in the various developmen-tal stages, we first depleted CD45⫹cells from single cell suspen-sions of normal murine bone marrow by magnetic separation. The CD45⫺ cells were then stained with FITC-conjugated rat anti-mouse TER119, APC-conjugated rat anti–anti-mouse CD44, APC-Cy 7–conjugated anti-CD45, APC-Cy 7–conjugated anti-CD11b, APC-Cy 7–conjugated anti-GR1 and the viability marker 7AAD. The stained cells were analyzed by flow cytometry.
For clarity, the entire procedure for the gating strategy is shown in Figure 1 and summarized in this section: (1) Figure 1A shows the plot of FSC versus SSC of all cells in the cell suspension being analyzed; (2) the live cells (P1) were gated as 7AAD negative cells (Figure 1B); (3) within the P1 population, cells of erythroid lineage (P2) were gated as CD45⫺CD11b⫺GR1⫺cells (Figure 1C); (4) his-togram of TER119 expression of P2 showed that all P2 cells were TER119 positive (Figure 1D); (5) plot of CD44 versus TER119 of the TER119 positive cells revealed a distinct CD44hiTERlow
population (Figure 1E), which was gated as region I (Figure 1F); and (6) plot of CD44 versus FSC of the TER119 positive cells revealed 4 naturally occurring cell clusters (Figure 1G), which were gated as region III, IV, V, and VI, respectively, and the nonclustered region between region I and region III was gated as region II (Figure 1H).
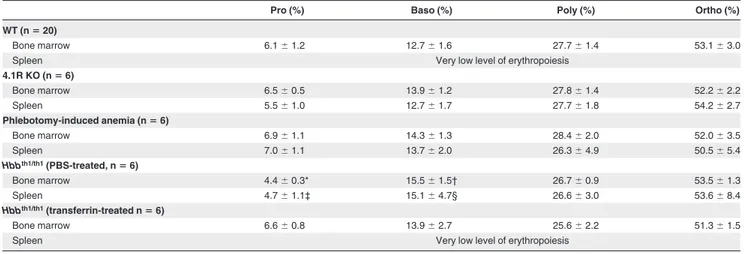
The representative images of the sorted populations are shown in Figure 1I which reveals that region I through region VI are proerythroblasts, basophilic erythroblasts, polychromatic erythro-blasts, orthochromatic erythroerythro-blasts, reticulocytes, and mature red cells, respectively. The purity of each population is⬎ 90%. As shown in Figure 1J, the FSC (reflecting the cell size) decreased progressively from proerythroblasts to orthochromatic erythro-blasts. Importantly, Figure 1K reveals that proerythroblasts, baso-philic erythroblasts, polychromatic erythroblasts, and orthochro-matic erythroblasts account for 2%, 4%, 8.7%, and 17% of the total TER119 positive cells, respectively, demonstrating the doubling of the cells on each mitosis. The proportion of cells at each distinct stage of maturation after normalization based on total nucleated erythroid cells as 100% is summarized in Table 1. Pro, Baso, Poly, and Ortho account for 6%, 13%, 28%, and 53% of the total nucleated erythroblasts, respectively, validating the doubling of cells from one stage to the next.
Normal progression of terminal erythroid differentiation in the bone marrow and spleen of anemic mice because of
4.1R-deficiency or after phlebotomy
To validate the use of the methodology as a tool for studying erythropoiesis in red cell disorders, we analyzed the progression of erythropoiesis in 3 anemic mouse models; 2 models with expected normal progression of erythropoiesis and 1 model with ineffective erythropoiesis. First, we examined erythropoiesis profiles in mice with chronic hemolytic anemia because of deficiency of the red cell cytoskeletal protein 4.1R14 and in WT mice with
phlebotomy-induced acute anemia. Because the spleen becomes erythropoietic in mice under stress conditions, we examined the erythropoiesis profiles of both bone marrow and spleen. Figure 2 top panel shows the representative erythropoiesis profiles of bone marrow from WT, 4.1R⫺/⫺ and phlebotomized WT mice. Relative to WT bone marrow, we demonstrate an increased proportion of nucleated erythroblasts (I⫹II⫹III⫹IV) accompanied by a decreased propor-tion of enucleated erythrocytes (V⫹VI) in both 4.1R⫺/⫺ and phlebotomized WT bone marrow. Quantitative analysis shown in Table 2 demonstrated that in WT bone marrow (from 2 femurs and 2 tibias), the number of total nucleated erythroblasts is⬃ 6.4 ⫻ 106,
whereas in 4.1R⫺/⫺and in phlebotomized WT mouse bone the total nucleated erythroblasts increased to ⬃ 11.3 ⫻ 106 and
⬃ 10.7 ⫻ 106, respectively. These findings demonstrate the
in-creased erythropoietic activity of bone marrow under stress condi-tions. Of note, within the nucleated erythroblast population, the Pro, Baso, Poly, and Ortho maintain the 1:2:4:8 ratio (Table 1), confirming a normal progression of erythropoiesis in bone marrow under erythropoietic stress. Figure 2 bottom panel shows the representative erythropoiesis profiles of spleen from WT, 4.1R⫺/⫺, and phlebotomized WT mice. Although few erythroblasts are present in the WT spleens, significantly increased numbers of erythroblasts can be found in the spleens of both 4.1R⫺/⫺ and phlebotomy-induced anemic WT mice because of stress erythropoi-esis in the spleen. Quantitative analysis showed that in WT spleen, there were only 0.7⫻ 106 nucleated erythroblasts. In marked
contrast, in the 4.1R⫺/⫺ and phlebotomy-induced anemic WT mouse spleens, the nucleated erythroblasts increased to 66.5⫻ 106
and 73.1⫻ 106, respectively (Table 2). Moreover, similar to bone
marrow, within the nucleated erythroblast population, the Pro, Baso, Poly, and Ortho erythroblasts also followed the 1:2:4:8 ratio (Table 1), demonstrating the normal progression of erythropoiesis in the spleen as in the bone marrow in these 2 anemic models with chronic and acute anemia.
Altered erythropoiesis in the bone marrow and spleen of Hbbth1/th1mice and normalization after transferrin therapy
-thalassemia is characterized by ineffective erythropoiesis in which erythroid expansion does not fully compensate the ane-mia.18,19 However, it remains largely unclear at which stage of
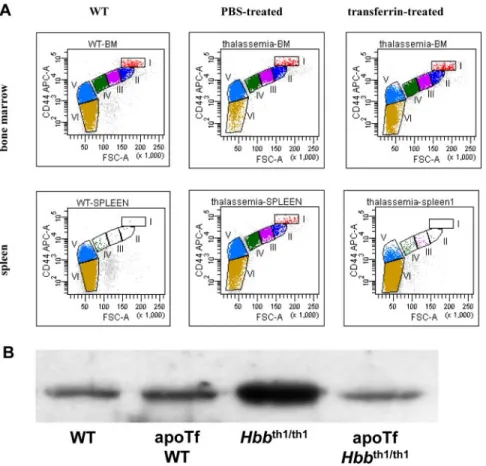
erythropoiesis these alterations occur in-thalassemic mice. To address this, we quantified in vivo erythropoiesis of both bone marrow and spleen in Hbbth1/th1mice. Figure 3A top and bottom
panels show the representative erythropoiesis profiles of bone marrow and spleen from WT, PBS-injected Hbbth1/th1mice, and
transferrin-injected Hbbth1/th1 mice. Similar to 4.1R⫺/⫺ and
phlebotomy-induced anemic mouse models, there is an expansion of erythropoiesis in the bone marrow as well as spleen of Hbbth1/th1
mice. In PBS-treated Hbbth1/th1mouse bone marrow, the nucleated
erythroblasts increased to 16.5⫻ 106(from 6.4⫻ 106in WT bone
marrow). Interestingly, in transferrin-treated Hbbth1/th1mouse bone
marrow, the total number of nucleated erythroblasts is normal. The expansion of erythropoiesis in PBS-treated Hbbth1/th1mouse spleen
is even more dramatic as there is a⬎ 100-fold increase in nucleated erythroblasts (from 0.7⫻ 106in WT to 90⫻ 106in PBS-treated
Hbbth1/th1). However, different from 4.1R⫺/⫺ and phlebotomized
WT bone marrow and spleen (both of which exhibited normal progression of terminal erythroid differentiation) quantitative anal-ysis revealed a decrease in the percentage of Pro and dispropor-tional ratio of Pro to Baso erythroblasts in Hbbth1/th1. As shown in
Table 1, although Pro account for 6% to 7% of total nucleated Figure 1. Flow cytometric analysis and isolation of erythroblasts of wild-type mice bone marrow cells. (A) Plot of FSC versus SSC of all the cells. (B) Plot of 7AAD
versus SSC of all the cells. (C) Plot of CD45CD11bGR1 versus SSC of all the cells. (D) Histogram of TER119 of CD45⫺CD11b⫺GR1⫺cells. (E) Plot of CD44 versus TER119 of the TER119 positive cells without gating. (F) Plot of CD44 versus TER119 of the TER119 positive cells with the gating on CD44hiTERlowpopulation I. (G) Plot of CD44 versus FSC of the
TER119 positive cells, showing naturally occurring clusters. (H) Plot of CD44 versus FSC of the TER119 positive cells with gating the population II, III, IV, V and VI. (I) Representative cytospin images of the sorted populations. (J) Histogram of FSC of distinct stage of erythroblasts. (K) Proportion of distinct stage of erythroblasts in bone marrow.
erythroblasts in WT, as well as in the 2 anemic mouse models, they only account for 4.4% in Hbbth1/th1mice. Moreover, whereas the
ratio of Pro/Baso erythroblasts is 1:2 in WT and 2 anemic mouse models, it increased to 1:3.5 in Hbbth1/th1mice. Importantly, the
erythropoiesis profiles are normalized in transferrin-treated Hbbth1/th1mouse bone marrow (Table 1). Lastly, the elevated serum
soluble transferrin receptor 1 (sTfR1), representing the total increased erythroid population in Hbbth1/th1 mice, is reversed in
transferrin-treated Hbbth1/th1mice (Figure 3B). This later finding
justifies the use of PBS and transferrin-treated Hbbth1/th1mice as a
model in which to assess aberrant erythropoiesis and its resolution.
Discussion
This study establishes a reliable method to quantify differentiating mouse erythroblasts and to monitor terminal in vivo erythropoiesis.
Using this method, we are able to define stage-specific changes in terminal erythroid differentiation in the bone marrow and spleen of Hbbth1/th1mice and their reversal after transferrin treatment,
previ-ously shown to ameliorate disease in Hbbth1/th1mice.17
A flow cytometry-based assay using CD71 (sometimes in conjunction with forward scatter) as a differentiation marker has been extensively used to study murine erythropoiesis in vivo over the past decade. Our analysis of more than 40 previous published studies using CD71 as a marker reveal large variations in the ratio of Pro:Baso:Poly:Ortho in normal WT bone marrow. For example, Halupa et al reported percentages of Pro:Baso:Poly:Ortho as 1.1: 39.5: 4.1: 55.3 for WT mice,9 whereas Mukai and colleagues
reported percentages of 0.5: 30.1: 25.6: 9.3,10 and Diwan et al
reported as 2: 16: 2: 27.11Similarly, our analysis of 10 previous
studies using CD71 in conjunction with forward scatter also reveals large inconsistencies in the ratio of Pro:Baso:Poly:Ortho in normal murine bone marrow.6,20-28 None of these studies were able to Table 1. Quantitation of terminal erythroid differentiation in normal and anemic mouse models
Pro (%) Baso (%) Poly (%) Ortho (%)
WT (nⴝ 20)
Bone marrow 6.1⫾ 1.2 12.7⫾ 1.6 27.7⫾ 1.4 53.1⫾ 3.0
Spleen Very low level of erythropoiesis
4.1R KO (nⴝ 6) Bone marrow 6.5⫾ 0.5 13.9⫾ 1.2 27.8⫾ 1.4 52.2⫾ 2.2 Spleen 5.5⫾ 1.0 12.7⫾ 1.7 27.7⫾ 1.8 54.2⫾ 2.7 Phlebotomy-induced anemia (nⴝ 6) Bone marrow 6.9⫾ 1.1 14.3⫾ 1.3 28.4⫾ 2.0 52.0⫾ 3.5 Spleen 7.0⫾ 1.1 13.7⫾ 2.0 26.3⫾ 4.9 50.5⫾ 5.4 Hbbth1/th1(PBS-treated, nⴝ 6) Bone marrow 4.4⫾ 0.3* 15.5⫾ 1.5† 26.7⫾ 0.9 53.5⫾ 1.3 Spleen 4.7⫾ 1.1‡ 15.1⫾ 4.7§ 26.6⫾ 3.0 53.6⫾ 8.4 Hbbth1/th1(transferrin-treated nⴝ 6) Bone marrow 6.6⫾ 0.8 13.9⫾ 2.7 25.6⫾ 2.2 51.3⫾ 1.5
Spleen Very low level of erythropoiesis
The proportion of cells at each distinct stage of maturation is normalized based on total nucleated erythroblasts as 100%. WT indicates wild-type.
*P⫽ .0026 WT versus Hbbth1/th1mice.
†P⫽ .0023 WT versus Hbbth1/th1mice.
‡P⫽ .033 WT versus Hbbth1/th1mice.
§P⫽ .042 WT versus Hbbth1/th1mice.
Figure 2. Representative erythropoiesis profiles of bone marrow and spleen of 4.1Rⴚ/ⴚand phlebotomy-induced mice. (Top panel) Representative
erythropoi-esis profiles of bone marrow. Note that there is an increased proportion of nucleated erythroblasts (I⫹II⫹III⫹IV) which is accompanied by a decreased proportion of enucleated erythrocytes (V⫹VI) in both 4.1R⫺/⫺and phlebotomy-induced WT bone marrow
com-pared with WT bone marrow. (Bottom panel) Representa-tive erythropoiesis profiles of spleen. Note that there are very few erythroblasts in WT spleen but a large propor-tion of nucleated erythroblasts in the spleens of both 4.1R⫺/⫺and phlebotomy-induced WT anemic mice.
document physiologic progression of terminal erythroid differentia-tion in normal bone marrow. As such, the reported stage-specific erythropoietic defects in various genetically engineered mice using CD71 as a marker is highly problematic.
The novel method presented in this paper enables successful in vivo quantitation of mouse terminal erythroid differentiation. This success is largely attributed to clear separation of all terminally differentiating erythroid cells, namely Pro, Baso, Poly, Ortho erythroblasts, reticulocytes, and mature red blood cells, using surface markers TER119 and CD44 in conjunction with forward scatter. The failure of previous studies to quantify this process using Ter119 and CD71 is because of the fact that in contrast to CD44 expression that decreases progressively after each cell division, there is little change in CD71 expression after each cell division.13In the original study using CD71 and TER119 as
markers for erythroid cell differentiation, the authors defined 4 regions I, II, III, and IV. They indicated that these regions are enriched in Pro, Baso, Poly, and Ortho erythroblasts, respectively.5
Even after the addition of FSC as an additional marker, the defined erythroblast populations (namely Pro-E, Ery-A, Ery-B, and Ery-C) did not improve the discrimination between different stages.
Our findings also provide new insights into the splenic and bone marrow responses to stress erythropoiesis. In mice, although it is well accepted that the spleen becomes erythropoietic under stress conditions, it has been unclear to what extent the bone marrow can increase its erythroid output in response to stress. Furthermore, the extent of the splenic response has not been carefully defined. Our findings demonstrate that the total number of erythroblasts (which reflects the erythropoietic activity) is increased ⬃ 2-fold in the bone marrows of all 3 anemic mice: 1 acute (phlebotomy-induced) and 2 chronic anemic mouse models (4.1R⫺/⫺ and Hbbth1/th1),
implying that murine bone marrow can double its erythropoietic activity in response to anemic stress. In marked contrast, under both chronic and acute stress conditions the erythropoietic response of the spleen increases much more dramatically (⬃ 100-fold), with the spleen transforming from an essentially non-erythropoietic organ in the adult mice to an active erythropoietic tissue.
The major observed effect of erythropoiesis in Hbbth1/th1mice is
a disturbed proportion of proerythroblasts versus basophilic eryth-roblasts in bone marrow and spleen samples. During normal erythropoiesis, iron is progressively incorporated into hemoglobin and thus safely sequestered, avoiding potential redox reactive damage. Thus, early stage erythroid precursors are exposed to high iron concentrations, as evidenced by CD71-positive early stage erythroid precursors, with later stages accumulating hemoglobin as it is progressively synthesized and thus reducing total cellular iron. In -thalassemia, an additional progressive accumulation of un-paired ␣ globin occurs. Furthermore, systemic iron overload, as occurs in-thalassemia, may result in the formation of labile iron
Figure 3. Altered terminal erythroid differentiation of
Hbbth1/th1mice and normalization after thansferrin therapy. (A) Representative erythropoiesis profiles of
bone marrow and spleen of Hbbth1/th1mice. (Top panel)
The representative erythropoiesis profiles of bone mar-row. A decrease in fraction I (proerythroblast) and fraction VI (mature red cells) is clearly seen in PBS-treated thalassemia bone marrow and is restored in transferrin-treated bone marrow. (Bottom panel) Representative erythropoiesis profiles of spleen. There are very few erythroblasts in WT spleen, but the spleen of thalassemia mouse is highly erythropoietic and is restored in transferrin-treated spleen. (B) Western blot revealed an increase in soluble serum TfR1 in Hbbth1/th1relative to WT
mice and is normalized after transferrin treatment. Table 2. Total number of erythroblasts in bone marrow and spleen
of normal and anemic mouse models
Bone marrow (ⴛ 106) Spleen (ⴛ 106) WT (n⫽ 20) 6.4⫾ 0.9 0.7⫾ 0.1 4.1R KO (n⫽ 6) 11.3⫾ 1.1* 66.5⫾ 5.4† Phlebotomy induced anemia (n⫽ 6) 10.9⫾ 1.2* 73.1⫾ 3.0†
Hbbth1/th1(PBS-treated, n⫽ 6) 16.5⫾ 0.7† 90.4⫾ 6.3†
Hbbth1/th1(transferrin-treated, n⫽ 6) 6.4⫾ 1.1 0.8⫾ 0.1
Bone marrow cells are from 2 tibia and 2 femurs. *P⬍ .001.
and negatively affect cells with high iron uptake in addition to unpaired␣ globin membrane precipitation in later stages. Improved erythropoiesis after iron chelation is evident in transfusion-requiring anemias.29Taken together, the increased systemic iron,
disordered hemoglobin synthesis, and high iron uptake support the particular sensitivity of early erythroid precursors to labile iron-induced damage in -thalassemia. We hypothesize that once erythroid precursors survive a critically sensitive point in matura-tion, cell division proceeds relatively unimpeded. Our data suggest that ineffective erythropoiesis in-thalassemia results from dysfunc-tional differentiation because of excess iron and unpaired␣ globin chains and is reversed by exogenous transferrin; this finding is also supported by normalized serum sTfR1, a typical marker reflecting degree of defective or iron-deficient erythropoiesis.30,31
This newly established method is broadly applicable in the study of altered murine erythropoiesis. Moreover, its use will probalby provide important leads for mechanistic studies defining stage-specific defects in erythroid maturation in inherited and acquired red cell disorders.
Acknowledgments
The authors thank Leni VonBonsdorff (Sanquin Oy, Finland) for providing human transferrin for experiments in Hbbth1/th1mice.
This work was supported in part by National Institutes of Health grants DK26263, DK32094, HL105682, and DK095112.
Authorship
Contribution: J.L., J.Z., H.L., and F.X. performed experiments and analyzed the data; Y.G., L.D.F, J.A.C., and N.M. designed the experiments, analyzed the data, and edited the paper; X.A. designed the experiments, analyzed the data, and wrote the paper.
Conflict-of-interest disclosure: The authors declare no compet-ing financial interests.
Correspondence: Xiuli An, Laboratory of Membrane Biology, 310 E 67th St, New York, NY 10065; e-mail: [email protected].
References
1. Stephenson JR, Axelrad AA, McLeod DL, Shreeve MM. Induction of colonies of hemoglobin-synthesizing cells by erythropoietin in vitro. Proc Natl Acad Sci U S A. 1971;68(7): 1542-1546.
2. McLeod DL, Shreeve MM, Axelrad AA. Improved plasma culture system for production of erythro-cytic colonies in vitro: quantitative assay method for CFU-E. Blood. 1974;44(4):517-534. 3. Heath DS, Axelrad AA, McLeod DL, Shreeve MM.
Separation of the erythropoietin-responsive pro-genitors BFU-E and CFU-E in mouse bone mar-row by unit gravity sedimentation. Blood. 1976; 47(5):777-792.
4. Dover GJ, Chan T, Sieber F. Fetal hemoglobin production in cultures of primitive and mature hu-man erythroid progenitors: differentiation affects the quantity of fetal hemoglobin produced per fetal-hemoglobin-containing cell. Blood. 1983; 61(6):1242-1246.
5. Socolovsky M, Nam H, Fleming MD, Haase VH, Brugnara C, Lodish HF. Ineffective erythropoiesis in Stat5a(⫺/⫺)5b(⫺/⫺) mice due to decreased survival of early erythroblasts. Blood. 2001; 98(12):3261-3273.
6. Liu Y, Pop R, Sadegh C, Brugnara C, Haase VH, Socolovsky M. Suppression of Fas-FasL coex-pression by erythropoietin mediates erythroblast expansion during the erythropoietic stress re-sponse in vivo. Blood. 2006;108(1):123-133. 7. Kinross KM, Clark AJ, Iazzolino RM, Humbert PO.
E2f4 regulates fetal erythropoiesis through the promotion of cellular proliferation. Blood. 2006; 108(3):886-895.
8. Minella AC, Loeb KR, Knecht A, et al. Cyclin E phosphorylation regulates cell proliferation in he-matopoietic and epithelial lineages in vivo. Genes
Dev. 2008;22(12):1677-1689.
9. Halupa A, Bailey ML, Huang K, Iscove NN, Levy DE, Barber DL. A novel role for STAT1 in regulating murine erythropoiesis: deletion of STAT1 results in overall reduction of erythroid progenitors and alters their distribution. Blood. 2005;105(2):552-561.
10. Mukai HY, Motohashi H, Ohneda O, Suzuki N,
Nagano M, Yamamoto M. Transgene insertion in proximity to the c-myb gene disrupts erythroid-megakaryocytic lineage bifurcation. Mol Cell Biol. 2006;26(21):7953-7965.
11. Diwan A, Koesters AG, Odley AM, et al. Unre-strained erythroblast development in Nix⫺/⫺ mice reveals a mechanism for apoptotic modula-tion of erythropoiesis. Proc Natl Acad Sci U S A. 2007;104(16):6794-6799.
12. Hosoya-Ohmura S, Mochizuki N, Suzuki M, Ohneda O, Ohneda K, Yamamoto M. GATA-4 incompletely substitutes for GATA-1 in promoting both primitive and definitive erythropoiesis in vivo.
J Biol Chem. 2006;281(43):32820-32830.
13. Chen K, Liu J, Heck S, Chasis JA, An X, Mohandas N. Resolving the distinct stages in erythroid differen-tiation based on dynamic changes in membrane protein expression during erythropoiesis. Proc
Natl Acad Sci U S A. 2009;106(41):17413-17418.
14. Shi ZT, Afzal V, Coller B, et al. Protein 4.1R-deficient mice are viable but have erythroid mem-brane skeleton abnormalities. J Clin Invest. 1999; 103(3):331-340.
15. Skow LC, Burkhart BA, Johnson FM, et al. A mouse model for beta-thalassemia. Cell. 1983; 34(3):1043-1052.
16. Joiner CH, Franco RS, Jiang M, Franco MS, Barker JE, Lux SE. Increased cation permeability in mutant mouse red blood cells with defective mem-brane skeletons. Blood. 1995;86(11):4307-4314. 17. Li H, Rybicki AC, Suzuka SM, et al. Transferrin
therapy ameliorates disease in beta-thalassemic mice. Nat Med. 2010;16(2):177-182.
18. Centis F, Tabellini L, Lucarelli G, et al. The impor-tance of erythroid expansion in determining the extent of apoptosis in erythroid precursors in pa-tients with beta-thalassemia major. Blood. 2000; 96(10):3624-3629.
19. Rund D, Rachmilewitz E. Beta-thalassemia.
N Engl J Med. 2005;353(11):1135-1146.
20. Alfarano C, Andrade CE, Anthony K, et al. The Biomolecular Interaction Network Database and related tools 2005 update. Nucleic Acids Res. 2005;33(database issue):D418-424.
21. Carmichael CL, Majewski IJ, Alexander WS, et al. Hematopoietic defects in the Ts1Cje mouse model of Down syndrome. Blood. 2009;113(9):1929-1937. 22. Chen ML, Logan TD, Hochberg ML, et al. Ery-throid dysplasia, megaloblastic anemia, and im-paired lymphopoiesis arising from mitochondrial dysfunction. Blood. 2009;114(19):4045-4053. 23. Cheloufi S, Dos Santos CO, Chong MM,
Hannon GJ. A dicer-independent miRNA biogen-esis pathway that requires Ago catalysis. Nature. 2010;465(7298):584-589.
24. Guihard S, Clay D, Cocault L, et al. The MAPK ERK1 is a negative regulator of the adult steady-state splenic erythropoiesis. Blood. 2010;115(18): 3686-3694.
25. Kalfa TA, Pushkaran S, Zhang X, et al. Rac1 and Rac2 GTPases are necessary for early erythro-poietic expansion in the bone marrow but not in the spleen. Haematologica. 2010;95(1):27-35. 26. Martin FM, Xu X, von Lohneysen K, Gilmartin TJ,
Friedman JS. SOD2 deficient erythroid cells up-regulate transferrin receptor and down-up-regulate mitochondrial biogenesis and metabolism. PLoS
One. 2011;6(2):e16894.
27. Maragno AL, Pironin M, Alcalde H, et al. ISG15 modulates development of the erythroid lineage.
PLoS One. 2011;6(10):e26068.
28. Ripich T, Jessberger R. SWAP-70 regulates erythropoiesis by controlling alpha4 integrin.
Haematologica. 2011;96(12):1743-1752.
29. Oliva EN, Ronco F, Marino A, Alati C, Pratico G, Nobile F. Iron chelation therapy associated with improvement of hematopoiesis in transfusion-dependent patients. Transfusion. 2010;50(7): 1568-1570.
30. Ricchi P, Ammirabile M, Costantini S, et al. A useful relationship between the presence of extramedullary erythropoeisis and the level of the soluble form of the transferrin receptor in a large cohort of adult patients with thalassemia intermedia: a prospective study.
Ann Hematol. 2012;91(6):905-909.
31. Beguin Y. Soluble transferrin receptor for the evaluation of erythropoiesis and iron status. Clin