doi:10.1100/2012/565047
The
cientific
WorldJOURNAL
Research Article
Distinct Mechanisms Regulating Gene Expression Coexist within
the Fermentative Pathways in
Chlamydomonas reinhardtii
Larisa Angela Swirsky Whitney,
1Giacomo Novi,
2Pierdomenico Perata,
2and Elena Loreti
31Department of Crop Plant Biology, University of Pisa, Via Mariscoglio 34, 56124 Pisa, Italy
2PlantLab, Institute of Life Sciences, Scuola Superiore Sant’Anna, Via Mariscoglio 34, 56124 Pisa, Italy
3Institute of Agricultural Biology and Biotechnology, National Research Council, Via Moruzzi 1, 56100 Pisa, Italy Correspondence should be addressed to Elena Loreti,[email protected]
Received 17 February 2012; Accepted 21 March 2012 Academic Editors: H. Acker and E. Tyystjarvi
Copyright © 2012 Larisa Angela Swirsky Whitney et al. This is an open access article distributed under the Creative Commons Attribution License, which permits unrestricted use, distribution, and reproduction in any medium, provided the original work is properly cited.
Under dark anoxia, the unicellular green algae Chlamydomonas reinhardtii may produce hydrogen by means of its hydrogenase enzymes, in particular HYD1, using reductants derived from the degradation of intercellular carbon stores. Other enzymes belonging to the fermentative pathways compete for the same reductants. A complete understanding of the mechanisms determining the activation of one pathway rather than another will help us engineer Chlamydomonas for fermentative metabolite production, including hydrogen. We examined the expression pattern of the fermentative genes PDC3, LDH1, ADH2, PFL1, and
PFR1 in response to day-night cycles, continuous light, continuous darkness, and low or high oxygen availability, which are all
conditions that vary on a regular basis in Chlamydomonas’ natural environment. We found that all genes except PFL1 show daily fluctuations in expression, and that PFR1 differentiated itself from the others in that it is clearly responsive to low oxygen, where as
PDC3, LDH1, and ADH2 are primarily under diurnal regulation. Our results provide evidence that there exist at least three different
regulatory mechanisms within the fermentative pathways and suggest that the fermentative pathways are not redundant but rather that availability of a variety of pathways allows for a differential metabolic response to different environmental conditions.
1. Introduction
Interest in the unicellular green alga Chlamydomonas rein-hardtii (referred to here as Chlamydomonas throughout) has increased over the past decade in the hope that it may one day be possible to harness its exceptional capacity to produce hydrogen. Hydrogen may be used as a renewable energy
carrier whose combustion does not release CO2 into the
atmosphere, rendering it more attractive than other potential
renewable energies such as ethanol [1].
Chlamydomonas synthesizes hydrogen in a reaction
cat-alyzed mainly by its hydrogenase1 (HYD1) enzyme [2]. Due
to the hydrogenases’ extreme sensitivity to oxygen [3],
sus-tained H2synthesis occurs only under anoxia. In its natural
environment, Chlamydomonas may be subjected to hypoxia or anoxia on a daily basis after sunset, when the absence of
photosynthesis coincides with high rates of respiration [4]. In
the lab, low oxygen cultures may also be obtained in the light
in cases where photosynthetic O2 evolution does not cover
respiratory requirements, for example, by anaerobic gas influxation into liquid cultures or a number hours after being
subjected to sulfur starvation [5,6]. A number of studies
have shown that Chlamydomonas acclimates to anoxia by
changing its metabolism from aerobic to fermentative [7–
11].
In dark anoxia the source of electrons for the hydroge-nases must come from the degradation of intercellular
car-bon stores, probably starch [7] as Chlamydomonas does not
appear to assimilate extracellular sugars. In this path, starch is broken into glucose and metabolized to pyruvate via glycolysis, which is then converted to acetyl-CoA by either pyruvate-formate lyase (PFL1) or pyruvate-ferredoxin
oxidoreductase (PFR1). One molecule of CO2is released in
the PFR1 reaction, and ferredoxin is reduced. It is ferredoxin
which passes electrons to the hydrogenase [12]. The
two steps by phosphate acetyl-transferase (PAT1 or PAT2)
and acetate kinase (ACK1 or ACK2) generating an ATP [11,
13]. Alternatively, acetyl-CoA may be converted to ethanol
by alcohol dehydrogenase1 (ADH1) reoxidizing two NADH
and thereby allowing glycolysis to continue [14].
In Chlamydomonas, in addition to these H2/CO2
/ace-tate/ethanol-generating pathways, a number of other fer-mentative pathways leading to a range of products are
present, among which, malate, lactate, and succinate [13,15,
16]. The relative production of each metabolite depends on
culture conditions [7,17]. The capability of Chlamydomonas
to vary its fermentation profile is known as “flexibility”, and it is of relevance for the development of strategies to engineer microorganisms for renewable energy production
[18]. However we still lack a detailed understanding of
fac-tors determining relative contribution of each pathway in response to stress and the role of each pathway in sustaining cell viability during anaerobiosis.
A number of factors that may function as switch be-tween pathways have been suggested. Acidification of the cytoplasm, a characteristic feature of the response of many
plant tissues to oxygen deprivation [19,20] activates
pyru-vate decarboxylase (PDC) and inhibits lactate dehydroge-nase (LDH) in higher plants. The cell thereby reduces lactate production and redirects the metabolism towards
ethanol fermentation [21]. The degree of anoxia may be
another potential path switch determinant. The proportion ethanol : acetate generated has been shown to depend upon
oxygen tension [22, 23]. Different time points following
anoxia induction may show different metabolic profiles. Such
is the case when anoxia is induced by sulfur starvation in the
light [16].
The activity of each pathway may influence the activity
of the others in a type of cross-regulation [24] and this
phenomenon is beginning to be studied by selectively block-ing individual pathways usblock-ing mutants or pharmaceuticals. A hydEF-deficient strain which produces no functional hydrogenase enzymes activated a new succinate fermentation pathway under anoxia which was not present in the back-ground strain instead of upregulating a preexistent pathway
[13]. A strain with an insertional mutation in the ADH1
gene which does not produce any ethanol in anoxia and in which no ADH1 protein can be detected also upregulates a new pathway, the synthesis and extracellular accumulation
of glycerol, not present in the background strain [14]. A
mutant strain unable to synthesize the PFL1 protein secretes
no formate but produces more ethanol, D-lactate, and CO2
than the wild type [24]. Interestingly, reduced levels of HYD1
transcript and HYD1 protein were found in pfl1 [24]. This
was unexpected as PFL1 may be viewed as a competitor for electrons with HYD1, such that its elimination should have forced more electrons through PFR1 and on to the hydroge-nase. It was suggested that the metabolite produced by PFL1, formate, could play a role in gene regulation and influence
the ratio of fermentative products [24]. In Chlamydomonas
the effects of formate have not been determined, but the plf1
mutant provides us with further insight into the complexity of the regulation of fermentative metabolism and proves
that the activation/deactivation of one pathway does not necessarily influence metabolic fluxes the way we expect.
Light availability (or absence) is also of relevance. Diverse conditions of light and dark affect starch degradation,
fer-mentative gene regulation and enzyme activity [7,13,24–
26], for example, the PFL1 gene is not upregulated in
response to anoxia under light to the same extent as it is
in response to dark anoxia [23]. Light is an input which
regulates which “sets the time” of the circadian clock. In this context it is interesting to note that Chlamydomonas shows diurnal variation of intercellular starch reserves, with a peak
starch content in the middle of the night [27]. A number
of genes involved in carbohydrate metabolism and fermen-tation were found to be under circadian control including
D-lactate dehydrogenase [28], a CoA-linked acetaldehyde
dehydrogenase and iron-dependent alcohol dehydrogenase (ADH1), a ferredoxin and the hydrogenase (HYD2) gene
itself [26,28].
In this work we examine the pattern of expression of selected fermentative gene in synchronous cells in a photope-riod and in response to continuous light/dark. Also, since the oxygen levels in the media of liquid cultures of Chlam-ydomonas depend on light conditions, we examine whether or not the observed patterns are determined by changes in
oxygen levels. We uncovered the existence of three different
gene expression profiles within the fermentative pathways,
which might be an indication of a differential adaptive
response of this green algae to different environmental inputs
or changing metabolic factors which can coexist with low oxygen stress.
2. Materials and Methods
2.1. Strains and Growth Conditions. The Chlamydomonas reinhardtii 11-32c wild-type strain was obtained from the algae collection of the Gottingen University, Germany. Cells were grown in Tris acetate-phosphate (TAP) medium (pH
7.2) as described by Harris [29]. Cell suspensions were
grown to a concentration of 1×10⁶cells mL−1. Synchronous
Chlamydomonas cell cultures were obtained by alternating light (12 h) and dark (12 h) periods for 6 days and main-tained by daily dilution of the cultures to a starting density of
cultures 106cells mL−1. Cell division was visually monitored
using a microscope and by counting cells with a B¨urker chamber. The light intensity during the light period was 70µmol m−2s−1. During 64 h long experiments, samples
were collected every 4 h and corresponding volume of fresh medium added. For the continuous darkness or light exper-iments, the culture was divided and one part was transferred to continuous darkness, one part was transferred to contin-uous light at the intensity given earlier, and one part was left in a 12 h : 12 h light : dark photoperiod.
The experiments described inFigure 3were performed
by continuously fluxing 1% oxygen or air (21% oxygen) in the flasks containing the cultures in a 12 h : 12 h light : dark photoperiod.
2.2. RNA Extraction and qPCR. Cultures of Chlamydomonas
pellet was resuspended in the following buffer diluted 1 : 1 with water: 2% SDS, 400 mM EDTA, 100 mM Tris-HCl (pH 8.0). The resulting solution was extracted once with phenol-chloroform 1 : 1 (v/v) supplemented with sodium-acetate 0.3 M (pH 5.0). The samples were vortexed briefly and centrifuged at 12,000 g for 10 min. The supernatant was extracted twice with phenol-chloroform (without sodium acetate), then extracted a final time in chloroform. Samples were precipitated using LiCl 8 M added 1 : 1 (v : v) for
4 h at 4◦C, centrifuged at 13000 g and the pellet washed
in 70% ethanol and finally resuspended in DEPC water. RNA quality was checked on 1% agarose gel, and quan-tified with spectrophotometric readings. RNA was sub-jected to a DNAse treatment using a TURBO DNA-free kit (Ambion, Inc., Austin, TX, USA). One microgram of each sample was reverse transcribed into cDNA with an iScript cDNA Synthesis kit (Bio-Rad). Real-time reverse-transcription polymerase chain reaction amplification was carried out with an ABI Prism 7000 sequence detection system (Applied Biosystems, Foster City, CA, USA), using the ribosomal protein L13 (RPL13) RNA as an house-keeping control gene, its expression was not affected by our treatments. The primers used were as follows: ribo-somal protein L13 (RPL13 fw AGCACGGCTAGAGACA-GATG; RPL13 rev TAGTGCGTGGCTGTTTGTTG); alcohol dehydrogenase 2 (ADH2 fw GGAGATCCTGGAGTTCAAGC; ADH2 rev CAGGGCACTCATACATCAGC); pyruvate decar-boxylase 3 (PDC3 fw CTGTGCGTGACCTTCTGTGT; PDC3 rev CTGTGCGTGACCTTCTGTGT); pyruvate formate lyase 1 (PFL1 fw CCGTTGGACTATGAGGAGGT; PFL1 rev GCC GCTCGTAGTCGTACTTG); pyruvate feredoxin oxidoreduc-tase (PFR1 fw CAGCAACCTGGTGGTGTTC; PFR rev GGT GATGGGGTAGATGAAGG); hydrogenase 1 (HYD1 fw GGG AACGTGGGTAGCATTTA; HYD1 rev ACACCAACGTCA ATCGCATA); lactate dehydrogenase 1 (LDH1 fw GAAGAT-GAAGAAGGGCGTCA; LDH1 rev CCGCCCTCATCTCATA-CAC).
A cDNA pool of all samples was analysed for a standard dilution series to monitor the qPCR efficiency for each primer pair. The PCR reactions were carried out using 40 ng of cDNA and iQ SYBR Green SuperMix (Bio-Rad Labora-tories Inc.) following the manufacturer’s protocol. Relative quantification of each mRNA was performed using the comparative CT method, as described by the manufacturer (ABI PRISM 7700 Sequence Detection System User Bulletin no. 2; Applied Biosystems).
3. Results
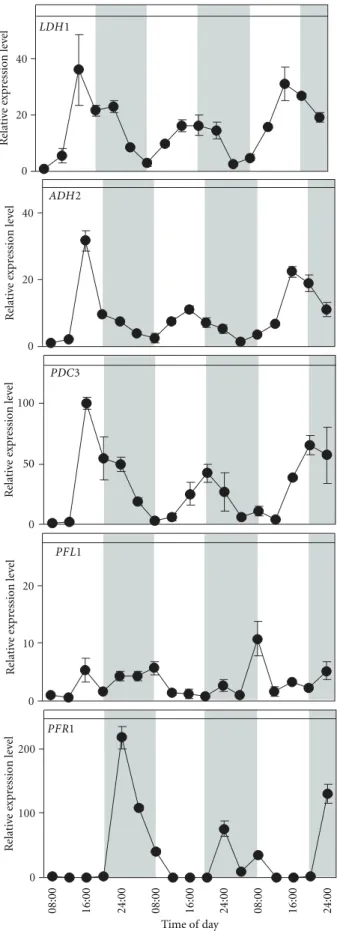
3.1. Daily Expression Profiles Differ in Different Branches of the Fermentative Pathway. Gene expression profiles were first analysed in conditions simulating those found in a Chlamy-domonas’ natural environment, in a 12 : 12 hour light : dark
photoperiod (Figure 1). Samples taken every 4 hours for
64 hours revealed that LDH1, ADH2, and PDC3, showed very similar expression patterns. All three genes showed the lowest expression level early in the morning, but a peak in the late afternoon between 4:00 pm and 8:00 pm, decreasing
their expression gradually during the night phase (Figure 1).
ADH2 and PDC3 genes, on the path to ethanol, showed a similar pattern as LDH1. Their pattern contrasted sharply with that of the gene on the path to hydrogen production, PFR1, which showed a peak in expression soon after the start of the night phase, then decreasing gradually during the night hours. PFR1 expression was virtually zero throughout
the light phase (Figure 1). While the aforementioned genes
followed a well-defined albeit contrasting pattern, PFL1,
which belongs to a different branch of the fermentative
path-ways, did not seem to follow a clear pattern (Figure 1). The
maximum amplitude of its oscillations was not more than 4-fold where as compared to the 30–200-4-fold amplitudes were observed for the above mentioned genes, and the oscillations seemed to be random. It is likely therefore that the peaks observed for this gene are baseline variations.
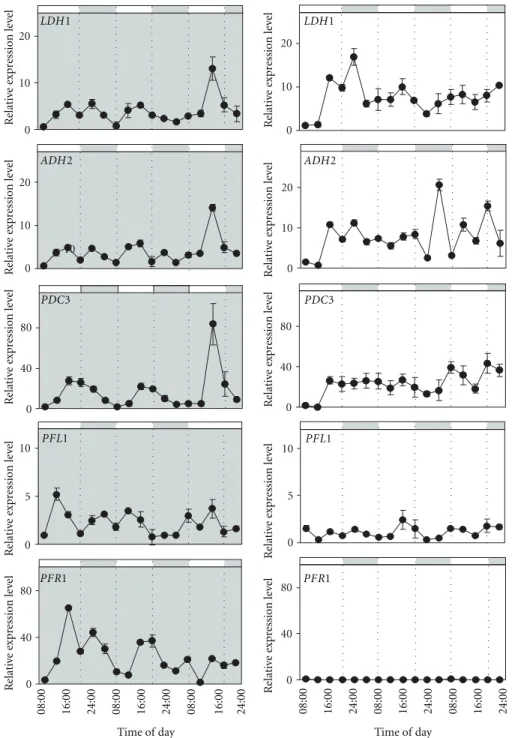
3.2. Genes in the Fermentative Pathway Respond Differently to Continuous Light and Continuous Dark. We wished to find out if the clear expression pattern shown in a 12 h : 12 h photoperiod by four of the five genes examined would be maintained under continuous light or dark. Also we were curious of the response of PFL1 to continuous light and dark, the only gene which had not shown a clear pattern of expres-sion in a photoperiod. As before, samples were taken every 4 hours for 64 hours. Out of all the genes examined, PDC3 maintained a near perfect oscillation pattern in continuous
dark, similar to that observed in a photoperiod (Figure 2).
ADH2 continued to show oscillation though it seems that the virtual day time peak was lowered, and a small dark phase peak was evidenced, highlighting the existence of a
double-peak for ADH2 in continuous dark (Figure 2). It cannot be
excluded that a small dark phase peak also exists for ADH2 when cells are grown in a photoperiod, it may simply be less visible due to the high late afternoon peak which is present
under these conditions (Figure 1). The LDH1 the gene
responsible for lactate production maintained a moderate fluctuation in continuous dark, though from our results the amplitude seems to be reduced when compared to the clear fluctuations observed in a photoperiod and the pattern becomes less and less clear after 48 hours of continuous dark
(Figures1and2). LDH1, ADH2, and PDC3 showed a similar
response to continuous light in that they lose their clear fluctuation pattern and remain expressed at a medium-high
level (Figure 2). Taken together, these observations suggest
that LDH1, ADH2, and PDC3 respond to two factors. A circadian input is certainly present, but this signal may be disrupted in the presence of continuous light. Results for PFL1 both in continuous dark and continuous light coincide with the results obtained for PFL1 in a photoperiod, and, that is, PFL1 expression seems unrelated to diurnal variation. In continuous dark PFL1 shows some fluctuation in expression, however the amplitude is low, not more than 5 fold, and
irregular (Figure 2). In continuous light, PFL1 expression
is lower than that observed in continuous dark (Figure 2).
PFR1 clearly differentiates itself from the other genes in that it maintains fluctuations in continuous dark, though
0 20 40 R elati ve e xpr ession le ve l LDH1 0 20 40 R elati ve e xpr ession le ve l ADH2 0 100 50 R elati ve e xpr ession le ve l PDC3 0 10 20 R elati ve e xpr ession le ve l PFL1 0 100 200 R elati ve e xpr ession le ve l 08:00 16:00 24:00 08:00 16:00 24:00 08:00 16:00 24:00 Time of day PFR1
Figure 1: Expression patterns for LDH1, ADH2, PDC3, PFL1, and PFR1 in synchronized Chlamydomonas cells over 3 cycles of day and night in control conditions (12 h : 12 h light : dark photoperiod; 23◦C), with samples taken every 4 hours. Relative expression levels were measured by real-time reverse-transcription polymerase chain reaction (qPCR) (1=the value of expression measured at the first data point which corresponds to 8:00 on the first day). Data are mean±SD,n=3 replicates. When not shown, the error bars were smaller than the symbols.
0 10 10 20 0 10 20 0 40 80 0 5 10 0 40 80 08:00 16:00 24:00 08:00 16:00 24:00 08:00 16:00 24:00 Time of day R elati ve e xpr ession le ve l R elati ve e xpr ession le ve l R elati ve e xpr ession le ve l R elati ve e xpr ession le ve l R elati ve e xpr ession le ve l LDH1 ADH2 PDC3 PFL1 PFR1 0 10 20 0 10 20 0 40 80 0 5 10 0 40 80 08:00 16:00 24:00 08:00 16:00 24:00 08:00 16:00 24:00 Time of day R elati ve e xpr ession le ve l R elati ve e xpr ession le ve l R elati ve e xpr ession le ve l R elati ve e xpr ession le ve l R elati ve e xpr ession le ve l LDH1 ADH2 PDC3 PFL1 PFR1
Figure 2: Expression patterns for LDH1, ADH2, PDC3, PFL1, and PFR1 in synchronized Chlamydomonas cells over 24-hour cycles are shown in continuous dark (left, shaded box) and continuous light (right, white box), with samples taken every 4 hours. Cells were grown at 23◦C. The bar on top of each graph depicts the corresponding virtual day/night periods. Relative expression levels were measured by real-time reverse-transcription polymerase chain reaction (qPCR) (1=the value of expression measured at the first data point which corresponds to 8:00 on the first day). Data are mean±SD,n=3 replicates. When not shown the error bars were smaller than the symbols.
less regular than those observed in a photoperiod, while in continuous light PFR1 expression is reduced nearly to zero. 3.3. Light/Oxygen Responsiveness of Genes in the Fermentative Pathway. In a photoperiod, oxygen in the culture media of synchronous cells is high during the day and low during
night phase [26]. We were curious to see how the fluctuations
observed would respond if the level of oxygen in the media
were controlled by influxing hypoxic gas or air. Also we wanted to check if the expression pattern of the genes could be influenced by the presence of light and dark under con-trasting oxygen availability. Synchronous cells were treated
with an influx of N2gas containing 1% O2were confronted
with synchronous cells influxed with air (=21% O2) both
in the light and in the dark. Sampling began at 8:00 in the morning and was done every 4 hours until 20:00. Once
10 20 0 20 40 0 160 80 10 20 0 0 400 200 0 200 400 12:00 16:00 20:00 0 08:00 21% O2 21% O2 1% O2 1% O2 R elati ve e xpr ession le ve l R elati ve e xpr ession le ve l R elati ve e xpr ession le ve l R elati ve e xpr ession le ve l R elati ve e xpr ession le ve l R elati ve e xpr ession le ve l 12:00 16:00 20:00 08:00 08:00 12:00 16:00 20:00 08:00 12:00 16:00 20:00 LDH1 ADH2 PDC3 PFL1 PFR1 HYD1
Time of day Time of day Time of day Time of day
Figure 3: The combined effect of 21% versus 1% O2influxation in the culture media and light versus dark on the expression of LDH1, ADH2,
PDC3, PFL1, and PFR1 followed a 12-hour period starting at 8 : 00 in the morning, with samples taken every 4 hours. Relative expression
levels were measured by real-time reverse-transcription polymerase chain reaction (qPCR) (1=the lowest value of expression measured in the 4 conditions). Data are mean±SD,n=3 replicates. When not shown, the error bars were smaller than the symbols.
again, the LDH1, ADH2, and PDC3 showed similar responses (Figure 3). In the presence of high oxygen and light, LDH1 showed a normal peak (similar to what was observed in a
photoperiod, Figure 1). In response to high oxygen in the
dark, a peak in expression was still present during the day, but
it was anticipated (Figure 3). In the presence of low oxygen
(both in the light and in the dark), the peak was slightly lower or, perhaps, delayed. We conclude that the daily fluctuations in expression observed for LDH1 are present independently of the concentration of oxygen or the presence of light/dark. The level of oxygen and light seems to modulate the pattern of the fluctuations without eliminating them. ADH2, on
the path to ethanol, did not seem particularly affected by
any of the oxygen treatments, apart from a lower peak of expression in the light in combination with low oxygen, as
also observed for LDH1 (Figure 3). PDC3 expression was
not affected at all by oxygen in the light, while it was influenced by the combined presence of low oxygen and dark (Figure 3). Under these conditions the peak was lowered, or, perhaps here as well, delayed. None of the treatments in this
experiment had an effect on PFL1 (Figure 3), as if to confirm
what was observed in the previously discussed experiments. PFR1, on the path to hydrogen, showed a markedly different response to the treatment. PFR1 expression was upregulated under low oxygen and eliminated in the presence of high
oxygen, independently of light conditions (Figure 3). We
were curious to see if the gene directly encoding the enzyme
responsible for hydrogen production, HYD1 [2] would show
a similar response oxygen and dark as PFR1, as the two genes are part of the same pathway. Indeed such was the case, although HYD1 expression, while visibly reduced in presence
of high oxygen (Figure 3), was not eliminated completely as
was observed for PFR1.
4. Discussion
Traditionally, fermentation is considered to substitute Krebs cycle and the electron transport elements of respiration in cases when oxygen is not available in order to regenerate NAD+ to allow glycolysis continue and produce at least some ATP. For organisms such as Chlamydomonas, which possesses a variety of fermentative pathways, a question arises as to which of these pathways will activate in the absence of oxygen, or perhaps will they all?
Four of the genes (LDH1, ADH2, PDC3, and PFR1)
studied in this paper fluctuated on a daily basis (Figure 1),
supporting results obtained in previous studies which take into examination the expression patterns of others
fermen-tative genes [26, 28]. However, LDH1, ADH2, and PDC3
differentiated themselves from PFR1 in that the first three show a day-time peak whereas the latter shows a night time peak suggesting that at least two different regulation profiles coexist in two different parts of the fermentative metabolism. PFL1, in contrast to the aforementioned genes,
did not show any regular daily fluctuations (Figure 1),
suggesting the existence of a third regulation profile within the fermentative pathways, or more likely, the insensitivity
of PFL1 to the other two regulatory pathways. The different
profiles of gene regulation identified in our experiments
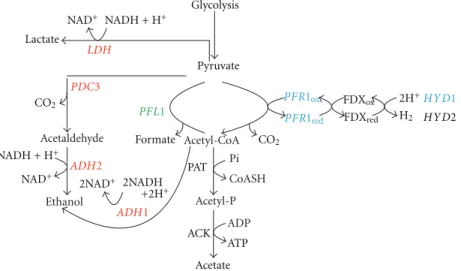
are represented in Figure 4. In this paper we investigated
some possible causes of these fluctuations, and in particular whether or not changes in light (dark) or low oxygen may influence them. Variations in light and oxygen availability are two regularly changing factors that occur over the day-night period in a natural context.
The results suggest the existence of a double input in the regulation of LDH1, ADH2, PDC3, and PFR1: circadian cycle regulation which can be interrupted in continuous
light, perhaps due to a loss of cell synchrony [26] as green
algae have been reported to lose synchrony within 24 hours
following exposure to continuous light [30,31]. The cell cycle
has been shown to be under circadian regulation [32] though
cell division is also gated by metabolic criteria (minimal volume and energy content), factors which in turn are
influ-enced by light through photosynthesis [30,31]. The observed
circadian fluctuations in fermentative gene expression might therefore be gated by other factors, among which contin-uous light due to its disruptive effect on the cell cycle. Interrupted circadian fluctuation of starch accumulation has been reported in Chlamydomonas in response to nutrient starvation, a condition which slows or stops the cell cycle
[27].
In photosynthetic organisms there is a tight relationship between light and oxygen availability. We showed that ADH2 expression is not influenced by light (dark) or oxygen status over a 12-hour period (which is too short a period for cell synchrony to be lost) and that for LDH1 and PDC3, only low oxygen tends to slightly reduce (or perhaps delay) the normal
midafternoon peek (Figure 3). Thus, variations in oxygen
availability and light (dark), within the range of values used in our experiments (which simulate conditions that might occur in a natural context) do not determine the presence of the fluctuations we observed in the expression of these genes. PFR1 expression, contrasting with what was observed for LDH1, ADH2, and PDC3 is completely eliminated in continuous light. Also, our experiments showed that PFR1 expression is upregulated by low oxygen, irrespective of light
conditions (Figure 3). When confronting PFR1 expression
with that of HYD1, the main gene responsible for hydrogen
production [2], we found that they showed a similar
response to combinations of light/dark and low/high oxygen (Figure 3), further supporting the hypothesis the hydrogen producing branch of the fermentative pathway, at least at the
mRNA level, is regulated differently than the branches that
lead to ethanol and lactate. It is tempting to speculate that PFR1 expression is under exclusive regulation by low oxygen, and that the absence of expression under light is an indirect consequence of oxygen production by photosynthesis. This would allow a coordinated expression of both PFR1 and HYD1 to produce hydrogen exclusively under anoxia.
PFL1 did not show regular fluctuations in any of the experimental conditions used in this paper suggesting the existence of a third expression profile within the fermentative metabolism. From our results, PFL1 does not appear to be modulated in response to stresses or environmental inputs at the RNA level. However the presence of a functional PFL1 protein is essential to the normal functioning of the other
Acetaldehyde Ethanol Acetyl-P Acetyl-CoA ACK Pi CoASH ADP ATP Glycolysis Pyruvate FDXox FDXred 2H+ H2 CO2 CO2 PAT 2NAD+ 2NADH +2H+ Acetate Formate NAD+ NAD+ NADH + H+ NADH + H+ Lactate HYD1 HYD2 LDH PDC3 ADH2 ADH1 PFR1ox PFR1red PFL1
Figure 4: Diagram depicting the fermentative pathways of Chlamydomonas split into 3 functional subpaths based on response profile to circadian inputs, light (dark), and oxygen in cells synchronized to a 12 h : 12 h light : dark photoperiod and grown at 23◦C. In red: LDH1,
ADH1, ADH2, and PDC3 which are under circadian regulation. In green: PFL1 which did not show a circadian pattern of expression, nor
did it respond to changes in light (dark) or oxygen. In blue: PFR1 and HYD1 which both show circadian expression patterns and are also responsive to changes in oxygen, but not to changes in light.
pathways, as its absence changes the fermentative product ratio and the change is not a simple increase of products produced by enzymes which compete for the same substrate
[24]. PFL1 catalyzes a reaction that produces formate as one
of its products. Formate is not a neutral metabolite, it has been suggested to play a role in gene regulation, possibly
repressing the hydrogen metabolism [24]. The involvement
of formate in the hydrogen metabolism has been
demon-strated in Escherichia coli [33]. In Chlamydomonas formate
is known to influence phothosyntesis by inhibiting electron
and proton transfers in photosystem II [34]. We found that
PFL1 is not influenced by light or oxygen leaving open the possibility of a feedback regulation by the product of its reaction, in support of what was suggested by Philipps et
al. [24]. We could hypothesize that this feedback regulation
may act to prevent the production of a metabolite which can downregulate of photosynthesis.
Whether variations in RNA prove to be correlated with
metabolic outcome or not, the existence of differential
regulation in different branches of the path is indicative
that different mechanisms are likely at work to determine
different types of fermentation. Factors determining switches
between fermentative pathways will be of particular interest in engineering Chlamydomonas for hydrogen production. Different branches of the pathways leading to different prod-ucts may determine changes in pH (lactic acid, acetic acid), cause (or limit) accumulation of toxic metabolites (ethanol), or either the reoxidation of NADH over the synthesis of ATP (or vice versa), according to current physiological
require-ments [21,23].
In the natural environment, in addition to changes in light availability and the possible occurrence of low oxygen conditions, organisms may be simultaneously subjected to other stimuli which, above a certain level of intensity or length of time they may be perceived as stresses. Temperature
typically varies on a daily basis and provides an input for
setting the circadian clock [35]. Internal factors such as cell
cycle status, and the circadian “time,” also vary at different
times of day. We believe that the precise physiological res-ponse to a change in a specific environmental factor will vary according to the status of the other inputs. Therefore, under given circumstances, a particular type of fermentation maybe suitable, but in other conditions, a different fermen-tative path may be preferable. The possession of numerous fermentative options certainly could be viewed as advantages for a water dwelling yet aerobic organism so easily subjected to low oxygen on a regular basis. Uncovering the precise role of each of these paths will represent an interesting theme for future research.
References
[1] H. S. Lee, W. F. J. Vermaas, and B. E. Rittmann, “Biological hydrogen production: prospects and challenges,” Trends in
Biotechnology, vol. 28, no. 5, pp. 262–271, 2010.
[2] J. E. Godman, A. Moln´ar, D. C. Baulcombe, and J. Balk, “Dis-tinct in-vivo functions of HYD genes in Chlamydomonas RNA silencing of hydrogenase(-like) genes and investigation of their physiological roles in the green alga Chlamydomonas
rein-hardtii,” Biochemical Journal, vol. 431, no. 3, pp. 345–351,
2010.
[3] S. T. Stripp, G. Goldet, C. Brandmayr et al., “How oxygen attacks [FeFe] hydrogenases from photosynthetic organisms,”
Proceedings of the National Academy of Sciences of the United States of America, vol. 106, no. 41, pp. 17331–17336, 2009.
[4] A. S. Steunou, D. Bhaya, M. M. Bateson et al., “In situ analysis of nitrogen fixation and metabolic switching in unicellular thermophilic cyanobacteria inhabiting hot spring microbial mats,” Proceedings of the National Academy of Sciences of the
[5] A. Melis, L. Zhang, M. Forestier, M. L. Ghirardi, and M. Seibert, “Sustained photobiological hydrogen gas production upon reversible inactivation of oxygen evolution in the green alga Chlamydomonas reinhardtii,” Plant Physiology, vol. 122, no. 1, pp. 127–135, 2000.
[6] A. Melis, “Photosynthetic H2metabolism in Chlamydomonas
reinhardtii (unicellular green algae),” Planta, vol. 226, no. 5,
pp. 1075–1086, 2007.
[7] R. P. Gfeller and M. Gibbs, “Fermentative metabolism of
Chlamydomonas reinhardtii. analysis of fermentative products
from starch in dark and light,” Plant Physiology, vol. 75, pp. 212–218, 1984.
[8] K. Kreuzberg, “Starch fermentation via a formate producing pathway in Chlamydomonas reinhardtii, Chlorogonium
elonga-tum and Chlorella fusca,” Physiologia Plantarum, vol. 61, pp.
87–94, 1984.
[9] S. Ohta, K. Miyamoto, and Y. Miura, “Hydrogen evolution as a consumption mode of reducing equivalents in green algal fermentation,” Plant Physiology, vol. 83, pp. 1022–1026, 1987. [10] A. Hemschemeier and T. Happe, “The exceptional photofer-mentative hydrogen metabolism of the green alga
Chlamy-domonas reinhardtii,” Biochemical Society Transactions, vol. 33,
no. 1, pp. 39–41, 2005.
[11] F. Mus, A. Dubini, M. Seibert, M. C. Posewitz, and A. R. Gross-man, “Anaerobic acclimation in Chlamydomonas reinhardtii: anoxic gene expression, hydrogenase induction, and metabolic pathways,” The Journal of Biological Chemistry, vol. 282, no. 35, pp. 25475–25486, 2007.
[12] A. Melis and T. Happe, “Hydrogen production. Green algae as a source of energy,” Plant Physiology, vol. 127, no. 3, pp. 740– 748, 2001.
[13] A. R. Grossman, M. Croft, V. N. Gladyshev et al., “Novel meta-bolism in Chlamydomonas through the lens of genomics,”
Cur-rent Opinion in Plant Biology, vol. 10, no. 2, pp. 190–198, 2007.
[14] L. Magneschi, C. Catalanotti, and V. Subramanian, “A mutant in the ADH1 gene of Chlamydomonas reinhardtii elicits meta-bolic restructuring during anaerobiosis,” Plant Physiology, vol. 158, no. 3, pp. 1293–1305, 2012.
[15] A. Dubini, F. Mus, M. Seibert, A. R. Grossman, and M. C. Posewitz, “Flexibility in anaerobic metabolism as revealed in a mutant of Chlamydomonas reinhardtii lacking hydrogenase activity,” The Journal of Biological Chemistry, vol. 284, no. 11, pp. 7201–7213, 2009.
[16] A. R. Grossman, C. Catalanotti, W. Yang et al., “Multiple facets of anoxic metabolism and hydrogen production in the unicel-lular green alga Chlamydomonas reinhardtii,” New Phytologist, vol. 190, no. 2, pp. 279–288, 2011.
[17] T. Matthew, W. Zhou, J. Rupprecht et al., “The metabolome of
Chlamydomonas reinhardtii following induction of anaerobic
H2production by sulfur depletion,” The Journal of Biological
Chemistry, vol. 284, no. 35, pp. 23415–23425, 2009.
[18] A. Melis, M. Seibert, and M. L. Ghirardi, “Hydrogen fuel pro-duction by transgenic microalgae,” Advances in Experimental
Medicine and Biology, vol. 616, pp. 110–121, 2007.
[19] R. G. Ratcliffe, “Intracellular pH regulation in plants under anoxia,” in Regulation of Tissue pH in Plants and Animals: A
Reappraisal of Current Techniques, S. Egginton, E. W. Taylor,
and J. A. Raven, Eds., pp. 193–213, Cambridge University Press, 1999.
[20] H. H. Felle, “pH regulation in anoxic plants,” Annals of Botany, vol. 96, no. 4, pp. 519–532, 2005.
[21] D. L. Couldwell, R. Dunford, N. J. Kruger, D. C. Lloyd, R. G. Ratcliffe, and A. M. O. Smith, “Response of cytoplasmic pH to anoxia in plant tissues with altered activities of fermentation
enzymes: application of methyl phosphonate as an NMR pH probe,” Annals of Botany, vol. 103, no. 2, pp. 249–258, 2009. [22] M. Mueller, “Energy metabolism: anaerobic protozoa,” in
Molecular Medical Parasitology, J. J. Marr, T. W. Nilsen, and R.
W. Komuniecki, Eds., pp. 125–139, Academic Press, London, UK, 2003.
[23] A. Atteia, R. Van Lis, G. Gelius-Dietrich et al., “Pyruvate for-mate-lyase and a novel route of eukaryotic ATP synthesis in Chlamydomonas mitochondria,” The Journal of Biological
Chemistry, vol. 281, no. 15, pp. 9909–9918, 2006.
[24] G. Philipps, D. Krawietz, A. Hemschemeier, and T. Happe, “A pyruvate formate lyase-deficient Chlamydomonas reinhardtii strain provides evidence for a link between fermentation and hydrogen production in green algae,” Plant Journal, vol. 66, no. 2, pp. 330–340, 2011.
[25] V. Chochois, D. Dauvillee, A. Beyly et al., “Hydrogen produc-tion in Chlamydomonas: PS11-dependent and independent pathways differ in their requirement on starch metabolism,”
Plant Physiology, vol. 151, pp. 631–640, 2009.
[26] L. A. S. Whitney, E. Loreti, A. Alpi, and P. Perata, “Alcohol dehydrogenase and hydrogenase transcript fluctuations dur-ing a day-night cycle in Chlamydomonas reinhardtii: the role of anoxia,” New Phytologist, vol. 190, no. 2, pp. 488–498, 2011. [27] J. P. Ral, C. Colleoni, F. Wattebled et al., “Circadian clock regulation of starch metabolism establishes GBSSI as a major contributor to amylopectin synthesis in Chlamydomonas
rein-hardtii,” Plant Physiology, vol. 142, no. 1, pp. 305–317, 2006.
[28] K. I. Kucho, K. Okamoto, S. Tabata, H. Fukuzawa, and M. Ishiura, “Identification of novel clock-controlled genes by cDNA macroarray analysis in Chlamydomonas reinhardtii,”
Plant Molecular Biology, vol. 57, no. 6, pp. 889–906, 2005.
[29] E. H. Harris, The Chlamydomonas Sourcebook. A
Comprehen-sive Guide to Biology and Laboratory Use, Academic Press, San
Diego, Calif, USA, 2001.
[30] J. L. Spudich and R. Sager, “Regulation of the Chlamydomonas cell cycle by light and dark,” Journal of Cell Biology, vol. 85, no. 1, pp. 136–145, 1980.
[31] M. Moulager, A. Monnier, B. Jesson et al., “Light-dependent regulation of cell division in Ostreococcus: evidence for a major transcriptional input,” Plant Physiology, vol. 144, no. 3, pp. 1360–1369, 2007.
[32] K. Goto and C. H. Johnson, “Is the cell division cycle gated by a circadian clock? The case of Chlamydomonas reinhardtii,”
Journal of Cell Biology, vol. 129, no. 4, pp. 1061–1069, 1995.
[33] R. G. Sawers, “Formate and its role in hydrogen production in
Escherichia coli,” Biochemical Society Transactions, vol. 33, no.
1, pp. 42–46, 2005.
[34] J. Xiong, J. Minagawa, A. Crofts, and Govindjee, “Loss of inhibition by formate in newly constructed photosystem II D1 mutants, D1-R257E and D1-R257M, of Chlamydomonas
rein-hardtii,” Biochimica et Biophysica Acta, vol. 1365, no. 3, pp.
473–491, 1998.
[35] O. Voytsekh, S. B. Seitz, D. Iliev, and M. Mittag, “Both sub-units of the circadian RNA-binding protein CHLAMY1 can integrate temperature information,” Plant Physiology, vol. 147, no. 4, pp. 2179–2193, 2008.